Abstract
The equilibrium stress-strain relation and the pore radius of the isolated tectorial membrane (TM) of the mouse were determined. Polyethylene glycol (PEG), with molecular mass (MM) in the range 20–511 kDa, added to the TM bathing solution was used to exert an osmotic pressure. Strain on the TM induced by isosmotic PEG solutions of different molecular masses was approximately the same for MM ≥ 200 kDa. However, for MM ≤ 100 kDa, the TM strain was appreciably smaller. We infer that for the smaller molecular mass, PEG entered the TM and exerted a smaller effective osmotic pressure. The pore radius of the TM was estimated as 22 nm. The equilibrium stress-strain relation of the TM was measured using PEG with a molecular mass of 511 kDa. This relation was nonlinear and was fit with a power function. In the radial cochlear direction, the transverse stiffness of the TM was 20% stiffer in the inner than in the outer region. TM segments from the basal region had a larger transverse stiffness on average compared to sections from the apical-middle region. These measurements provide a quantitative basis for a poroelastic model of the TM.
INTRODUCTION
The tectorial membrane (TM) is a gelatinous structure that overlies the mechanically sensitive hair bundles of sensory cells in the cochlea. Mouse models with specific mutations of TM components have been shown to exhibit hearing loss, suggesting that the TM plays an important role in hearing (1–4). However, these studies do not elucidate the mechanistic role of the TM.
In the absence of detailed information on the mechanical properties of the TM, theoreticians had to make assumptions about its mechanical properties. In some cochlear models, the TM has been thought to be mechanically stiff so as to act as a lever (5). Other models have treated the TM primarily as a mechanical load (6). Finally, some have treated the TM as a spring and mass, which together act as a resonant system (7,8). Unfortunately, recent measurements of mechanical properties of the TM do not agree with any of these cochlear models (9). Instead, dynamic point stiffness measurements have shown that the TM impedance lies between that of a pure viscous and a pure elastic element. However, no simple cascade of lumped-parameter viscous and elastic elements fits the measurements. New models of the TM are clearly needed, and new measurements are required to define these models.
The fact that the TM is 97% water and contains macromolecular polyelectrolytes suggests that the TM is a gel (10,11). In other biological gels composed of a fluid and solid phase, such as cartilage and corneal stroma, the theory of poroelasticity has been successfully applied to describe deformational behavior (12,13). Poroelastic models explicitly account for the viscous flow of fluid through pores when the specimen undergoes stress. One important constitutive relation of a poroelastic material is the equilibrium stress-strain relation. A constant stress applied to any material results in a time-varying strain, which eventually comes to equilibrium. The relation between the applied stress and the equilibrium strain is called the equilibrium stress-strain relation. Another important bulk property of poroelastic materials is the effective pore radius. Knowing the pore radius allows for the calculation of intermolecular interactions and the hydraulic permeability of the TM. Both of these properties can be measured in many larger specimens such as cartilage by placing the tissue in a dynastat and applying mechanical pressure and measuring the resulting strain.
However, due to the small size (one-fifth the thickness of a human hair) and fragility of the TM, the dynastat method is difficult to use. One approach to determining material properties of the TM is to combine point indentation measurements with a computational model (14). Here we introduce a method that utilizes osmotic pressure to exert stress, and we calculate the longitudinal modulus directly from the measured strain. Previously, it has been shown on other specimens that using osmotic pressure to apply stress is similar to using mechanical pressure (15–17). In preliminary studies, polyethylene glycol (PEG) solutions were used to apply osmotic pressure to the TM (11,18,19). However, there are two important caveats to using this method.
First, the osmotic pressure of PEG solutions must be determined. Measurements of the osmotic pressure of high molecular-mass PEG solutions are not routine. Furthermore, the osmotic pressure of PEG solutions does not obey van' t Hoff's law but is a nonlinear function of concentration and depends upon molecular mass. Second, if PEG can penetrate the TM, then its osmotic pressure is not fully expressed. In this article, we have addressed and resolved these two issues and have used PEG-induced osmotic stress to measure strain and to estimate both the equilibrium stress-strain relation and the effective pore radius of the mouse TM.
METHODS
Methods common to experiments on TM and PMAA specimens
Many of the methods used to measure the stress-strain relation of specimens, both the TM and PMAA (polymethacrylic acid) gels, are similar to those used in previous studies of the TM (20–22). Briefly, the specimen was placed on a glass slide, decorated with transfluospheres (carboxylate-modified fluorescent microspheres, i.e., beads), and immersed in a bathing solution. Images of sections of the specimen were recorded after the specimen was immersed in a given solution for at least 1 h. One hour was found to be sufficient time for the TM position to stabilize (11). Since bright-field images show that beads end up resting on the surface of the specimen, bead position was used as a marker for the specimen surface. Bead positions were tracked to estimate changes in specimen height in solutions of different composition.
Solutions
All the solutions were variations of an artificial endolymph (AE) solution, which contained in mM: 2 mM NaCl, 3 mM dextrose, 0.02 mM CaCl2, 5 mM HEPES, and 174 mM KCl. This composition closely matches the measured ionic composition of endolymph in the mammalian cochlea (23–26). The pH of the solution was adjusted to 7.3. PEG solutions were made by adding PEG to the same stock solution of AE to insure that the only difference in solutions was due to PEG. PEGs of molecular masses of 20, 40, 108, 205, 438, and 511 kDa were used to vary the osmotic pressures over the range 0–10 kPa.
Measurement methods
The measurement system consisted of a compound microscope (Zeiss Axioplan2, Thornwood, NY) with a 25× water immersion objective with numerical aperture of 0.8; a fluorescence filter block (Nikon blue excitation filter block B-2A, Tokyo, Japan) with an excitation filter wavelength of 450–490 nm; a dichromatic mirror with cut-on wavelength of 500 nm and emission filter with cut-on wavelength of 515 nm; a CCD camera (Pulnix TM1010, Copenhagen, Denmark); a video digitizer (Imaging Technology PC-DIG, Coreco Imaging, PC-DIG, Quebec, Canada); and a personal computer (Dell Precision 410, Round Rock, Texas). Images were taken at 1 μm spacing, 1 h after each solution change. In addition to bright-field images, fluorescent images were also collected to facilitate the measurement of bead position. The images from the CCD camera were digitized and saved for later analysis.
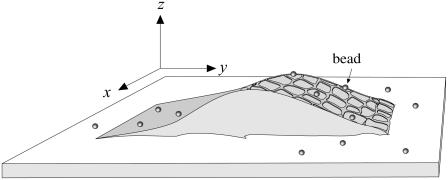
The z-locations of the beads as defined in Fig. 1 were determined with subpixel accuracy. First, the user selected beads to be tracked on both the specimen and the glass slide. The location of each bead was detected by first isolating a 30 × 30 × 100 pixel volume (= 10.8 × 10.8 × 100 μm3 volume) surrounding the initial location of the bead. Power, P, in the z-plane is defined as
 |
(1) |
where i, j, and k are the digitized positions in the x, y, and z planes, respectively, and B is the digitized brightness. The k-plane for which the power was maximum is kmax. Subpixel resolution was obtained by interpolating the power function as a function of k and determining the value of z at peak power. This value of z has subpixel accuracy. The interpolation was done by determining a least-squared fit of a quadratic function to the power values at kmax and three planes on either side of kmax.
FIGURE 1.
Schematic diagram of an isolated TM decorated with fluorescent beads. The x, y, z coordinates of bead locations are defined as shown.
The x and y locations of beads could change from image to image for two reasons. The beads could change locations with respect to the glass slide on which the TM was mounted and the glass slide position could change. To determine the latter motion, we tracked marker beads attached to the glass slide. The transformation (both translation and rotation) from the first image to all later images was determined from these marker beads. The same transformation was applied to all beads in that image. This process corrected the bead positions for changes in position of the slide between images. Once every image was corrected for motion of the slide, corresponding beads were found by finding the bead with the smallest squared distance from the original position of the bead. Video images were reviewed to visually confirm the matches between corresponding beads.
Solution exchange protocol
The viscosity of solutions that contain PEG increases with both the molecular mass and concentration of PEG. When either PEG molecular mass or concentration was large, the resulting fluid was too viscous to be perfused by peristaltic pumps. Therefore, all solution changes were done manually by transferring the old solution out and perfusing the new solution into the chamber with a micropipette. For each solution change, this procedure was repeated at least four times to minimize contamination of the current test solution with the previous one. Moreover, for all experiments using PEG of different molecular masses, care was taken to perfuse the specimen with higher molecular-mass PEG first to minimize the chance that smaller molecular-mass PEGs diffused into the specimen. Finally, between every change of solution osmotic pressure or PEG molecular mass, the bathing solution was changed to AE to determine whether the specimen returned to its isotonic volume.
Data analysis
To characterize TM thickness, we measured the z-positions of beads relative to that of the underlying glass as follows. First, the positions (xn, yn, zn) of each of the n beads attached to the glass surface were determined. A plane of the form
 |
(2) |
was then fit to these positions by finding the values of a, b, and c that minimize the sum of squared differences,
 |
(3) |
The measured positions (xm, ym, zm) of each bead on the TM then provided an estimate of TM thickness at the point (xm, ym):
 |
(4) |
To determine the relation between strain and stress for the TM, we measured TM thicknesses in baths with different concentrations of PEG with different indices of refraction. Therefore, we had to insure that measurements of bead position in different solutions were not affected by differences in solution index of refraction. Since our measurements were obtained with a water immersion microscope objective, the primary effect of the change in index of refraction is a change in the plane of best focus of the objective. Each of our measurements of TM thickness is based on the difference in the z-positions of pairs of beads that were both measured in the same solution of PEG. Thus the difference should be insensitive to PEG concentration. To test this idea, we measured the thickness of a microfabricated test structure whose thickness was independently determined to be 14 μm. The measured thickness of the structure differed by <0.19 μm when measured with water and when measured with the highest concentration of PEG (511 kDa) used in this study.
The ratio of bead height in the presence of PEG to that in its absence is the fractional bead height, vz, caused by the osmotic pressure of PEG. The z-component of the strain, εz, is calculated from vz by the relation
 |
(5) |
Osmotic pressure of PEG solutions
The osmotic pressure of PEG solutions for high molecular-mass PEG cannot be measured reliably with a conventional vapor-pressure osmometer; more sophisticated methods are required (27). In addition, the osmotic pressure of PEG solutions does not obey van' t Hoff's law so that it cannot be computed as proportional to the PEG concentration. Fortunately, a model has been developed for the dependence of the osmotic pressure of PEG solutions on both the concentration of PEG and its molecular mass, which fits the measurements well for 200 ≤ MM ≤ 40,000 Da. We have used PEGs with molecular mass above this range and hence we have checked the validity of the model for the higher molecular mass used in our experiments.
Model for osmotic pressure of PEG
The osmotic pressure of an ideal solution is defined by van' t Hoff's law,
 |
(6) |
where R is the molar gas constant, T is the absolute temperature, and Cs is the total concentration of solute.
However, experimental measurements have shown that the relation between PEG concentration and osmotic pressure deviates significantly from van' t Hoff's law in two ways (27–29). The osmotic pressure is a nonlinear function of concentration and depends upon molecular mass. Therefore, osmotic pressure is not a colligative property for PEG solutions.
For a nonideal solution, the osmotic pressure, πs, can be expressed as
 |
(7) |
where Ws is the molecular mass of the solute, and α and β are the virial coefficients. The first term in this expression describes van' t Hoff's law. The virial coefficients of PEG in aqueous solution were determined using both laser-light scattering data and isopiestic data (27) and are given by the equations
 |
(8) |
 |
(9) |
where the reference temperature Tθ = 375.5 K. The value α has units of mol/cm3/g2 and β has units of mol/cm6/g3. The virial coefficients, α and β, are independent of molecular mass within the range 200–40,000 Da.
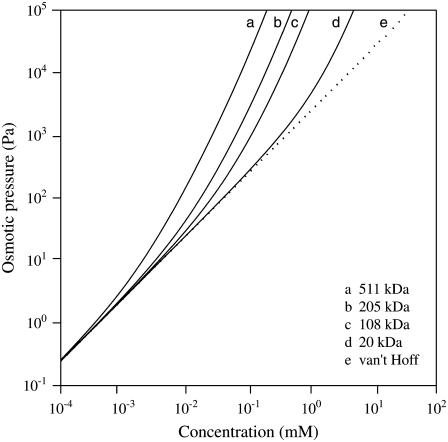
Fig. 2 shows the dependence of osmotic pressure on PEG concentration and molecular mass predicted by this theory. The deviation of osmotic pressure from van' t Hoff's law increases as both the PEG concentration and the molecular-mass increase.
FIGURE 2.
Osmotic pressure for PEG of different molecular masses as a function of concentration. The dotted line represents the relation between osmotic pressure and concentration given by van' t Hoff's law, which is independent of molecular mass. The solid curves show the relation between pressure and concentration according to Eqs. 7–9 with T = 298 K.
Tests with PMAA gels
To determine whether the theory described by Eqs. 7–9 could be extrapolated to the range of PEG molecular masses we used in experiments on the TM, we tested the theory by measuring the stress-strain relation of PMAA gels whose stress-strain relations had been measured using hydraulic pressure.
Method of making polymethacrylic acid (PMAA) gels. The composition of the PMAA gel was as described previously (30). However, to mimic the TM experiment as closely as possible, the PMAA gels were stuck on a glass slide and had a maximum thickness of ∼100 μm. The gel was polymerized on a pretreated glass slide. The glass slide was treated by spin-coating a solution containing 3 mL of distilled water, 1.8 mL of acetic acid, and 1.2 mL of 3-(Trimethoxysilyl)propyl methacrylate 98% solution (31). Once the glass slide was treated, <1 μL of gel solution was pipetted on the glass slide and a coverslip was placed on top of the gel solution. Another glass slide was placed on top of the coverslip so that the coverslip could be clamped into position. The whole ensemble was placed in a 60° C water bath for 4 h to allow the gel further time to polymerize. After polymerization, the glass slide and coverslip that covered the PMAA gel were removed and the gel was washed overnight in deionized water. The gel was then placed in an unbuffered 50 mM KCl solution at pH 11 for two days.
Stress-strain relations of PMAA gels obtained with both osmotic pressure using PEG solutions and with hydraulic pressure. Using methods identical to those used to measure the stress-strain relation of the TM, we measured the stress-strain relation of PMAA gels using PEG with a molecular mass of 511 kDa. The PEG concentrations were calculated according to Eqs. 7–9 to achieve a desired osmotic pressure in the range 0–30 kPa. Higher osmotic pressures could not be applied since the PEG solutions became too viscous. However, the maximum osmotic pressure used (30 kPa) on the PMAA gels exceeded the maximum used on the TM (10 kPa).
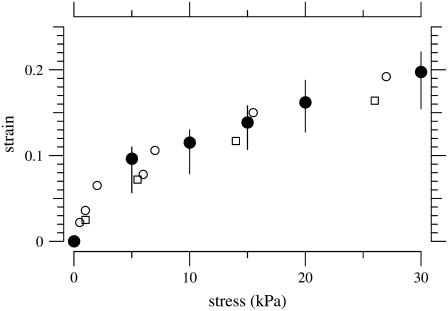
The stress-strain relation of the PMAA gel is shown in Fig. 3 both for our measurements using PEG to generate osmotic stress and for measurements on similar gels using hydraulic pressure applied in a dynastat (30). The fact that the stress-strain relation obtained osmotically is similar to that obtained hydraulically suggests that the osmotic pressure obtained using Eqs. 7–9 is valid for a molecular mass as high as 511 kDa and osmotic pressure as high as 30 kDa. Therefore, we have used these equations to compute the osmotic pressure of PEG solutions in experiments on the TM.
FIGURE 3.
Equilibrium stress-strain relation of a PMAA gel. The solid circles represent the median value of the strain for a given stress applied using PEG solutions to exert osmotic pressure. The vertical lines shows the interquartile ranges. The solutions contained 174 mM KCl. The open symbols represent the stress-strain relation measured using hydraulic pressure with a dynastat in different KCl concentrations; open circles and open squares represent KCl concentration of 100 mM and 200 mM, respectively (30).
Preparation of the TM
Adult male mice (strain ICR, 25–32 grams, Taconic, Hudson, NY) were asphyxiated with CO2 and then decapitated. The pinnae and surrounding tissues were removed and the temporal bone was isolated. Both the oval and round windows were opened and AE solution was perfused into the round window to flush out the perilymph. This was done to reduce TM exposure to perilymph to which the TM is not normally exposed in situ. Under a dissecting microscope, the temporal bone was chipped away to isolate the cochlea. The cochlea was then placed in AE and the rest of the surgery was done in a petri dish filled with AE. The microscope illumination was adjusted between bright-field and dark-field illumination so that the TM could be identified. The TM was isolated from the rest of the cochlea using an eyelash. Tissue adhesive (Cell Tak, Collaborative Research, Bedford, MA) was placed at the bottom of the experimental chamber and washed with both ethanol and deionized water. Using a micropipette with a glass tip, the TM was transferred from the petri dish to the experimental chamber filled with AE. The TM was positioned on the Cell Tak with an eyelash to prevent the TM from drifting around in the chamber once the experiment started. The TM could land with the covernet up or down because we saw no significant difference in the stress-strain relation for the two conditions. Therefore, covernet orientation is not reported here. To improve visualization of the TM surface, beads with diameters of ∼1 μm and maximum excitation wavelength of 488 nm and maximum emission wavelength of 560 nm were pipetted onto both the TM and the glass slide.
The care and use of animals reported in this study were approved by the Massachusetts Institute of Technology Committee on Animal Care.
RESULTS
Effect of PEG on TM structure
Effect on TM fibrillar structure
To determine the effect of PEG on TM fibrillar structure, bright-field images of the TM were taken throughout the experiment as shown in Fig. 4. Fig. 4 a shows an image taken at the beginning of the experiment in AE. Radial and longitudinal fibers as well as Hensen's stripe and the limbal attachment are prominent. Fig. 4 b shows the TM when immersed in AE solution containing PEG of MM 511 kDa exerting an osmotic pressure of 10 kPa. In this focal plane, both the radial and longitudinal fibers are still discernible although less prominent than in Fig. 4 a, but Hensen's stripe and the limbal attachment are barely discernible. When returned to AE solution (Fig. 4 c), the TM appearance is similar to that seen at the beginning of the experiment (Fig. 4 a). Thus, the fibrillar structure of the TM seen in light microscopy showed reversible changes in response to changes in osmotic pressure. Furthermore, in measurements with PEGs of different molecular masses and different osmotic pressures, it was our impression that it was the osmotic pressure, rather than either the PEG molecular mass or concentration, that resulted in these reversible changes in the fibrillar structure.
FIGURE 4.
Bright-field images of the TM when exposed to (a) AE; (b) AE + PEG with a molecular mass of 511 kDa at a concentration required to apply an osmotic pressure of 10 kPa at 1 h; and (c) AE at 2 h. Images were normalized by dividing each pixel by the average value of its neighbors in a 51 × 51 pixel region. One longitudinal and radial fiber, Hensen's stripe and limbal attachment have been traced in panel a. The value Δt, shown in the lower right of panels b and c, represents the time elapsed since the image in panel a was obtained.
Effect of PEG on TM thickness
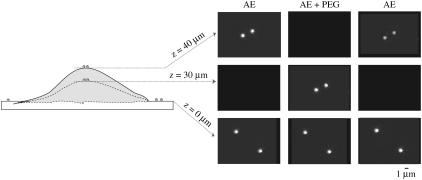
The effect of PEG on TM thickness is illustrated in Fig. 5, which shows fluorescent images of the beads on both the TM and the glass slide taken at different focal planes and in different bathing solutions. Initially, when the TM was immersed in AE solution, the fluorescent beads were in focus 40 μm from the glass slide indicating that the TM at this location was 40-μm thick. In the presence of an AE solution containing PEG with a molecular mass of 511 kDa with an osmotic pressure of 250 Pa, the beads were in focus 30 μm from the glass slide, indicating that the TM shrank by 10 μm. Finally, when the TM was returned to AE solution, the beads on the top of the TM were in focus 40 μm from the glass slide, indicating that the TM returned to approximately its original thickness. These results indicate that the thickness of the TM shows reversible shrinkage in response to increases in osmotic pressure.
FIGURE 5.
The right side shows fluorescent images of two beads on the TM and two on the glass slide. The columns correspond to different bathing solutions. Each row shows images in a different focal plane. The left side shows a schematic diagram of the profile of the TM and glass slide. In AE, the beads are in focus at a height of 40 μm. When PEG is added to the AE solution, the TM shrinks and hence the two beads on the surface of the TM are in focus at 30 μm. The beads on the surface of the glass slide remain in focus at the same height in both solutions.
Dependence of TM strain on PEG molecular mass for isosmotic solutions
A previous study showed that increasing the osmotic pressure of the bathing solution produced quite different changes in TM thickness when different solutes were used. Addition of 10 mmol/L of glucose produced no discernible change in thickness, whereas addition of 10 mmol/L of PEG with a molecular mass of 20 kDa produced a sustained shrinkage of the TM (see Fig. 17 in (11)). This was interpreted to indicate that glucose freely penetrated the TM and hence did not produce an osmotic effect. In contrast, PEG with a molecular mass of 20 kDa did not penetrate the TM as freely as did glucose.
FIGURE 17.
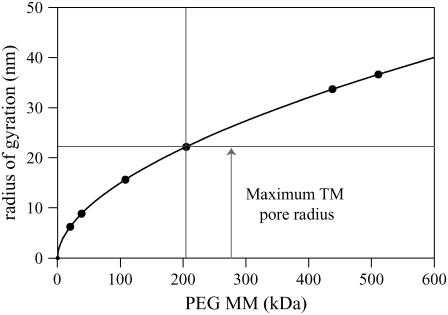
Radius of gyration versus molecular mass of PEG as calculated from Eqs. 16 and 17 (solid line). The data points are the values of the radius of gyration for each molecular mass of PEG used in our experiments.
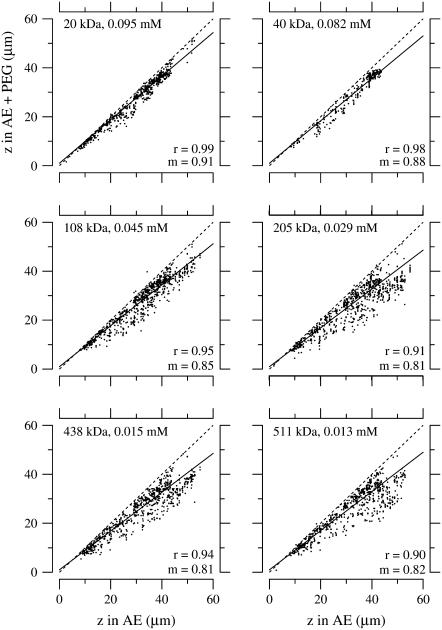
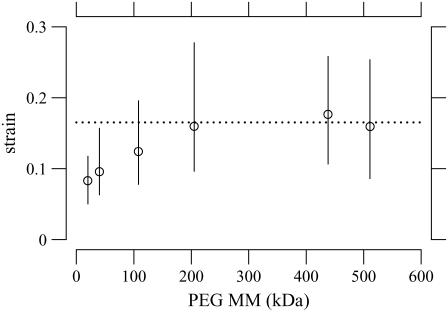
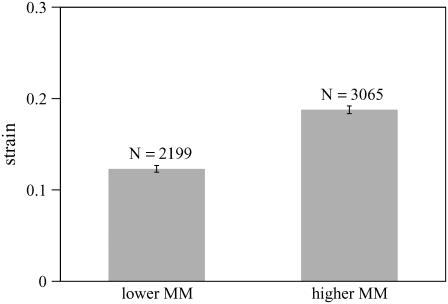
To determine the extent to which PEG penetrates the TM, we measured the TM thickness for PEG of different molecular masses at the same osmotic pressure of 250 Pa. The concentration of PEG required to obtain an osmotic pressure of 250 Pa was determined by Eqs. 7–9. Fig. 6 shows the change in TM thickness for three experiments when the TM was exposed to solutions containing PEG with different molecular masses. Almost all the points lie below a line-of-unity slope indicating that, for all molecular masses, the TM shrank in response to an increase in osmotic pressure. To a first-order, changes in thickness at each osmotic pressure are proportional to the original thickness over most of the TM. These results are consistent with those seen in a previous study (22). However, with closer analysis, dependence on radial position was seen (see Dependence on the Radial Direction section). Note also that the slope of the regression line is appreciably higher for molecular mass of 20 and 40 kDa than for the other molecular masses, indicating that the shrinkage of the TM is smaller at the lower molecular masses. This point is made more clearly in Fig. 7, which summarizes the data of Fig. 6 by plotting the strain as a function of PEG molecular mass. The strain was computed from the fractional change in TM thickness by Eq. 5. For PEG MM ≥ 200 kDa, the average TM strain is independent of molecular mass. However, for MM ≤ 100 kDa, the TM strain is appreciably smaller. To determine whether the difference in strain between lower and higher molecular masses is statistically significant, the mean and standard error of the mean are plotted in Fig. 8 for both lower and higher molecular mass. A t-test of these data showed that the difference in mean strains between these two populations was highly significant (p-value of 1.6 × 10⁻²²).
FIGURE 6.
Effect of isosmotic solutions with different PEG molecular mass on TM thickness. Thickness (z) of TMs from the apical-middle regions in PEG solutions versus that in the absence of PEG. Each solution contained AE. Different concentrations of PEG were added to each solution so that the osmotic pressure exerted by that particular molecular-weight PEG was equal to 250 Pa according to Eqs. 7–9. Each dot represents one bead on one of three TMs. The solid and dashed lines represent a regression line fit to the data and a line of unity slope, respectively. The values of the slope and correlation coefficient of the regression lines are given by m and r, respectively.
FIGURE 7.
TM strain as a function of PEG molecular mass for an applied osmotic pressure of 250 Pa. This plot summarizes data from the same experiments as in Fig. 6. The circles represents the median strain. The lengths of the solid vertical lines indicate the interquartile ranges of the measurements. The horizontal line is at a strain of 0.16, which is the average value for MM ≥ 200 kDa.
FIGURE 8.
Histogram of strain for two ranges of molecular mass; same data as in Fig. 7. The lower molecular mass includes all the data for MM ≤ 100 kDa and the higher molecular mass includes all the data for MM ≥ 200 kDa. The height of each bar equals the mean strain and the vertical line segments have lengths that equal twice the standard error of the mean. N is the number of data points.
Average stress-strain relation of the TM
The stress-strain relation was measured in 16 segments of the TM; 11 from the apical-middle regions of the TM and five from the basal region. Their larger size makes apical-middle segments easier to manipulate than basal segments. The stress-strain relation was measured in the two regions of the TM to determine whether this relation varied with longitudinal position in the cochlea.
Nonlinear stress-strain function
To determine the stress-strain relation of the TM, stress was applied by subjecting the TM to osmotic pressure in the range 0.025–10 kPa with solutions that contained PEG with a molecular mass of 511 kDa. At this molecular mass, PEG does not appear to permeate the TM appreciably. Thus, PEG should exert its full osmotic pressure. We measured the change in thickness of the TM relative to its thickness in AE solutions that contained no PEG and used Eq. 5 to compute the strain.
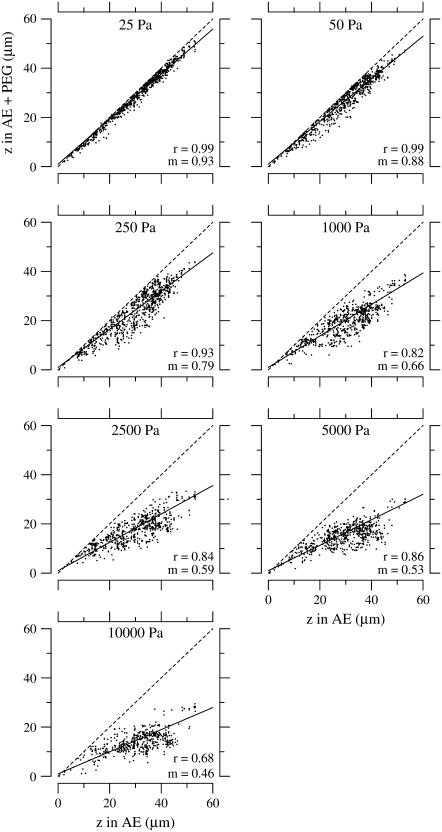
Fig. 9 shows the change in TM thickness relative to its original thickness for all the beads in 11 experiments from the apical-middle region of the cochlea when the TM was exposed to solutions of different osmotic pressures. The vast preponderance of the data points fell below a line of equality, showing that the TM shrank in response to an increase in osmotic pressure. The slope of the solid line represents the median fractional change in TM thickness for a given osmotic pressure. As the osmotic pressure increased, the TM shrank more, as indicated by the decrease in the slope of the regression line. The correlation coefficient of the fit also decreased from 0.99 at low osmotic pressures when there was little shrinkage of the TM, to 0.68 at the highest osmotic pressure when the shrinkage of the TM was appreciable.
FIGURE 9.
Effect of osmotic pressure on TM thickness. Thickness (z) of the TM in PEG solutions versus that in the absence of PEG. Only apical-middle segments of the TM were used. The PEG solutions were made with PEG with a molecular mass of 511 kDa. Each dot represents one bead on one of the 11 TMs. The solid and dashed lines represent a regression line fit to the data and a line of unity slope, respectively. The values of the slope and correlation coefficient of the regression lines are given by m and r, respectively.
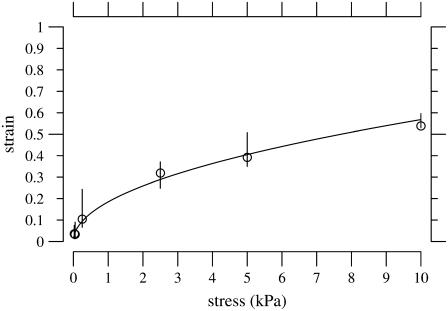
Fig. 10 shows the measured strain as a function of applied stress for one TM from the apical-middle region. Previous researchers (30), who measured stress-strain relations of polyelectrolyte gels, found it useful to fit their measurements with power functions. Therefore, we tried to fit the stress-strain relation of the TM with the power function
 |
(10) |
where σ is the stress and εz is the z-component of the strain. We fit this power function to the measured stress-strain relation of each TM so as to minimize the mean-squared error between the measurements and the power function in log-log coordinates. Each fit yielded estimates of the parameters of the power function. The fit of a power function to the measurements of one TM is shown in Fig. 10.
FIGURE 10.
Strain as a function of applied stress for a TM segment from the apical-middle region. The strain was computed from the fractional change in TM thickness by Eq. 5. The plot symbols are the median strains and the lengths of the vertical lines show the interquartile ranges of the measurements. The solid line is a power function fit to the data according to Eq. 10 with a = 0.24 and b = 0.36.
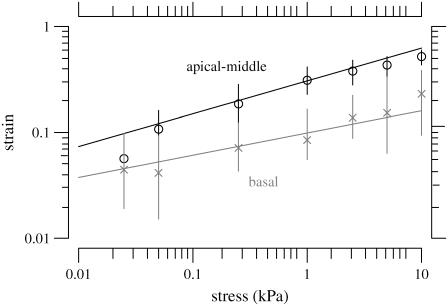
For the jth TM we obtained the estimates of the power function parameters {aj,bj}. The median and interquartile range of these estimates were  and {IQRa,IQRb}, respectively. Fig. 11 summarizes the fit of the power law to all our data from apical-middle and basal segments of the TM plotted in logarithmic coordinates, which plot a power function as a straight line. The apical-middle data are from the same 11 experiments as in Fig. 9. The composite data are fit closely by a power function over most of the range of stress. The parameters of the fit of power functions to the stress-strain functions are shown in Table 1. Since the data from all apical-middle sections of the TM were pooled, irrespective of radial or longitudinal position within the segments, the results reflect the strain averaged over location in the TM segment for this region.
FIGURE 11.
TM stress-strain functions for all of the basal and apical-middle segments of the TM. Plot symbols represent the median strains and the lengths of vertical lines show the interquartile ranges. The solid line is a power law fit to the data according to Eq. 10 with a = 0.31 and b = 0.31 for the apical-middle segments and a = 0.10 and b = 0.21 for the basal segments. The basal data are shaded to help distinguish them from the apical-middle data.
TABLE 1.
Stress-strain functions for apical-middle and basal TM segments
| Apical-middle | Basal | |
|---|---|---|
| Number of TMs | 11 | 5 |
| Stress-strain function fits | ||
 |
0.31, 0.11 | 0.10, 0.10 |
 |
0.31, 0.08 | 0.21, 0.19 |
| Modulus-stress function fits | ||
 (@ 25 Pa) (@ 25 Pa) |
0.47, 0.11 kPa | 0.53, 0.34 kPa |
 (@ 5 kPa) (@ 5 kPa) |
11.52, 4.02 kPa | 24.92, 69.66 kPa |
 |
3.26, 1.41 kPa | 10.12, 11.72 kPa |
 |
0.69, 0.06 | 0.78, 0.19 |
| TM thickness at Hensen's stripe | ||
 |
43.75, 6.00 μm | 31.60, 4.50 μm |
Results obtained for apical-middle and basal segments of the TM. Estimates are given of the parameters of power functions fit to measured stress-strain functions and modulus-stress functions. The value of the chord longitudinal modulus (kPa) is shown at a low stress (25 Pa) and high stress (5 kPa). The thickness of each TM was measured at Hensen's stripe when the TM was immersed in AE. The median and interquartile range, IQR, are given for each variable.
Modulus-stress function
Because the stress-strain function of the TM is nonlinear, the bulk modulus is not uniquely defined. Moreover, the strains in the radial and longitudinal directions were small (22), hence the moduli that was measured is the longitudinal modulus (30). The chord and slope longitudinal modulus, Mc and Ms, respectively, can be defined in terms of the z-component of the strain as
 |
(11) |
where both moduli depend upon the stress. If the stress-strain function is a power function as in Eq. 10, then the two moduli become
 |
(12) |
which shows that the two moduli differ only by a factor of b. The modulus-stress function is also a power function but the exponent differs from that of the stress-strain function.
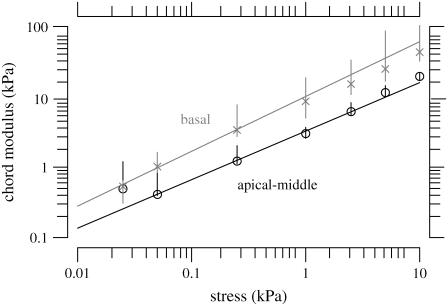
Since calculation of the slope longitudinal modulus is inherently more variable because first differences of strain values are taken, and since the slope longitudinal modulus gives no additional information over the chord longitudinal modulus, we computed the chord longitudinal modulus directly from the measured data and plotted this modulus against the applied stress (Fig. 12). Once again the data are plotted in logarithmic coordinates so that power functions plot as straight lines. The results show that the chord longitudinal modulus increases with stress approximately as a power function for both the apical-middle and basal TM segments. The largest deviations are at low stress, when the modulus increases for apical-middle segments. We do not expect the power function to fit the measurements at asymptotically low stresses since the power function predicts that the modulus goes to zero at low stress, which is not reasonable. However, the results show directly that the TM becomes stiffer with increasing stress. To estimate the parameters of the power function we fit the data with power functions of the form
 |
(13) |
The results are summarized in Table 1.
FIGURE 12.
The chord longitudinal modulus defined by Eq. 11 was computed for all 11 apical-middle and all five basal segments. Plot symbols represent the median strain and the lengths of vertical lines show the interquartile ranges. The lines through the data are regression lines fit to the basal and apical-middle data whose parameters are given in Table 1. The basal data are shaded to help distinguish them from the apical-middle data.
Spatial dependence of the stress-strain relation of TM
Dependence on the radial direction
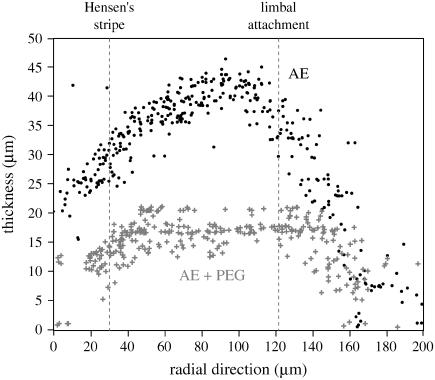
Fig. 13 shows the distribution of beads on the TM as a function of radial position along the TM both in AE and in AE with a concentration of PEG to increase the osmotic pressure by 10 kPa. Radial position was measured from the outer edge of the TM because this edge was better defined than was the inner edge. These results are plotted irrespective of longitudinal distance along the TM. In AE, the thickness of the radial profile has a broad maximum in the region near the limbal attachment of the TM; the TM is much thinner at its edges. With an increase in osmotic pressure, the TM thickness decreases at virtually all radial positions. This general pattern in the radial dependence of TM thickness and its dependence on osmotic pressure was seen in all our results. The change in thickness was largest for the largest osmotic pressures.
FIGURE 13.
Example of the effect of osmotic pressure on TM thickness in the radial direction for one TM from the apical-middle region of the TM. Each dot represents the height of one bead on the TM when the TM is bathed in AE. The shaded (+) symbols show the height of the same beads when the TM is immersed in AE plus PEG. A concentration of PEG, with a molecular mass of 511 kDa, was used to produce an osmotic pressure of 10 kPa. Radial distance was measured from the outer edge toward the modiolus. The locations of anatomical landmarks are indicated by dotted vertical lines.
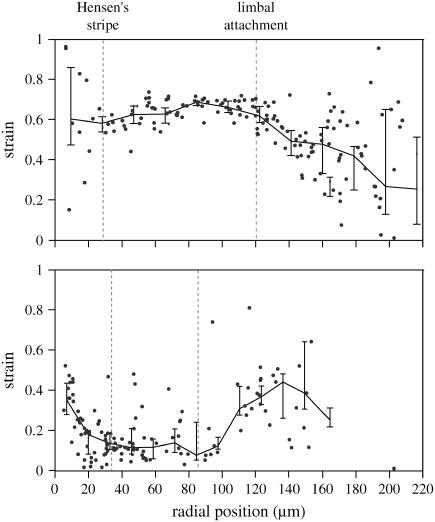
To determine whether there is a radial dependence to strain, we examined strain as a function of radial position for all the data. We selected data obtained at an osmotic pressure of 10 kPa for detailed comparison because the osmotically induced displacements were largest at this high osmotic pressure so that strain could be computed over a large radial extent. The strain computed from the measurements shown in Fig. 13 is plotted on the top panel of Fig. 14. This is an example of a TM that showed a small but systematic decrease in strain in the radial direction. In particular, in six of the seven TMs the strain was somewhat larger in the outer region of the TM between the outer edge and the limbal zone attachment than in the inner region between the limbal zone attachment and the inner edge. These two regions have been called the middle and marginal zone and the limbal zone, respectively (32). Results from one TM (bottom panel in Fig. 14) showed a different pattern of radial dependence of strain.
FIGURE 14.
Strain as a function of radial position. These are examples of strain as a function of radial position measured from the outer to the inner edge of the TM at a stress of 10 kPa for two TMs. The thin lines connect the median strains computed in 20-μm bins; the vertical line segments represent the interquartile ranges of the measurements in the bins. The top panel is from the same data as shown in Fig. 13. The bottom panel shows the radial dependence of strain for a different TM. The locations of anatomical landmarks are indicated by dotted vertical lines.
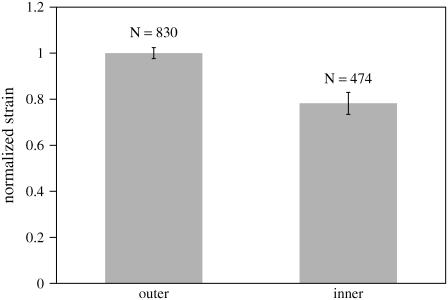
To summarize our results, we pooled the data from all seven TMs. For each TM, we combined all the data from the outer portion of the TM and computed the mean of those results. Because the strain at 10 kPa varied from one TM to another, we normalized all the strains to the mean strain in the outer region. The pooled results are shown in Fig. 15. The histogram shows that there is a small difference in strain between the outer and inner regions of the TM, which a t-test shows is a highly significant difference (p-value of 2.0 × 10⁻¹¹). The strain in the inner region is ∼20% smaller than in the outer region, suggesting that the inner region is ∼20% stiffer than the outer region.
FIGURE 15.
Strain as a function of radial position from seven TMs at an osmotic pressure of 10 kPa. For each TM segment, we computed the strain of all points located on the outer segment of the TM from the limbal attachment. We computed the mean of these values and normalized the strains to this mean value. The height of each bar equals the mean strain and the vertical line segments have lengths that equal twice the standard error of the mean. The value N is the number of data points.
Dependence on the longitudinal direction
The most direct way to examine the longitudinal dependence of strain is to compare the results from the apical-middle region with those from the basal region. Fig. 11 compares the stress-strain relation for the 11 apical-middle segments with the five basal segments of the TM. The strain is systematically larger in apical-middle segments than in basal segments. Comparison of the parameters of the fit of the power law to stress-strain functions (Table 1) show that there is only a small difference in exponent b but that the strain scale factor a is appreciably larger in apical-middle segments than in basal segments. Consistent with these results, the chord longitudinal modulus computed from the stress-strain function (Fig. 12 and Table 1) also shows that the exponent of the power function does not differ greatly between apical-middle and basal segments, but the scale factor is larger for basal segments indicating that the basal segments are stiffer than apical-middle segments. Furthermore, if both the stress-strain and modulus-stress functions are consistent power functions, the exponent d should equal 1 – b, which it does approximately. Finally, the chord longitudinal modulus at the lowest stresses were estimated with linear regression to be 0.45 kPa with an interquartile range of 0.3 kPa for apical segments and 0.88 kPa with an interquartile range of 0.64 kPa for basal segments. These values are within the range of longitudinal modulus values shown in Table 1 at the lowest strain.
Thickness of the TM
To see if the geometry of the TM might be related to the difference in stress-strain functions, we measured the thickness of each TM. The results (Table 1) show that the apical-middle segments were significantly thicker than basal segments.
DISCUSSION
Use of osmotic pressure to apply stress
The use of osmotic pressure to apply mechanical stress to the TM has some desirable features. No mechanical contact with the TM is required; stress is applied by changing the chemical composition of the bathing solution. In contrast, the use of mechanical probes to apply stress to the TM yields mechanical characteristics that depend upon the dimensions of the probe. Thus, the osmotic pressure method is suitable for measuring bulk mechanical properties of small, fragile tissue of nonuniform geometry that are easily damaged by mechanical probes. The principal disadvantage of the method is that only static, equilibrium properties of these tissues can be measured; other methods are required to measure dynamic mechanical characteristics.
Nonosmotic effects of PEG on the TM
Our intention was to use PEG to change the osmotic pressure of the bathing solution. We now consider whether or not it is likely that PEG produced other, unintended effects on the TM. Fig. 4 indicates that the effects of PEG on the appearance of the TM in light microscopy are reversible. Furthermore, we observed that the effect of PEG on the TM architecture varied with applied stress rather than with PEG molecular mass or concentration.
Since the TM is very sensitive to Ca+2 concentration (22), perhaps PEG interacts with the Ca+2 in the bath solution. If PEG were to bind Ca+2, the Ca+2 concentration in the bath would decrease, causing the TM to swell (22). However, Fig. 11 shows that increasing the PEG concentration results in shrinkage of the TM. Alternatively, PEG might release bound Ca+2 from the TM, thereby increasing the Ca+2 concentration in the bath. However, previous studies have shown that even if the concentration increased 100-fold (i.e., from 20 μM to 2 mM), the TM would only shrink 0.7 μm or ∼1.75% (22). Therefore, the primary effect of PEG could not be the binding of Ca+2. In general, the effects of changes in electrolyte concentration produce much smaller changes in TM volume than do changes in osmotic pressure. It seems most likely that the changes in the TM in response to changes in PEG concentration are due to changes in osmotic pressure.
Equivalence of osmotic and hydraulic pressure
Theories assume (33) and measurements confirm (34) that osmotic and hydraulic pressures are equivalent. This equivalence has been noted in measurements on connective tissues (15–17). Because the osmotic pressure of a PEG solution depends nonlinearly on both the concentration and molecular mass of PEG (Fig. 2), establishing this equivalence is not trivial. Using a theory for dependence of osmotic pressure on PEG concentration and molecular mass (27) allowed us to compute the osmotic pressure of our solutions. We tested the equivalence of hydraulic and osmotic pressure on PMAA gels (Fig. 3). The results showed the strain on the gel was the same for hydraulic pressures that were equivalent to osmotic pressures predicted by the theory even at relatively high stress. This was strong evidence that osmotic pressure could be used to apply a known mechanical stress to the TM.
TM filtration
Reflection coefficient
If PEG were excluded from the TM for all molecular masses of PEG, we would expect the strain produced by a fixed stress to be independent of molecular mass. The results (Fig. 7) show that this is indeed the case for MM ≥ 200 kDa, but not below that value. Thus, below 200 kDa the osmotic pressure of PEG is not fully expressed. The extent to which osmotic pressure is fully expressed or not can be quantified by the reflection coefficient, ρ, which is the ratio of the effective osmotic pressure to the osmotic pressure (35),
 |
(14) |
If we use the power function fit of the data, then we get
 |
(15) |
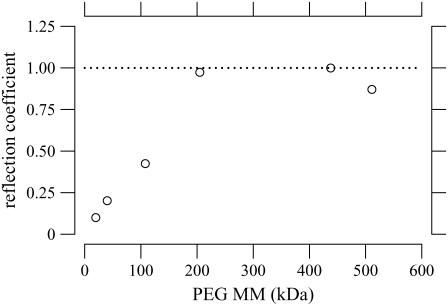
where Ez,eff is the measured strain and εz is the strain expected if the osmotic pressure were fully expressed. Thus, Fig. 7 can be recast as a plot of the reflection coefficient as a function of molecular mass (Fig. 16). The reflection coefficient approaches unity for MM ≥ 200 kDa, indicating that the osmotic pressure is fully expressed, i.e., PEG is fully reflected from the TM. Below that value, the effective osmotic pressure is lower than the osmotic pressure calculated from the PEG concentration and molecular mass, i.e., PEG permeates the TM to some extent. If PEG permeated the TM freely, the reflection coefficient would be zero.
FIGURE 16.
Reflection coefficient versus molecular mass of PEG solution. The reflection coefficient was computed from the median strain in Fig. 7 using Eq. 14 under the assumption that the maximum reflection coefficient was one.
Estimation of the maximum pore radius of the TM
One simple mechanism that accounts for an effective osmotic pressure that is less than the osmotic pressure of the solution is for PEG to enter the TM. With this interpretation, Fig. 16 indicates that PEG with MM ≥ 200 kDa is excluded from the TM, but below that value PEG permeates the TM. Thus, the results from Fig. 7 can be used to estimate the pore radius of the TM. First, we need to compute the radius of PEG for different molecular masses. The radius of gyration of PEG, which defines the thickness of the shell surrounding PEG, has been determined experimentally (36). The radius of gyration is
 |
(16) |
where W is the molecular mass of PEG, N is the Avogadro number, and ζ is the Flory-Fox parameter, which is taken as 0.8. The value η is the intrinsic viscosity of PEG solution, which is
 |
(17) |
Fig. 17 shows the radius of gyration calculated using Eqs. 16 and 17 as a function of PEG molecular mass. PEG with MM ≥ 200 kDa is excluded from the TM. The radius of gyration of PEG with a molecular mass of 200 kDa is ∼22 nm. Thus, we infer that the maximum pore radius of the TM is ∼22 nm. This is a conservative figure since the probe PEG molecules we used have a distribution of molecular masses. For example, PEG with a nominal molecular mass of 100 kDa contains a small fraction of PEG molecules with lower and higher molecular masses. Thus, the fact that the reflection coefficient is <1 at a molecular mass of 100 kDa (Fig. 16) may have resulted from a small amount of lower molecular-mass PEG in solution. Thus, the maximum pore radius is likely to be somewhat smaller than 22 nm. In any case, these results imply that ions and small solutes can freely diffuse into the TM but larger organic molecules such as proteins are excluded. The molecular architecture of the TM reveals the presence of weakly hydrated and strongly hydrated type B protofibrils, which are linked together by staggering cross-bridges occurring at 12–15 nm intervals (37). Thus, this fibrillar structure has dimensions of the right order of magnitude to form the pores that exclude high molecular-mass PEG from the TM.
Pore dimensions play an important role in the dynamic mechanical properties of cartilage (13). Since the TM is made up of similar proteins we expect the pore dimensions to be important for TM dynamics as well. For example, we would expect the diffusion coefficient of ions in the TM and the osmotic permeability to decrease as the pore radius decreases. This would lead to an increase in the time constant of diffusion and osmosis and, thereby, decrease the rate of TM response to stimuli.
Caveat on the use of osmotic pressure to measure tissue mechanical properties
PEGs are available for a large range of molecular masses. We found that PEGs of different molecular masses produced different strains of the TM even when the stress applied was the same. We have interpreted this finding to indicate that low molecular-mass PEGs can permeate the TM and hence produce a smaller effective osmotic pressure than higher molecular-mass PEGs. Hence, use of PEG to apply a known mechanical stress to a tissue requires not only that the osmotic pressure be calculated correctly, but also that the PEG not permeate the tissue appreciably.
Comparison with previous measurements on the TM obtained with mechanical probes
The point stiffness of the TM has previously been measured by calibrated hairs (38) and a glass micropipette (39). These measurement techniques estimated the transverse point stiffness to be 0.1–10 N/m and 0.125 N/m, respectively. Recently, the TM's dynamic point stiffness has also been measured using a magnetic bead (9,40). From these measurements, the point stiffness at 10 Hz was found to be 0.14, 0.40, and 0.04–0.22 N/m in the longitudinal, radial, and transverse directions, respectively.
The relationship between point stiffness and longitudinal modulus depends on the mechanical properties of the TM. If we assume the material to be semiinfinite, homogeneous, and elastic, the relation between point stiffness, S, and longitudinal modulus, M, is given by
 |
(18) |
where r is the radius of the circular contact region, and ν is Poisson's ratio (41).
To test whether our point stiffness estimates agree with previously published results, we estimated r to be 10 μm for results obtained previously (9), ν to be close to 0 for the equilibrium condition at which M was measured and M to be 0.45 kPa. For the physiologically relevant M value, the linear regression fit to the chord longitudinal modulus value measured at the lowest stress was used. However, it is important to keep in mind that this value is an upper bound on the actual physiologically relevant value. Using these numbers, the point stiffness was found to be ∼0.009 N/m, which is close to the lower end of the previously published results for transverse point stiffness. Moreover, in vitro we estimate r to be the radius of a hair bundle, which is ∼5 μm and take ν to be close to 0, and the point stiffness is estimated to be ∼0.014 N/m, which is approximately an order-of-magnitude stiffer than hair bundles (0.001–0.006 N/m) (42). However, this conclusion needs to be checked with measurements of the dynamic longitudinal modulus of the TM at physiological stress levels.
Comparison to equilibrium longitudinal modulus of other connective tissues
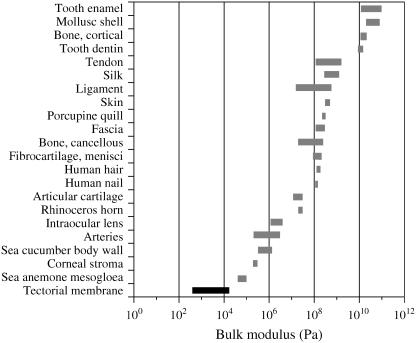
The longitudinal modulus of the TM is compared to those of other connective tissues in Fig. 18. As in the previous section, for the longitudinal modulus of the TM, the linear regression-fit to the chord longitudinal modulus value measured at the lowest stress was used. The longitudinal modulus of a number of connective tissues spans a range of 102–1010 Pa. The comparisons of longitudinal moduli among connective tissues must be viewed with caution. The stress-strain relations of most connective tissues are nonlinear, making estimation of a single value for the modulus somewhat arbitrary. Sources of variability for these measurements also result from differences in type of tissue specimens, species, methods, etc. Estimates are based on measurements of tension as well as compression. Nevertheless, the range of values for different connective tissues spans eight orders of magnitude, so while one might argue about the exact rank order of tissues by their longitudinal moduli, the difference between the stiffest tissues and the least stiff tissues is not in doubt. The modulus of the TM is the smallest of those shown and is approximately seven orders-of-magnitude lower than for mollusk shell, tooth enamel, cortical bone, and tooth dentin. It is also four orders-of-magnitude smaller than articular cartilage, even though the solid compositions of the TM and articular cartilage are very similar. However, the TM (97% water) is more hydrated than is articular cartilage (65% water). The longitudinal modulus of the TM is more compliant than either the sea anemone mesoglia and intraocular lens, two of the most flexile tissues tested.
FIGURE 18.
Comparison of longitudinal moduli of several connective tissues (13,46–65).
Implications for a gel model of the TM
Previous measurements of the TM have been interpreted in terms of a model of the TM as a polyelectrolyte gel (10,11,43). In this model, the mechanical constitutive relation of the TM, which relates its change in volume to stress, obeys Hooke's law. That is, the microscopic longitudinal modulus of the model is constant. The amount of fixed charge in the model is also constant. Thus, it was of interest to see whether or not this model could fit the nonlinear stress-strain relation measured with PEG-induced osmotic pressure changes.
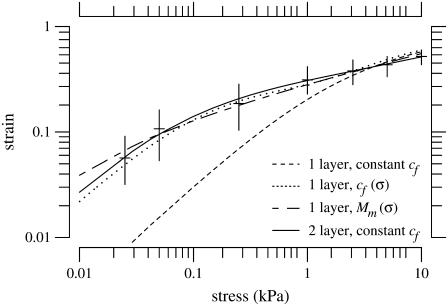
With constant microscopic longitudinal modulus and fixed charge concentration, the gel model does produce a nonlinear stress-strain relation. However, we have not been able to fit the measurements with this model (Fig. 19). When we chose either the microscopic longitudinal modulus or the fixed charge concentration to be functions of stress, it was possible to obtain adequate fits of our measurements (Fig. 19). Another way of fitting the measurements is to assume that the TM is not homogeneous but instead consists of two different gels with different material properties; this model also fit the data as shown in Fig. 19. These results show that the measurements can be fit either by a one-layer gel model with nonlinear constitutive relations or by a two-layer gel model with linear constitutive relations. Our data are not sufficient to allow us to distinguish among these alternatives.
FIGURE 19.
Least-squares fit of data for: one-layer gel model with constant fixed-charge concentration (cf) (dashed line); one-layer gel model with a cf that depends on stress (dotted line); one-layer gel model with microscopic longitudinal modulus (Mm) that depends on stress (short-long dashed line); and two-layer gel model with constant cf (solid line). All of these models except for the one-layer model with varying Mm have a Mm of 0 kPa. The best fit to the one-layer gel model had a cf of −30 mmol/L. The one-layer gel with variable cf, had a cf that varied from −11.75 mmol/L at low stress levels to –27.75 mmol/L at high stress levels according to the function, cf = 28 – 17e−1.2σ. The one-layer gel with varying Mm had a Mm that depended on stress as Mm = 3.39eσ. In this fit, cf was –27.5 mmol/L. For the fit to the two-layer gel model, layer 1 is 40% of total volume of the gel and has cf of –6 mmol/L; layer 2 is 60% of the gel and has cf of −78 mmol/L.
Even though the molecular origin of the nonlinearity of the longitudinal modulus is unclear, the longitudinal modulus in conjunction with the pore radius provides a quantitative basis for developing a poroelastic model of the TM. The poroelastic model might describe the measured frequency dependence of TM properties such as shear impedance, which has been shown to be inconsistent with simple viscoelastic models (40).
Spatial dependence of TM properties
The TM properties vary in both the radial and longitudinal directions. In the radial direction, Fig. 14 shows that the strain is 20% smaller in the inner region than in the outer region for the same stress. These results are qualitatively similar to the shear modulus measurements made with atomic force microscope (14), which also found that the TM is more rigid toward the inner zones. Both of these results imply that the hair bundles contact a more compliant region of the TM. Perhaps this pattern allows the compliance of the hair bundles to more closely match that of the TM.
However, unlike the atomic force microscope measurements, which found no trend in longitudinal elasticity (14), Fig. 11 shows that the basal region of the TM has a larger equilibrium longitudinal modulus than the apical region. In addition, results obtained by others (44,45) as well as by us (Table 1) show that the TM thickness decreases from apex to base. The fact that TM dimensions and material properties vary from apex to base suggests that the TM may have a role in tonotopic organization of cochlear macromechanics as well as micromechanics.
Acknowledgments
We thank the people in the Micromechanics Group at MIT for their insightful feedback and criticism with special thanks to A. J. Aranyosi.
This work was supported by the National Institutes of Health grant No. R01-DC00238 and the NIH training grant to the Harvard-MIT Speech and Hearing Sciences Program. K.M. was also supported by University of Iowa “Autosomal Dominant Non-Syndromic Hearing” contract No. G/P 21155600.
References
- 1.McGuirt, W. T., S. D. Prasad, A. J. Griffith, H. Kunst, G. E. Green, K. B. Shpargel, C. Runge, C. Huybrechts, R. F. Mueller, E. Lynch, M. C. King, H. G. Brunner, C. Cremers, M. Takanosu, S. W. Li, M. Arita, R. Mayne, D. J. Prockop, G. Van Camp, and R. Smith. 1999. Mutations in COL11A2 cause non-syndromic hearing loss (DFNA13). Nat. Genet. 23:413–419. [DOI] [PubMed] [Google Scholar]
- 2.Legan, P. K., V. A. Lukashkina, R. J. Goodyear, M. Kossl, I. J. Russell, and G. P. Richardson. 2000. A targeted deletion of α-tectorin reveals that the tectorial membrane is required for the gain and timing of cochlear feedback. Neuron. 28:273–285. [DOI] [PubMed] [Google Scholar]
- 3.Legan, P. K., V. A. Lukashkina, R. J. Goodyear, A. N. Lukashkin, K. Verhoeven, G. V. Camp, I. J. Russell, and G. P. Richardson. 2005. A deafness mutation isolates a second role for the tectorial membrane in hearing. Nat. Neurosci. 8:1035–1042. [DOI] [PubMed] [Google Scholar]
- 4.Simmler, M. C., M. Cohen-Salmon, A. El-Amraoui, L. Guillaud, J. C. Benichou, C. Petit, and J. J. Panthier. 2000. Targeted disruption of otog results in deafness and severe imbalance. Nat. Genet. 24:139–143. [DOI] [PubMed] [Google Scholar]
- 5.Davis, H. 1958. A mechano-electrical theory of cochlear action. Ann. Otol. Rhinol. Laryngol. 67:789–801. [DOI] [PubMed] [Google Scholar]
- 6.Mammano, F., and R. Nobili. 1993. Biophysics of the cochlea: linear approximation. J. Acoust. Soc. Am. 93:3320–3332. [DOI] [PubMed] [Google Scholar]
- 7.Allen, J. B. 1980. Cochlear micromechanics—a physical model of transduction. J. Acoust. Soc. Am. 68:1660–1670. [DOI] [PubMed] [Google Scholar]
- 8.Neely, S. T., and D. O. Kim. 1983. An active cochlear model showing sharp tuning and high sensitivity. Hear. Res. 9:123–130. [DOI] [PubMed] [Google Scholar]
- 9.Freeman, D. M., C. C. Abnet, W. Hemmert, B. S. Tsai, and T. F. Weiss. 2003. Dynamic material properties of the tectorial membrane: a summary. Hear. Res. 180:1–10. [DOI] [PubMed] [Google Scholar]
- 10.Weiss, T. F., and D. M. Freeman. 1997. Equilibrium behavior of an isotropic polyelectrolyte gel model of the tectorial membrane: the role of fixed charge. Aud. Neurosci. 3:351–361. [DOI] [PubMed] [Google Scholar]
- 11.Freeman, D. M., K. Masaki, A. R. McAllister, J. L. Wei, and T. F. Weiss. 2003. Static material properties of the tectorial membrane: a summary. Hear. Res. 180:11–27. [DOI] [PubMed] [Google Scholar]
- 12.McCutchen, C. W. 1982. Cartilages is poroelastic, not viscoelastic (including an exact theorem about strain energy and viscous loss, and an order of magnitude relation for equilibrium time). J. Biomech. 15:325–327. [DOI] [PubMed] [Google Scholar]
- 13.Grodzinksy, A. J. 1983. Electromechanical and physicochemical properties of connective tissues. CRC Crit. Rev. Biomed. Eng. 9:133–199. [PubMed] [Google Scholar]
- 14.Shoelson, B., E. K. Dimitriadis, H. Cai, B. Kachar, and R. S. Chadwick. 2004. Evidence and implications of inhomogeneity in tectorial membrane elasticity. Biophys. J. 87:2768–2777. [DOI] [PMC free article] [PubMed] [Google Scholar]
- 15.Maroudas, A., and C. Bannon. 1981. Measurement of swelling pressure in cartilage and comparison with the osmotic pressure of constituent proteoglycans. Biorheology. 18:619–632. [DOI] [PubMed] [Google Scholar]
- 16.Schneiderman, R., D. Keret, and A. Maroudas. 1986. Effect of mechanical and osmotic pressure on the rate of glycosaminoglycan synthesis in the human adult femoral head cartilage: an in vitro study. J. Orthop. Res. 4:393–408. [DOI] [PubMed] [Google Scholar]
- 17.Basser, P. J., R. Schneiderman, R. A. Bank, E. Wachtel, and A. Maroudas. 1998. Mechanical properties of the collagen network in human articular cartilage as measured by osmotic stress technique. Arch. Biochem. Biophys. 351:207–219. [DOI] [PubMed] [Google Scholar]
- 18.Masaki, K., A. D. Copeland, E. M. Johnson, R. J. Smith, and D. M. Freeman. 2002. Measuring the equilibrium stress/strain relationship of the isolated tectorial membrane. In Abstracts of the Twenty-Fifth Annual Midwinter Research Meeting, St. Petersburg Beach, Florida. Association for Research in Otolaryngology, Mt. Royal, NJ.
- 19.Richter, C.-P., and P. Dallos. 2003. Tectorial membrane bulk stiffness measurements in the gerbil hemicochlea. In Abstracts of the Twenty-Sixth Annual Midwinter Research Meeting, Daytona Beach, Florida. Association for Research in Otolaryngology, Mt. Royal, NJ.
- 20.Freeman, D. M., D. A. Cotanche, F. Ehsani, and T. F. Weiss. 1994. Osmotic responses of the isolated tectorial membrane of the chick to iso-osmotic solutions: effect of Na+, K+, and Ca+2 concentration. Hear. Res. 79:197–215. [DOI] [PubMed] [Google Scholar]
- 21.Freeman, D. M., S. M. Hattangadi, and T. F. Weiss. 1997. Osmotic responses of the isolated mouse tectorial membrane to changes in pH. Aud. Neurosci. 3:363–375. [Google Scholar]
- 22.Shah, D. M., D. M. Freeman, and T. F. Weiss. 1995. Osmotic response of the isolated, unfixed mouse tectorial membrane to isosmotic solutions: effect of Na+, K+, and Ca+2 concentration. Hear. Res. 87:187–207. [DOI] [PubMed] [Google Scholar]
- 23.Bosher, S. K., and R. L. Warren. 1978. Very low calcium content of cochlear endolymph, an extracellular fluid. Nature. 273:377–378. [DOI] [PubMed] [Google Scholar]
- 24.Sterkers, O., E. Ferrary, and C. Amiel. 1984. Inter- and intracompartmental osmotic gradients within the rat cochlea. Am. J. Physiol. 247:F602–F606. [DOI] [PubMed] [Google Scholar]
- 25.Sterkers, O., E. Ferrary, and C. Amiel. 1988. Production of inner ear fluids. Physiol. Rev. 68:1083–1128. [DOI] [PubMed] [Google Scholar]
- 26.Ikeda, K., J. Kusakari, T. Takasaka, and Y. Saito. 1987. The Ca+2 activity of cochlear endolymph of the guinea pig and the effect of inhibitors. Hear. Res. 26:117–125. [DOI] [PubMed] [Google Scholar]
- 27.Hasse, H., H. P. Kany, R. Tintinger, and G. Maurer. 1995. Osmotic virial coefficients of aqueous poly(ethylene glycol) from laser-light scattering and isopiestic measurements. Macromolecules. 28:3540–3552. [Google Scholar]
- 28.Parsegian, V. A., R. P. Rand, N. L. Fuller, and D. C. Rau. 1988. Osmotic stress for the direct measurement of intermolecular forces. Methods Enzymol. 127:400–416. [DOI] [PubMed] [Google Scholar]
- 29.Schiller, L. R., M. Emmett, C. A. Santa Ana, and J. S. Fordtran. 1988. Osmotic effects of polyethylene glycol. Gastroenterology. 94:933–941. [DOI] [PubMed] [Google Scholar]
- 30.Quinn, T. M., and A. J. Grodzinsky. 1993. Longitudinal modulus and hydraulic permeability of poly(methacrylic acid) gels: effects of charge density and solvent content. Macromolecules. 26:4332–4338. [Google Scholar]
- 31.Ngola, S. M., Y. Fintschendor, W. Y. Choi, and T. J. Shepodd. 2001. Conduct-as-cast polymer monoliths as separation media for capillary electrochromatography. Anal. Chem. 73:849–856. [DOI] [PubMed] [Google Scholar]
- 32.Lim, D. J. 1972. Fine morphology of the tectorial membrane: its relationship to the organ of Corti. Arch. Otolaryngol. 96:199–215. [DOI] [PubMed] [Google Scholar]
- 33.Van' t Hoff, J. H. 1886. Une propriété général de la matiére diluée. A general property of dilute matter. Svenska Vet. Akad. Handl. 21:42–49. [Google Scholar]
- 34.Mauro, A. 1957. Nature of solvent transfer in osmosis. Science. 126:252–253. [DOI] [PubMed] [Google Scholar]
- 35.Weiss, T. F. 1996. Cellular Biophysics: Volume 1, Transport. MIT Press, Cambridge, MA.
- 36.Bhat, R., and S. N. Timasheff. 1992. Steric exclusion is the principal source of the preferential hydration of proteins in the presence of polyethylene glycols. Protein Sci. 1:1133–1143. [DOI] [PMC free article] [PubMed] [Google Scholar]
- 37.Hasako, J., and G. Richardson. 1988. The ultrastructure organization and properties of the mouse tectorial membrane matrix. Hear. Res. 35:21–38. [DOI] [PubMed] [Google Scholar]
- 38.von Bekesy, G. 1960. Experiments in Hearing, 1st Ed. McGraw-Hill, Englewood Cliffs, NJ.
- 39.Zwislocki, J. J., and L. K. Cefaratti. 1989. Tectorial membrane II: stiffness measurements in vivo. Hear. Res. 42:211–228. [DOI] [PubMed] [Google Scholar]
- 40.Abnet, C. C., and D. M. Freeman. 2000. Deformations of the isolated mouse tectorial membrane produced by oscillatory forces. Hear. Res. 144:29–46. [DOI] [PubMed] [Google Scholar]
- 41.Timoshenko, S. P., and J. N. Goodier. 1970. Theory of Elasticity, 1st Ed. McGraw-Hill, Englewood Cliffs, NJ.
- 42.Langer, M. G., S. Fink, A. Koitschev, U. Rexhausen, J. K. Horber, and J. P. Rupperberg. 2001. Lateral mechanical coupling of stereocilia in cochlear hair bundles. Biophys. J. 80:2608–2621. [DOI] [PMC free article] [PubMed] [Google Scholar]
- 43.Weiss, T. F., and D. M. Freeman. 1997. Equilibrium behavior of an isotropic polyelectrolyte gel model of the tectorial membrane: effect of pH. Hear. Res. 111:55–64. [DOI] [PubMed] [Google Scholar]
- 44.Edge, R. M., B. N. Evans, M. Pearce, C. P. Richter, X. Hu, and P. Dallos. 1998. Morphology of the unfixed cochlea. Hear. Res. 124:1–16. [DOI] [PubMed] [Google Scholar]
- 45.Keiler, S., and C. P. Richter. 2001. Cochlear dimensions obtained in hemicochleae of four different strains of mice: CBA/CaJ, 129/CD1, 129/SvEv, and C57BL/6J. Hear. Res. 162:91–104. [DOI] [PubMed] [Google Scholar]
- 46.Koehl, M. A. R. 1977. Mechanical diversity of connective tissue of the body wall of sea anemones. J. Exp. Biol. 69:107–125. [Google Scholar]
- 47.Denny, M. W., and J. M. Gosline. 1980. The physical properties of the pedal mucus of the terrestrial slug, Ariolimax columbianus. J. Exp. Biol. 88:375–393. [Google Scholar]
- 48.Parry, D. A. D., and A. S. Craig. 1988. Collagen fibrils during development and maturation and their contribution to the mechanical attributes of connective tissue. In Collagen, Volume II, Biochemistry and Biomechanics. M. E. Nimni, editor. CRC Press, Boca Raton, FL.
- 49.Thalmann, I., K. Machiki, A. Calabro, V. C. Hascall, and R. Thalmann. 1993. Uronic acid-containing glycosaminoglycans and keratan sulfate are present in the tectorial membrane of the inner ear: functional implications. Arch. Biochem. Biophys. 307:391–396. [DOI] [PubMed] [Google Scholar]
- 50.Katz, J. L. 1995. Mechanics of hard tissue. In The Biomedical Engineering Handbook. J. D. Bronzino, editor. CRC Press, Boca Raton, FL.
- 51.Chirila, T. V. 1998. The intraocular lens. In Handbook of Biomaterial Properties. J. Black and G. Hastings, editors. Chapman & Hall, London.
- 52.Chirila, T. V., and Y. Hong. 1998. The vitreous humor. In Handbook of Biomaterial Properties. J. Black and G. Hastings, editors. Chapman and Hall, London.
- 53.Currey, J. 1998. Cortical bone. In Handbook of Biomaterial Properties. J. Black and G. Hastings, editors. Chapman & Hall, London.
- 54.Deng, X., and R. Guidoin. 1998. Arteries, veins, and lymphatic vessels. In Handbook of Biomaterial Properties. J. Black and G. Hastings, editors. Chapman & Hall, London.
- 55.Gharpuray, V. M. 1998. Fibrocartilage. In Handbook of Biomaterial Properties. J. Black and G. Hastings, editors. Chapman & Hall, London.
- 56.Healy, K. E. 1998. Dentin and enamel. In Handbook of Biomaterial Properties. J. Black and G. Hastings, editors. Chapman & Hall, London.
- 57.Keaveny, T. M. 1998. Cancellous bone. In Handbook of Biomaterial Properties. J. Black and G. Hastings, editors. Chapman & Hall, London.
- 58.Parsons, J. R. 1998. Cartilage. In Handbook of Biomaterial Properties. J. Black and G. Hastings, editors. Chapman & Hall, London.
- 59.Woo, S. L.-Y., and R. E. Levine. 1998. Ligaments, tendon and fascia. In Handbook of Biomaterial Properties. J. Black and G. Hastings, editors. Chapman & Hall, London.
- 60.Mak, A. F. T., and M. Zhang. 1998. Skin and muscle. In Handbook of Biomaterial Properties. J. Black and G. Hastings, editors. Chapman & Hall, London.
- 61.Gosline, J. M. 1971. Connective tissue mechanics of Metridium senile. J. Exp. Biol. 55:775–795. [Google Scholar]
- 62.Özkaya, N., and M. Nordin. 1999. Fundamentals of Biomechanics: Equilibrium, Motion, and Deformation. Springer-Verlag, New York, NY.
- 63.Currey, J. D. 1980. Mechanical properties of mollusc shell. In The Mechanical Properties of Biological Materials, number XXXIV in Symposia of the Society for Experimental Biology. Cambridge University Press, Cambridge, UK. [PubMed]
- 64.Motokawa, T. 1984. Viscoelasticity of Holothurian body wall. J. Exp. Biol. 109:63–75. [Google Scholar]
- 65.Hoeltzel, D. A., P. Altman, K. Buzard, and K. Choe. 1992. Strip extensiometry for comparison of the mechanical response of bovine. J. Biomech. Eng. 114:202–215. [DOI] [PubMed] [Google Scholar]


