

Abstract
Genetically encoded glucose nanosensors have been used to measure steady state glucose levels in mammalian cytosol, nuclei, and endoplasmic reticulum. Unfortunately, the same nanosensors in Arabidopsis thaliana transformants manifested transgene silencing and undetectable fluorescence resonance energy transfer changes. Expressing nanosensors in sgs3 and rdr6 transgene silencing mutants eliminated silencing and resulted in high fluorescence levels. To measure glucose changes over a wide range (nanomolar to millimolar), nanosensors with higher signal-to-noise ratios were expressed in these mutants. Perfusion of leaf epidermis with glucose led to concentration-dependent ratio changes for nanosensors with in vitro Kd values of 600 μM (FLIPglu-600μΔ13) and 3.2 mM (FLIPglu-3.2mΔ13), but one with 170 nM Kd (FLIPglu-170nΔ13) showed no response. In intact roots, FLIPglu-3.2mΔ13 gave no response, whereas FLIPglu-600μΔ13, FLIPglu-2μΔ13, and FLIPglu-170nΔ13 all responded to glucose. These results demonstrate that cytosolic steady state glucose levels depend on external supply in both leaves and roots, but under the conditions tested they are lower in root versus epidermal and guard cells. Without photosynthesis and external supply, cytosolic glucose can decrease to <90 nM in root cells. Thus, observed gradients are steeper than expected, and steady state levels do not appear subject to tight homeostatic control. Nanosensor-expressing plants can be used to assess glucose flux differences between cells, invertase-mediated sucrose hydrolysis in vivo, delivery of assimilates to roots, and glucose flux in mutants affected in sugar transport, metabolism, and signaling.
INTRODUCTION
Plants use sucrose as the predominant sugar for long-distance transport, compared with mammals, which use glucose for circulation in the vascular system (Lalonde et al., 2004). In contrast with phosphorylated forms of glucose, free glucose is not a direct product of photosynthesis; rather, it occurs as an intermediate of invertase-driven sucrose degradation (Sherson et al., 2003), as a product of d-enzyme in starch metabolism (Lloyd et al., 2005), as well as in a variety of other reactions. The highest concentrations of free glucose have been found in the vacuole, whereas cytosolic levels in tobacco (Nicotiana tabacum) leaves and potato (Solanum tuberosum) tubers have been estimated at <2 and 5 mM by nonaqueous fractionation (Heineke et al., 1994; Farré et al., 2001). Glucose transporters have been identified at the vacuole (Guy et al., 1979; Endler et al., 2006) as well as the inner envelope of plastids (Weber et al., 2000; Servaites and Geiger, 2002), suggesting that steady state glucose levels are governed not only by flux across the plasma membrane and metabolism but additionally by compartmentation. Steady state levels in the true cytosol (without contributions of organelles) will be affected directly by bidirectional flux across the plasma membrane, biosynthetic and metabolic fluxes, and compartmentation. As in bacteria, yeast, and metazoa, free glucose is rapidly phosphorylated by hexokinases, and phosphorylated glucose can be used as a precursor for many metabolic pathways, for transient storage as starch, and for cellulose biosynthesis (Rolland et al., 2006). Thus, it is necessary to quantify fluxes and steady state levels within the compartments.
Transcriptional, posttranscriptional, and allosteric regulation occur at many of the contributing transport or enzymatic steps. Regulation is, at least in part, evolutionarily conserved in all kingdoms (e.g., allosteric control of the relative activity of gluconeogenesis versus glycolysis by fructose 2,6-bisphosphate) (Okar and Lange, 1999). Photosynthetically active light and temperature changes affect sugar flux but may or may not affect steady state levels in the cytosol. In addition, sugars may indirectly affect flux via sugar signaling pathways. Such sugar signaling pathways have been characterized extensively in yeast (Santangelo, 2006). A large body of evidence supports the notion that sugars act as signals affecting sugar metabolism and other physiological processes in plants as well (Rolland et al., 2006). Most of these studies have focused on transcriptional control; thus, it would be highly advantageous to monitor changes in steady state glucose levels with cellular, subcellular, and temporal resolution to obtain a better understanding of how signaling networks control the sugar levels.
In plants and animals, these analyses are further complicated by multicellularity. Different cells may behave differently; for example, the flux in sugar-producing mesophyll cells is expected to be different from that in epidermal and guard cells. No currently available technology addresses these issues in a satisfactory manner. Nonaqueous fractionation provided important data on subcellular metabolite levels but is static and invasive, has no cellular resolution, and is sensitive to artifacts, especially those attributable to the large contribution of vacuoles (Heineke et al., 1994). Although spectroscopic methods such as NMR imaging and positron emission tomography provide dynamic data, their spatial resolution is limited (Barros et al., 2005). Although it is conceivable that cytosolic glucose levels are kept constant by homeostatic control (as is the case for mammalian blood sugar levels) (Nordlie et al., 1999), steady state levels and their dynamics have not been measured directly. We thus have little information on the actual flux rates and the regulation of the factors affecting flux.
Genetically encoded molecular nanosensors that transduce the interaction of a target molecule (e.g., glucose) with a recognition element into a macroscopic observable signal via allosteric regulation of one or more signaling elements may provide a tool capable of solving many of the issues mentioned above (Lalonde et al., 2005). Typically, a recognition element that specifically binds a ligand (here glucose) is translationally coupled to a reporter element. The most common reporter element is a sterically separated donor-acceptor fluorescence resonance energy transfer (FRET) pair of fluorescent proteins (typically, spectral variants of green fluorescent protein [GFP]) (Romoser et al., 1997; Fehr et al., 2002). Some molecular nanosensors additionally use a conformational actuator (most commonly a peptide that binds to one conformational state of the recognition element) to magnify the allosteric effect and thus the resulting output of the reporter element (Miyawaki et al., 1997).
We recently demonstrated the applicability of this method in the absence of a conformational actuator and its generalizability to a variety of analytes (Deuschle et al., 2005a). Members of the bacterial periplasmic binding protein superfamily (PBPs) recognize hundreds of substrates with high affinity (attomolar to low micromolar) and specificity (Tam and Saier, 1993). PBPs have been shown by a variety of experimental techniques to undergo a significant conformational change upon ligand binding; fusion of an individual sugar, amino acid, or phosphate binding PBP with a pair of GFP variants produced nanosensors for maltose, ribose, glucose, Glu, and phosphate (Fehr et al., 2002, 2003; Lager et al., 2003; Okumoto et al., 2005; H. Gu, S. Lalonde, S. Okumoto, L.L. Looger, A.M. Scharff-Poulsen, A.R. Grossman, J. Kossmann, I. Jakobsen, and W.B. Frommer, unpublished data). These nanosensors have been used to measure sugar uptake and homeostasis in human cell lines, to analyze subcellular analyte levels with nucleus- or endoplasmic reticulum–targeted versions, and to detect Glu release from hippocampal neurons in response to electrical stimulation (Fehr et al., 2004, 2005b; Okumoto et al., 2005). The experiments demonstrated that the rate of glucose transport across the endoplasmic reticulum membrane of human hepatoma cells is higher compared with plasma membrane transport rates. Moreover, these data provide proof of the concept that these nanosensors can be used as tools to study sugar signaling and regulatory networks in a wide variety of systems.
Despite the apparent simplicity of introducing these nanosensors into Arabidopsis thaliana, initial attempts to express the FRET nanosensor in plants have failed (data not shown). Although we could detect fluorescence in transient expression systems (data not shown), no stable plants providing levels of fluorescence high enough for robust measurements were obtained. To solve both the low fluorescence levels and the lack of signal, we introduced a set of recently developed affinity mutants of an improved nanosensor with expanded dynamic range (Deuschle et al., 2005b) into Arabidopsis mutants deficient in transgene silencing (Mourrain et al., 2000; Peragine et al., 2004). The combination of the improved nanosensors in the mutant background solved both problems and enabled the analysis of steady state glucose levels in the cytosol of epidermal leaf cells as well as in intact roots. The results show that under the conditions tested, root glucose levels in the absence of external supply are significantly lower compared with those in leaf epidermis. The glucose gradients across the plasma membrane in both cell types are much steeper than expected, and no evidence for tight homeostatic control was identifiable.
RESULTS
Expression of FLIP Nanosensors in Wild-Type Arabidopsis
FLIP nanosensors have successfully been applied for in vivo analyte detection in yeast and mammalian cells (Fehr et al., 2002, 2003, 2005b; Lager et al., 2003; Okumoto et al., 2005). To determine metabolite levels in the cytosol of stably transformed Arabidopsis plants, the nanosensors FLIPglu-170n, FLIPglu-600μ, FLIPglu-control, FLII81PE-1μ, FLII81PE-1m, FLIPmal-25μ, and FLIPmal-control (Fehr et al., 2002, 2003; Deuschle et al., 2005b; Okumoto et al., 2005) were cloned into binary vectors including pE1774, which drives expression via the superpromoter (Ni et al., 1995), pCB302 (Xiang et al., 1999), pCAMBIA3300, and pPZP312 (Hajdukiewicz et al., 1994), containing the cauliflower mosaic virus (CaMV) 35S promoter (data not shown). Ten different constructs were introduced into Arabidopsis plants, and >1000 herbicide-resistant primary transformants were analyzed for fluorescence (see Supplemental Table 1 online; data not shown). However, for all constructs, only a few lines showed enhanced cyan fluorescent protein (eCFP) or enhanced yellow fluorescent protein (eYFP) fluorescence in leaves, and fluorescence levels were low. All of the tested offspring showed a non-Mendelian segregation regarding fluorescence, again with only a few weakly expressing plants (similar observation as for Columbia [Col-0] transformants with improved nanosensors; see below) (Figure 1). Moreover, possibly because of low signal-to-noise levels, no analyte-induced ratio changes were detectable (data not shown). Thus, three potential problems were encountered: gene silencing, inadequate nanosensor range, and/or a too-low signal change. All three potential issues were addressed (1) by using nanosensors with improved sensitivity, (2) by developing a set of affinity mutants covering a broad detection range, and (3) by addressing the putative gene silencing.
Figure 1.

Expression of Nanosensors in Arabidopsis Wild Type and Silencing Mutants.
(A) Number of mature, soil-grown transformants showing significant eYFP fluorescence as determined using an epifluorescence stereomicroscope.
(B) Representative fluorescence images of leaves from the different transformants.
(C) and (D) Fluorescence (C) and bright-field (D) images of T1 seedlings of highly expressing transformants at the seedling stage.
Construction of a Series of Optimized Glucose Nanosensors for in Vivo Imaging
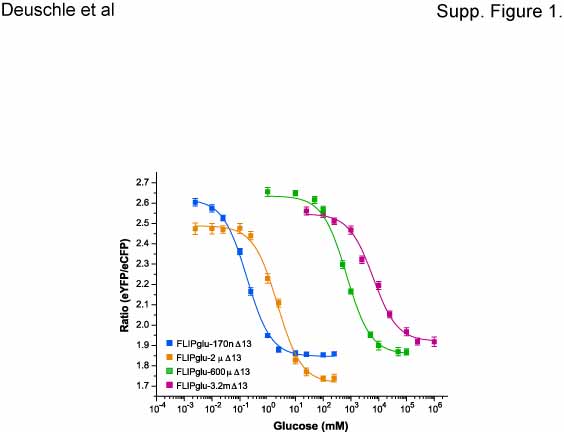
Given the large relative volume of the vacuole compared with the cytosol in most plant cells, it is unclear how reliable subcellular fractionation methods are for determining cytosolic glucose levels. Therefore, nanosensors covering a wide range of affinities are needed for in vivo measurements. Nanosensors differing in their Kd values can serve as internal controls (i.e., ultra-high or ultra-low affinity mutants are not expected to respond because they are either always saturated or cytosolic levels never reach the necessary concentrations). The steady state glucose levels depend on the kinetics of uptake, the existence of release pathways, endocytic and exocytic pathways, metabolic conversion, and rates of compartmentation, probably dominated in plant cells by the large tonoplast. Using a combination of empirical methods and rational design, a set of FRET nanosensors for glucose with improved sensitivity had been developed (Deuschle et al., 2005b). The starting point was a fusion consisting of eCFP, fused translationally to an affinity mutant of the glucose binding protein mglB, and eYFP (Figure 2A). In this construct, the composite linkers between the fusion proteins had been deleted. This nanosensor was named FLIPglu-600μΔ13 (for Fluorescent Indicator Protein for glucose with an affinity of 600 μM, deletion construct Δ13) (Deuschle et al., 2005b). Site-directed mutagenesis was used to generate a set of affinity mutants using the structure-guided approach previously developed to create the original nanosensor affinity mutants (FLIPglu-170nΔ13, FLIPglu-2μΔ13, and FLIPglu-600μΔ13, named according to their affinity for glucose: 170 nM, 2 μM, and 600 μM, respectively) (Figure 2; see Supplemental Table 1 online) (Fehr et al., 2003). Moreover, to cover the millimolar range better, a set of new mutants was generated. A nanosensor FLIPglu-3.2mΔ13, carrying two mutations, F16A and S112A, had a Kd of 3.2 mM for glucose (Figure 2C). The starting ratio (eYFP/eCFP) for all nanosensors was ∼2.6; FLIPglu-170nΔ13, -2μΔ13, and -600μΔ13 showed a Δ ratio of ∼0.8; FLIPglu-3.2mΔ13 showed a slightly lower maximal ratio change (0.6) (see Supplemental Table 1 and Figure 1 online). Titrations performed in 20 mM MES/Tris buffer at pH 7.0 or 7.5 showed no significant changes in the binding constant and the maximal ratio change (see Supplemental Figure 2 online). Thus, even if the cytosolic pH would change as a consequence of uptake or metabolism, one would not expect an effect on the nanosensor readout.
Figure 2.

Construct Maps and in Vitro Saturation Curves for FLIPglu-Δ13.
(A) FLIPglu-Δ13 cassette containing linearly fused eCFP-mglB-eYFP genes. The size of each gene, restriction sites, and transcription start and stop are indicated.
(B) pPZP 312 binary vector T-DNA containing a FRET glucose nanosensor. L, left border; MglB, E. coli periplasmic glucose binding protein; PMAS, MAS promoter; P35S, CaMV 35S promoter; R, right border; TRbcs, Rbcs terminator; T35S, CAMV 35S terminator. Arrows indicate the direction of transcription. The restriction enzymes used for cloning are indicated.
(C) Glucose binding isotherms of FLIPglu-170nΔ13, FLIPglu-2μΔ13, FLIPglu-600μΔ13, and the new low-affinity nanosensor FLIPglu-3.2mΔ13. Fractional saturation of the four nanosensors versus glucose concentrations is given for proteins purified from Escherichia coli. Binding was measured by dividing fluorescence intensity at the eYFP emission peak (528 nm) by that of the eCFP emission peak (485 nm) and fitting to a single-site binding isotherm, (r − rapo)/(rsat − rapo).
Expression of Optimized FLIP Nanosensors in Transgene Silencing Mutants
The low penetrance of functional nanosensor expression as measured by fluorescence, together with the observation that the few weakly fluorescent wild-type plants lost fluorescence during further development, suggested transgene silencing. The improved nanosensors were expressed under control of the CaMV 35S promoter in pPZP312, in which the phosphinotricin resistance gene is driven by the MAS promoter to reduce interference by a second copy of the CaMV 35S promoter (Figures 2A and 2B). Transgene-induced silencing requires a pathway including the RNA-dependent polymerase RDR6 and the coiled-coil protein SGS3 (Vaucheret, 2005). To test the hypothesis that transgene-induced silencing suppresses FLIP expression, the constructs were introduced into the mutant backgrounds. Both sgs3 and rdr6 transformants yielded a large proportion of fluorescent plants (Figure 1A); moreover, the fluorescence intensity was much higher in the majority of these lines compared with that in the Col-0 transformants (Figures 1B and 1C). Confocal microscopy was used to determine the localization of the nanosensors. Fluorescence was detected mainly in the cytosol, but in contrast with animal cells (Fehr et al., 2003, 2004, 2005b), some signal was also found in the nuclei (Figure 3). All further experiments were performed with the rdr6 transformants.
Figure 3.

Confocal Images of Cytosolic Expression of FLIPglu-600μΔ13.
Cytosolic and nuclear localization of FLIPglu-600μΔ13 in the leaf epidermis were determined by spinning disc confocal microscopy.
(A) Optical section through a pavement cell. Note cytoplasmic strands.
(B) Same cell as in (A), with optical section at bottom of cell showing the nucleus. Note the fluorescent ring around the nucleus.
(C) A different leaf area showing cytosolic fluorescence in guard cells. Quantitation shows that nuclei have ∼70% of fluorescence intensity found in the cytosol.
Plants expressing the nanosensors showed no obvious phenotypic differences compared with control plants either in growth chambers or in the greenhouse, suggesting that metabolism accommodates the presence of the proteins without major effects on growth and development (data not shown).
Analysis of Glucose Flux in Leaf Epidermis
Initially, experiments were hampered by focal drift attributable to tissue movement during perfusion. Therefore, leaves were immobilized on cover slips using a medical adhesive, and cell layers were removed from the leaf under phosphate buffer using a scalpel (Young et al., 2006). A perfusion chamber was formed around the tissue using polymer clay. The viability of cells was verified by observation of cytoplasmic streaming. FRET changes were analyzed under continuous perfusion with varying glucose supply. Leaf strips from plants expressing FLIPglu-600μΔ13 in the cytosol were perfused with 50 mM glucose to detect a maximal response. Reversible ratio changes were observed for both a pavement cell and a guard cell (Figure 4; see Supplemental Movie 1 online). A maximal ratio change of −0.26 was observed, significantly higher than in previous analyses in animal cells with the original FLIPglu-600μ, as was expected with respect to the improved sensitivity of this new nanosensor. The lower dynamic range observed in vivo compared with in vitro may be attributable to a variety of factors, such as the different properties of the fluorescence filters used, the effects of background fluorescence, and the inaccessibility of a fraction of the nanosensors. The shape of the curves, with a faster response to glucose addition than after glucose withdrawal, is similar to that observed with the original FLIPglu-600μ in mammalian cells (Fehr et al., 2005a).
Figure 4.

Glucose-Induced FRET Changes in the Cytosol of Leaf Epidermal Cells.
The FRET sensor FLIPglu-600μΔ13 with an affinity of 600 μM for glucose in stably transformed rdr6-11 Arabidopsis plants responds in the epidermis to perfusion with 50 mM glucose. Quantitative data were derived by pixel-by-pixel integration of the ratiometric images. The scale at right gives fluorescence intensity in arbitrary units (A.U.) for the individual eCFP (480/30) and eYFP (535/40) emission channels; the scale at left gives the ratio of eYFP intensity divided by eCFP intensity. For each phase (plus/minus glucose), one ratiometric image with a pavement and a guard cell is shown.
These data suggest that the nanosensor responds to glucose import with a negative ratio change, rapidly reaching saturation within 60 s, after which glucose levels increase beyond the detection range of the nanosensor (approaching saturation at ∼5 to 10 mM) (Figure 2). The ratio change is attributable to a reduction in resonance energy transfer, detectable by a correlated decrease in eYFP emission and increase in eCFP emission (Figure 4). Together, these data suggest that the accumulation phase is dominated by the rate of uptake, which must be faster than metabolism and compartmentation. In comparison, the kinetics of glucose decrease are slower than the import phase, suggesting that at this high level of glucose supply the lower end of the detection range of the nanosensor is reached within 3 to 5 min. The decline must be attributable to metabolism and efflux, potentially counterbalanced by compartmental release. These data suggest that in this range, glucose levels are not under tight homeostatic control and that the cytosolic steady state glucose levels are proportional to the external supply. If we assume that the affinity of the nanosensor is unchanged in vivo, the cytosolic levels can at least change between the low end of the detection level at ∼25 μM and beyond the saturation level of >10 mM at this high level of external supply.
The set of FLIPgluΔ13 affinity mutants was introduced into Arabidopsis rdr6-11 mutants, and the response of the four nanosensors with different affinities was analyzed systematically 3 to 6 h after the start of the light phase (Figure 5). In none of three independent epidermal preparations analyzed was a ratio change observed for the ultra-high-affinity nanosensor FLIPglu-170nΔ13, suggesting that under the conditions tested, the initial levels of glucose do not decline into the detection range of the sensor (between 90 and 340 nM; this assumes a worst-case scenario for the dynamic range of the nanosensor of twofold below and twofold above the Kd) (Figure 5A). Moreover, this finding strongly suggests that the observed ratio changes of the nanosensor FLIPglu-170nΔ13, which differs only in a single amino acid from FLIPglu-600μΔ13 and shows a similar maximal ratio change in vitro, is caused directly by a change in cytosolic glucose levels and is not the result of other factors such as changes in ionic conditions, pH, etc. No change was observed when plants expressing FLIPglu-2μΔ13 with an affinity of 2 μM for glucose were perfused with solutions containing up to 20 mM glucose (Figure 5B). However, in a single greenhouse-grown plant, a response was observed for FLIPglu-2μΔ13 (one of five; data not shown). Thus, although under growth chamber conditions glucose levels in light-grown plants probably did not decrease far below 300 μM (the worst-case scenario regarding sensitivity), under certain conditions, not further explored here, glucose levels can decrease significantly below the Kd of hexokinase (Cortes et al., 2003) and the values estimated by nonaqueous fractionation techniques (Heineke et al., 1994). However, we cannot exclude the possibility that wounding had an effect on sugar fluxes; moreover, we expect that differences in the physiological status of the plant (e.g., daytime, light intensity, and nutritional status) will affect the results.
Figure 5.

Glucose-Induced FRET Changes in Leaf Epidermal Cells.
Images were acquired and data were analyzed as described for Figure 4.
(A) Response of an epidermal region of a leaf from a transformant expressing FLIPglu-170nΔ13 to perfusion with 5 and 10 mM glucose (no response was seen to concentrations up to 20 mM; data not shown).
(B) Responses in a plant expressing FLIPglu-2μΔ13.
(C) Responses in a plant expressing FLIPglu-600μΔ13.
(D) Responses in a plant expressing FLIPglu-3.2mΔ13.
FLIPglu-600μΔ13 gave the most consistent results, with 19 of 20 cases showing a response to perfusion with external glucose (Figure 5C). The in vivo response of the nanosensor was concentration-dependent, with an apparent external glucose concentration corresponding to 50% saturation (D50) between 1 and 5 mM in the different experiments. To further explore the range at >1 mM, plants expressing the novel low-affinity nanosensor FLIPglu-3.2mΔ13 were analyzed. FLIPglu-3.2mΔ13 responded in five of eight cases tested, with a D50 of at least 10 mM (Figure 5D). The response at higher glucose levels corresponds to the low affinity of the nanosensor, suggesting that during perfusion with high external glucose supply, cytosolic glucose levels can increase beyond 6 mM.
Analysis of Glucose Flux in Intact Roots
To test whether FRET responses can be observed in intact organs, the nanosensor response was analyzed in roots of intact seedlings (four- to six-leaf stage). In some cases, FRET responses were observed on the same specimen for 4 h. Roots were glued to the cover slip, a polymer clay perfusion chamber was formed, and root tips were analyzed (Figure 6). In contrast with leaves, FLIPglu-170nΔ13 responded to glucose perfusion (6 of 10 cases), demonstrating that this nanosensor is functional in plants and showing that steady state glucose levels in the cytosol of roots can decrease to <90 nM (Figure 6A). The D50 was 0.25 to 0.5 mM. Consistent with the significantly lower cytosolic levels in roots, FLIPglu-2μΔ13 responded to glucose perfusion in eight of nine cases tested, with a D50 between 0.3 and 1 mM (Figure 6B). FLIPglu-600μΔ13 responded to glucose perfusion in six of seven cases; in the experiment shown at an apparent D50 between 1 and 5 mM, however, the maximal ratio change was lower compared with that found in leaves, suggesting that saturation was attributable to flux and not to saturation of the nanosensor (Figure 6C; cf. Figure 5C). FLIPglu-3.2mΔ13 did not show a response in any of five cases tested, supporting the lower steady state glucose levels in roots (Figure 6B). Thus, the steady state levels in roots are shifted to a lower concentration range relative to the leaf epidermis at least under the conditions tested, consistent with the leaf containing higher reserve levels for carbohydrates during the light period and the root serving as a sink that uses imported sugars efficiently to energize nutrient uptake and for growth. Future studies will explore whether steady state levels of glucose are higher, especially in the phloem-unloading zone behind the root tip, when the seedlings are exposed to light (Oparka et al., 1994).
Figure 6.

Glucose-Induced FRET Changes in Intact Roots.
Images were acquired and data were analyzed as described for Figure 4.
(A) Response of an intact root tip of an intact seedling from a transformant expressing FLIPglu-170nΔ13 to perfusion with 0.1 to 1 mM glucose (higher glucose levels did not lead to higher ratio changes; data not shown). Root tips were analyzed.
(B) Responses in a plant expressing FLIPglu-2μΔ13. For each phase (time points indicated by lines), a ratiometric image of a lateral root tip is shown. A lookup table is provided to the right of the images.
(C) Responses in a plant expressing FLIPglu-600μΔ13.
(D) Responses in a plant expressing FLIPglu-3.2mΔ13.
FLIP Nanosensors with Codon-Diversified Fluorescent Proteins
The use of an RNA-silencing mutant background for FRET analysis is not ideal. One hypotheses regarding nanosensor silencing was that either the presence of two copies of the nearly identical GFP variant genes (nucleotide sequences of eCFP and eYFP differ in only 16 bp) or the quasi-tandem repeat of two GFP sequences might enhance gene silencing. The simplest way to diversify the fluorophores appeared to be the use of fluorescent proteins from diverse species (e.g., the coral fluorophores MiCy and mKo) (Karasawa et al., 2004). Insertion of the glucose binding protein between MiCy and mKo (or the inverted version carrying mKo at the N terminus) with full linker sequences yielded a nanosensor that transferred energy between the two fluorophores but showed no glucose-dependent ratio change (data not shown). Linker shortening yielded a nanosensor with a small ratio change of only 0.02, whereas the inverted fusion with mKo at the N terminus yielded a ratio change of 0.12 (data not shown). A combination of mKo with an N-terminal eCFP provided a ratio change of 0.02, whereas the combination of an N-terminal MiCy with eYFP at the C terminus led to a nanosensor with a maximal ratio change of 0.2. These findings provide further support for the hypothesis that the rotational averaging of the fluorophore dipoles is a major factor affecting the ratio change (Deuschle et al., 2005b). Fluorophore insertion and extensive linker modifications will be required to obtain higher sensitivity nanosensors suited for in vivo measurements using these fluorophores.
As an alternative approach, the codon usage of eCFP and Venus (an eYFP mutant with reduced environmental sensitivity [Nagai et al., 2002]) was diversified, producing genes with no stretch longer than 5 bp being identical. The new genes (see Supplemental Figure 3 online), named Ares (codon-diversified eCFP gene) and Aphrodite (codon-diversified Venus gene), were synthesized and fused in the same manner to the glucose binding protein as in FLIPglu-600μΔ11 (Deuschle et al., 2005b). A higher maximal ratio change was obtained for the new nanosensor, probably as a result of altered dipole orientation in the chromophore of Venus compared with eYFP or the increased stability of Venus (Figure 7) (Rekas et al., 2002; L. Looger and W.B. Frommer, unpublished data). The nanosensor was cloned into a binary vector and introduced into Col-0, sgs3, and rdr6. Again, highly fluorescent plants were obtained only in the silencing mutants. Similar results were also obtained for FLIPglu-600μΔ13eCFP Aphrodite, in which eYFP was replaced by Aphrodite (Figure 7).
Figure 7.

Isotherms for Glucose Binding Proteins Fused to the Codon-Modified eCFP and Venus Encoding Ares and Aphrodite Genes.
(A) Glucose binding isotherms for FLIPglu-600μΔ11 (eCFP/eYFP), FLIPglu-600μΔ11 (Ares/eYFP), FLIPglu-600μΔ11 (eCFP/Aphrodite), and FLIPglu-600μΔ11 (Ares/Aphrodite).
(B) FLIPglu-600μΔ13 (eCFP/eYFP) and FLIPglu-600μΔ13 (eCFP/Aphrodite). Fractional saturation of the four nanosensors versus glucose concentrations is given for proteins purified from E. coli. Binding was measured as described for Figure 2C.
(C) Comparison of rapo − rsat in the FLIPglu-600μ variants carrying combinations of the different fluorophores.
These data strongly suggest that the copy number (CFP plus YFP genes) or the tandem array of the similar fluorophore genes is not sufficient to explain the transgene silencing. The overall transgene-silencing phenomenon could be suppressed by the use of transgene-silencing mutants. It is conceivable that the CaMV 35S promoter is the origin of the problems, although this promoter has been used successfully by other groups to overexpress proteins or to identify the cellular localization of fusion proteins using GFP. Therefore, future studies will make use of cell-specific promoters to test whether this will solve the problems, permitting the use of the nanosensors in wild-type plants.
DISCUSSION
FRET-based nanosensors have been used successfully to monitor steady state levels of glucose, changes in steady state levels in response to changes in external supply, relative flux across plasma membrane and endoplasmic reticulum membrane, and neurotransmitter release in mammalian cell cultures (Fehr et al., 2005b; Okumoto et al., 2005). The term nanosensor is being used not only in relation to the size of these biosensors but also to differentiate the term from receptors or sensors used by an organism for chemotaxis or for sugar signaling.
Previous attempts to functionally express these nanosensors in transgenic plants have failed (W.B. Frommer, unpublished data). Here, a set of four optimized nanosensors for glucose that provide a broader dynamic range compared with the previous nanosensors was developed. The nanosensors cover the low-nanomolar to high-millimolar range. The use of a set of nanosensors with different affinities has the additional advantage of providing internal controls that exclude artifacts (e.g., effects of other parameters such as glucose-induced pH changes to the observed FRET signal). These new nanosensors were introduced into mutants of Arabidopsis that are deficient in transgene silencing (Peragine et al., 2004; Vaucheret, 2005). In both rdr6-11 and sgs3-11 backgrounds, a large fraction of highly fluorescent plants was obtained, proving that the previous problems in obtaining highly fluorescent plants were attributable to effects mediated by the transgene-silencing pathway (Beclin et al., 2002; Jorgensen, 2003). The transformants were phenotypically indistinguishable from the parental lines, suggesting that the presence of the nanosensors does not have major physiological effects.
There are multiple potential explanations for the transgene silencing. The Agrobacterium tumefaciens strain GV3101 used here to obtain high transformation rates and high levels of expression typically leads to high copy insertion into the genome (Koncz and Schell, 1986). One of the most highly expressing rdr6-11 lines (8-2), in which all of the transformed T2 plants were highly fluorescent, showed a segregation of the resistance to BASTA of 210:19 (11:1), suggesting the integration of multiple copies. These complex insertions may render transgenes susceptible to transcriptional or posttranscriptional transgene silencing (Meza et al., 2002). It has been proposed that plants have evolved scanning mechanisms to detect foreign DNA (Meza et al., 2002), which may be identified by the aberrant GC content or by a threshold-dependent detection level of foreign transcripts, which is also dependent on translation (Que et al., 1997; Beclin et al., 2002). Our first hypothesis was that silencing is attributable to the gene dosage of eCFP/eYFP (Que et al., 1997; Lechtenberg et al., 2003; Schubert et al., 2004). The gene sequences of eCFP and eYFP are almost identical; thus, the constructs used here contained a quasi-tandem copy of a GFP gene. However, the presence of these two copies cannot be sufficient to trigger silencing, because codon-diversified variants (no stretch longer than 5 bp identical) showed a similar degree of silencing in wild-type Arabidopsis and gave high levels of expression only in the rdr6 mutant background. Alternatively, one may suspect that the viral CaMV 35S promoter could cause the high rates of silencing, but this promoter has been used by others without observing such dramatic rates of silencing (Cutler et al., 2000). The bacterial binding protein may contribute to silencing, although the same overall effect was observed during attempts to functionally express the maltose, Glu, and glucose nanosensors (data not shown). The sequences of these PBPs are highly divergent; however, we cannot exclude the possibility that the GC content of the genes or the use of rare codons, which affect translation, had an effect (Que et al., 1997). Further work will be required to define the cause of the silencing and to test whether the use of other promoters, the use of codon-optimized PBPs, and the use of different terminators will amend the problem.
It is obvious that the use of the transgene-silencing mutants, which show phenotypic differences from the wild type, is not ideal because one cannot exclude the possibility that sugar metabolism is altered in the mutants. A high signal-to-noise ratio is required to obtain robust quantitative data for steady state glucose levels. However, at present, no strategy other than the use of the silencing background is available, especially given that the cause of silencing remains unclear.
Using transgenic lines expressing four nanosensors with different affinities, glucose steady state levels were determined in epidermal cell layers of the leaf as well as in intact roots. The key findings are that the basal glucose levels appear higher in epidermal cells of leaves compared with roots, that glucose uptake appears more rapid than the reverse phase after withdrawal from the medium, and that the gradients across the plasma membrane are much steeper than anticipated from nonaqueous fraction studies (Heineke et al., 1994; Farré et al., 2001). In roots, levels rapidly decrease below the detection level of the ultra-high-affinity nanosensor FLIPglu-170nΔ13, suggesting that glucose is consumed efficiently, and levels decrease to <100 nM when external supply is absent. Vacuolar uptake and rapid metabolism may be the two major flux components contributing to extraordinarily low cytosolic levels. It would be interesting to measure the vacuolar pools in parallel with nanosensors targeted to the tonoplast. Further experiments will aim at characterization of the spatial distribution of glucose in roots when leaves are exposed to light. Leaf levels are significantly higher, and only in a few cases did glucose decline to levels permitting detection by FLIPglu-2μΔ13. The difference between epidermal cells and root cells is potentially attributable to the higher storage capacity of the leaf mesophyll. However, it is important to note that the response in leaves does not necessarily represent a physiologically normal situation but may correspond to the wounding response, in which redistribution from intact zones of the leaf may explain the higher basal levels. In our experimental setup, plants are kept in darkness for several hours during the experiment; thus, the root is not supplied with sucrose through the phloem. We expect that under physiological conditions in the light, sugar levels in both leaf and root would be higher.
The data that can be obtained with the nanosensors lend themselves to a more quantitative analysis to calculate flux rates. However, the data presented here were not acquired under laminar flow conditions. The volume in the perfusion chambers was variable; thus, the external concentration changes during medium exchange were probably slow. Moreover, the observed variation in responses, particularly for nanosensors in the extreme low-affinity and extreme high-affinity ranges, is probably attributable to variations in the growth conditions and variations in the time during the light period when the analyses were performed. The main goal here was to demonstrate that the improved FRET sensors can be used in planta. As is obvious from the results shown in Figures 4 to 6, the signal-to-noise ratio was not identical in all cases. Improvements in the FRET imaging technology on the illumination side, the use of more sensitive CCD cameras, and alternative techniques such as spectral analysis (Zimmermann et al., 2003) or fluorescence lifetime imaging (Dixit et al., 2006), in combination with improvements in the perfusion system, promise to produce high-quality data suitable for metabolic modeling. In addition, further improvements of the FRET sensors (e.g., the use of loop-inserted fluorophores) (Deuschle et al., 2005b) should help in providing higher ratio changes for in vivo analyses and thus a higher dynamic range. This will also provide the basis for more detailed analyses of cell-specific responses (e.g., in the root).
Interestingly, the response of the nanosensors occurs at approximately equal or higher external concentrations compared with the intracellular levels. The glucose transporters characterized to date are members of the STP family of proton cotransporters, concentrating glucose inside the cells (Sauer et al., 1990). A knockout mutant in the transporter STP1 led to reduced glucose uptake in roots, suggesting that it may be a major player in root sugar uptake (Sherson et al., 2000). The absence of a concentrative accumulation can be explained by rapid metabolism and compartmentation. It will be interesting to compare the steady state glucose levels and the kinetics of glucose level changes in mutants affected in transport, metabolism, and signaling.
The possibility to compare changes in sugar flux in real time in a set of mutants affected in sugar transport, metabolism, or signaling provides a complementary approach to mass spectrometry–based metabolomics as well as flux analysis by 13C labeling (Ettenhuber et al., 2005). Fluxomics is defined as the quantitative monitoring of whole network operations by methods of metabolic flux analysis, providing a global perspective on integrated regulation at the transcriptional, translational, and metabolic levels (Sauer, 2004). Fluxome analysis using 13C-labeled glucose and mass spectrometry has been used successfully to compare the flux in a set of yeast sugar signaling mutants (Raghevendran et al., 2004). A fully compartmentalized genome-scale metabolic model of Saccharomyces cerevisiae that accounts for 750 genes and their associated transcripts, proteins, and reactions has been reconstructed and validated (Duarte et al., 2004). This opens possibilities for carrying out metabolomic studies on a new scale providing a new set of data for systems biology. Thus, the availability of a set of nanosensors for small molecules such as pentoses (Lager et al., 2003), glucose (Fehr et al., 2003), maltose (Fehr et al., 2002), sucrose (Lager et al., 2006), and phosphate (H. Gu, S. Lalonde, S. Okumoto, L.L. Looger, A.M. Scharff-Poulsen, A.R. Grossman, J. Kossmann, I. Jakobsen, and W.B. Frommer, unpublished data), together with the ability to express them in the cytosol of transgenic plants, provides a new level for the analysis of both metabolic and signaling networks with high temporal and spatial resolution.
METHODS
Arabidopsis Transformation
Wild-type Col-0, sgs3-11 (Mourrain et al., 2000), and rdr6-11 (Peragine et al., 2004) Arabidopsis thaliana, a generous gift from Scott Poethig (University of Pennsylvania), were transformed using standard methods. rdr6-11 was derived from a T-DNA insertion line, although the mutation was not associated with the insertion. rdr6-11 carries a point mutation that generates a stop codon. The T-DNA had been crossed out of this line. For imaging, plants were grown in soil in a growth chamber with 12 h of light, 50% humidity, and 22°C. In some cases and for the analysis of primary transformants, plants were grown in the greenhouse.
FLIP Constructs and Plasmids
Affinity mutants were generated in the FLIPglu-600μΔ13 linker-shortening construct, which carries the F16A mutation (Deuschle et al., 2005b). Mutant forms carrying substitutions F16F (recreating the wild-type sequence; Kd = 170 nM), F16F/H152A (Kd = 2 μM), and F16A/S112A (Kd = 3.2 mM) were generated using site-directed mutagenesis (Kunkel et al., 1987). FLIPglu-600μ, FLIPglu-control, FLIPmal-25μ, and FLIPmal-control (all with citrine instead of eYFP) were cloned from pGEM-T using XhoI/BamHI sites of pRT100 (Töpfer et al., 1987) and then into pPZP312 (Hajdukiewicz et al., 1994) or pCAMBIA3300 using the HindIII sites flanking the cassette (see Supplemental Table 1 online). FLII81PE-1μ and FLII81PE-1m were excised from pRSET-B using BamHI/HindIII and inserted into the BamHI/SalI sites of CF203 (which is derived from pPZP212) after blunting the HindIII site. The nanosensor series of FLIPglu-Δ13s were amplified by PCR from pRSET, cloned into pRT100 (NcoI/XbaI), and then transferred into pPZP312 using the HindIII sites flanking the cassette (Figure 2B). Inserts were verified by DNA sequencing. Binary plasmids were introduced into Agrobacterium tumefaciens GV3101 and used for transformation (Koncz and Schell, 1986). Transgenic plants were selected with BASTA on soil or the respective herbicide in tissue culture.
Ares and Aphrodite
Codon-diversified versions of eCFP and Venus were constructed in silico. Every codon was changed alternatingly to maximize the sequence differences between the two genes while attempting to stay close to the Arabidopsis codon usage and including/excluding potential restriction sites. The new designs did not contain predicted splice sites. The sequences were synthesized by DNA2.0 and cloned into pJ2. Ares (accession number DQ525024) was exchanged for eCFP in pRSET-B FLIPglu-600μΔ11 using BamHI/KpnI restriction sites. Subsequently, eYFP was exchanged with Aphrodite (accession number DQ525025) in FLIPglu-600μΔ11 carrying Ares and in pRSET-B FLIPglu-600μΔ13 using XhoI and HindIII restriction sites. The new nanosensors were tested in vitro. Both nanosensors with eCFP and Aphrodite were cloned in pRT100 (NcoI and XbaI), whereas FLIPglu-600μΔ11 Ares/Aphrodite was cloned into pRT101 (BamHI and XbaI) and then into pPZP312 as described above for FLIPglu-600μΔ13.
In Vitro Characterization of FLIPglu
Proteins were expressed in Escherichia coli and isolated as described (Deuschle et al., 2005b). Substrate titration curves and substrate specificity analysis were performed using a monochromator microplate reader (Safire; excitation, 433/12 nm; emission, 485/12 and 528/12 nm; gain, 80). In vitro analyses were performed in 20 mM MOPS, pH 7.0. FRET was defined as peak emission intensity ratio at 480 nm (first eCFP peak) and 528 nm (eYFP peak). Using the change in ratio upon ligand binding, the Kd of the FLIP nanosensors was determined by fitting ligand titration curves to a single-site binding isotherm: S = (r − rapo)/(rsat − rapo) = [L]/(Kd + [L]), where S is saturation; [L] is ligand concentration; r is ratio; rapo is ratio in the absence of ligand; and rsat is ratio at saturation with ligand. Measurements were performed with at least three independent protein extracts, except for Ares and Aphrodite and mKo constructs.
Confocal Microscopy
Leaves were imaged using a Nipkow spinning disc confocal microscope. An incident argon (488 nm) ion laser (Coherent) beam was coupled to a modified Yokogawa spinning disc confocal scan head (Yokogawa Electric and Solamere Technology) via an acoustical optical tunable filter (NEOS). The confocal head was mounted on an inverted microscope (DM IRE2; Leica) equipped with a 63× glycerol-immersion objective (numerical aperture, 1.3; HCX PL APO 21°C; Leica) and a motorized Z-stage. Fluorescence images (525/50 nm for YFP) were acquired (2-s acquisition time) with a cooled on-chip multiplication gain Cascade 512B digital camera (Roper Scientific). Instrumentation was driven using Metamorph version 6.3r3 software (Molecular Devices).
In Vivo Imaging
Experiments were performed with plants that were grown in a growth chamber (except for those in Figure 4, which used greenhouse plants). Seedlings were imaged 3 to 6 h after the start of the light period. Because of the length of each experiment, it was not possible to perform analyses at defined times during the day; thus, individual experiments cannot be compared directly because of differences in light exposure. Rosette leaves were immobilized on cover slips (24 × 50 mm; No. 1 1/2; abaxial surface attached to cover slip) using medical adhesive (stock No. 7730; Hollister), and intact epidermal preparations were generated by slicing away mesophyll layers with a scalpel under immersion in 10 mM NaH2PO4, pH 5.8 (as described in Young et al., 2006). Roots were immobilized using the same method. A perfusion chamber was formed around the tissue using polymer clay (Sculpey; violet, polyform product); the volume of the chambers was variable between 1 and 2 mL. Ratio imaging was performed on an inverted fluorescence microscope (DM IRE2; Leica) with a CoolSnap HQ digital camera (Roper) and 20× immersion Corr, 40× oil, or 63× water-immersion lenses (HC PL APO 20x/0.7 or HCX PL APO; Leica). Dual emission intensity ratios were simultaneously recorded using a DualView image splitter (Optical Insights) with an OI-5-EM filter set (eCFP, 480/30; eYFP, 535/40) and Metafluor 6.3r7 software (Molecular Devices). Excitation was provided by a Lambda DG4 fluorescent light source (Sutter Instruments). Images were acquired within the linear detection range of the camera, and depending on the expression level, exposure times varied between 500 and 900 ms, with software binning between 2 and 3. Fluorescence intensities for eCFP and eYFP were typically in the range of 200 to 400 and 500 to 1200, respectively. In the case of roots, regions outside the root were used for background subtraction (background value, 90 to 110; 500-ms exposure time). Background values for untransformed roots were typically 110 to 120. In leaves, background fluorescence was not subtracted. Background values for untransformed leaves were typically 110 to 170 for the eCFP and eYFP channels. Perfusions were performed with 10 mM NaH2PO4, pH 5.8, at 2 mL/min. The baselines throughout were corrected using second- or third-order polynomial fits of the ratios measured in the absence of glucose. The obtained function describes the baseline aberration (photobleaching) as a function of time during the perfusion. To correct for this effect, the difference between the ratio at the beginning of the experiment [r(0)] and the baseline aberration [f(t)] was calculated at each time point of the measurement and added to the value of the measured ratio at the respective time point [r(t)]: rcorr(t) = r(t) + [r(0) − f(t)].
Accession Numbers
Sequence data from this article can be found in the GenBank/EMBL data libraries under accession numbers DQ525024 (Ares), DQ525025 (Aphrodite), and DQ867081 (FLIPglu-600μΔ13).
Supplemental Data
The following materials are available in the online version of this article.
Supplemental Table 1. Details of the Nanosensors Used for Arabidopsis Transformations That Showed Silencing Patterns Similar to Those Observed with FLIPgluΔ13.
Supplemental Figure 1. In Vitro Titration Curves for FLIPglu-170nΔ13, FLIPglu-2μΔ13, FLIPglu-600μΔ13, and FLIPglu-3.2mΔ13.
Supplemental Figure 2. In Vitro eYFP/eCFP Ratio for FLIPglu-600μΔ13 at pH 7.0 and 7.5 with 2 μM and 20 mM Glucose in 20 mM MES/Tris Buffer.
Supplemental Figure 3. DNA Sequence Alignment of the Synthetic Genes Ares and Aphrodite with eCFP and eYFP.
Supplemental Movie 1. Time-Lapse Movie Derived from the Experiment Shown in Figure 4.
Supplementary Material
Acknowledgments
This article is dedicated to the memory of one of the best plant cell biologists, Vincent R. Franceschi (Pullman, WA). We thank Gabi Fiene for excellent technical assistance and Loren Looger for critical reading of the manuscript. We are very grateful to Kathy Barton (Carnegie Institution) for the suggestion to use the silencing mutants sgs3 and rdr6. We also thank Julian Schroeder (University of California San Diego) for advice on immobilizing plant material. This project was supported by a grant from the Department of Energy (DE-FG02-04ER15542) and the European Science Award of the Körber Foundation (Hamburg, Germany).
The author responsible for distribution of materials integral to the findings presented in this article in accordance with the policy described in the Instructions for Authors (www.plantcell.org) is: Wolf B. Frommer (wfrommer@stanford.edu).
Online version contains Web-only data.
Open Access articles can be viewed online without a subscription.
References
- Barros, L.F., Porras, O.H., and Bittner, C.X. (2005). Why glucose transport in the brain matters for PET. Trends Neurosci. 28 117–119. [DOI] [PubMed] [Google Scholar]
- Beclin, C., Boutet, S., Waterhouse, P., and Vaucheret, H. (2002). A branched pathway for transgene-induced RNA silencing in plants. Curr. Biol. 12 684–688. [DOI] [PubMed] [Google Scholar]
- Cortes, S., Gromova, M., Evrard, A., Roby, C., Heyraud, A., Rolin, D.B., Raymond, P., and Brouquisse, R.M. (2003). In plants, 3-O-methylglucose is phosphorylated by hexokinase but not perceived as a sugar. Plant Physiol. 131 824–837. [DOI] [PMC free article] [PubMed] [Google Scholar]
- Cutler, S.R., Ehrhardt, D.W., Griffitts, J.S., and Somerville, C.R. (2000). Random GFP∷cDNA fusions enable visualization of subcellular structures in cells of Arabidopsis at a high frequency. Proc. Natl. Acad. Sci. USA 97 3718–3723. [DOI] [PMC free article] [PubMed] [Google Scholar]
- Deuschle, K., Fehr, M., Hilpert, M., Lager, I., Lalonde, S., Looger, L.L., Okumoto, S., Persson, J., Schmidt, A., and Frommer, W.B. (2005. a). Genetically encoded sensors for metabolites. Cytometry A 64 3–9. [DOI] [PMC free article] [PubMed] [Google Scholar]
- Deuschle, K., Okumoto, S., Fehr, M., Looger, L.L., Kozhukh, L., and Frommer, W.B. (2005. b). Construction and optimization of a family of genetically encoded metabolite sensors by semirational protein engineering. Protein Sci. 14 2304–2314. [DOI] [PMC free article] [PubMed] [Google Scholar]
- Dixit, R., Cyr, R., and Gilroy, S. (2006). Using intrinsically fluorescent proteins for plant cell imaging. Plant J. 45 599–615. [DOI] [PubMed] [Google Scholar]
- Duarte, N.C., Herrgard, M.J., and Palsson, B.O. (2004). Reconstruction and validation of Saccharomyces cerevisiae iND750, a fully compartmentalized genome-scale metabolic model. Genome Res. 14 1298–1309. [DOI] [PMC free article] [PubMed] [Google Scholar]
- Endler, A., Meyer, S., Schelbert, S., Schneider, T., Weschke, W., Peters, S.W., Keller, F., Baginsky, S., Martinoia, E., and Schmidt, U.G. (2006). Identification of a vacuolar sucrose transporter in barley and Arabidopsis mesophyll cells by a tonoplast proteomic approach. Plant Physiol. 141 196–207. [DOI] [PMC free article] [PubMed] [Google Scholar]
- Ettenhuber, C., Spielbauer, G., Margl, L., Hannah, L.C., Gierl, A., Bacher, A., Genschel, U., and Eisenreich, W. (2005). Changes in flux pattern of the central carbohydrate metabolism during kernel development in maize. Phytochemistry 66 2632–2642. [DOI] [PubMed] [Google Scholar]
- Farré, E.M., Tiessen, A., Roessner, U., Geigenberger, P., Trethewey, R.N., and Willmitzer, L. (2001). Analysis of the compartmentation of glycolytic intermediates, nucleotides, sugars, organic acids, amino acids, and sugar alcohols in potato tubers using a nonaqueous fractionation method. Plant Physiol. 127 685–700. [DOI] [PMC free article] [PubMed] [Google Scholar]
- Fehr, M., Frommer, W.B., and Lalonde, S. (2002). Visualization of maltose uptake in living yeast cells by fluorescent nanosensors. Proc. Natl. Acad. Sci. USA 99 9846–9851. [DOI] [PMC free article] [PubMed] [Google Scholar]
- Fehr, M., Lalonde, S., Ehrhardt, D.W., and Frommer, W.B. (2004). Live imaging of glucose homeostasis in nuclei of COS-7 cells. J. Fluoresc. 14 603–609. [DOI] [PubMed] [Google Scholar]
- Fehr, M., Lalonde, S., Lager, I., Wolff, M.W., and Frommer, W.B. (2003). In vivo imaging of the dynamics of glucose uptake in the cytosol of COS-7 cells by fluorescent nanosensors. J. Biol. Chem. 278 19127–19133. [DOI] [PubMed] [Google Scholar]
- Fehr, M., Okumoto, S., Deuschle, K., Lager, I., Looger, L.L., Persson, J., Kozhukh, L., Lalonde, S., and Frommer, W.B. (2005. a). Development and use of fluorescent nanosensors for metabolite imaging in living cells. Biochem. Soc. Trans. 33 287–290. [DOI] [PubMed] [Google Scholar]
- Fehr, M., Takanaga, H., Ehrhardt, D.W., and Frommer, W.B. (2005. b). Evidence for high-capacity bidirectional glucose transport across the endoplasmic reticulum membrane by genetically encoded fluorescence resonance energy transfer nanosensors. Mol. Cell. Biol. 25 11102–11112. [DOI] [PMC free article] [PubMed] [Google Scholar]
- Guy, M., Reinhold, L., and Michaeli, D. (1979). Direct evidence for a sugar transport mechanism in isolated vacuoles. Plant Physiol. 64 61–64. [DOI] [PMC free article] [PubMed] [Google Scholar]
- Hajdukiewicz, P., Svab, Z., and Maliga, P. (1994). The small, versatile pPZP family of Agrobacterium binary vectors for plant transformation. Plant Mol. Biol. 25 989–994. [DOI] [PubMed] [Google Scholar]
- Heineke, D., Wildenberger, K., Sonnewald, U., Willmitzer, L., and Heldt, H.W. (1994). Solute accumulation and decreased photosynthesis in leaves of potato plants expressing yeast-derived invertase either in the apoplast, vacuole or cytosol. Planta 194 29–33. [DOI] [PubMed] [Google Scholar]
- Jorgensen, R.A. (2003). Sense Cosuppression in Plants: Past, Present and Future. (Cold Spring Harbor, NY: Cold Spring Harbor Laboratory Press).
- Karasawa, S., Araki, T., Nagai, T., Mizuno, H., and Miyawaki, A. (2004). Cyan-emitting and orange-emitting fluorescent proteins as a donor/acceptor pair for fluorescence resonance energy transfer. Biochem. J. 381 307–312. [DOI] [PMC free article] [PubMed] [Google Scholar]
- Koncz, C., and Schell, J. (1986). The promoter of Tl-DNA gene 5 controls the tissue-specific expression of chimeric genes carried by a novel type of Agrobacterium binary vector. Mol. Gen. Genet. 204 383–396. [Google Scholar]
- Kunkel, T.A., Roberts, J.D., and Zakour, R.A. (1987). Rapid and efficient site-specific mutagenesis without phenotypic selection. Methods Enzymol. 154 367–382. [DOI] [PubMed] [Google Scholar]
- Lager, I., Fehr, M., Frommer, W.B., and Lalonde, S. (2003). Development of a fluorescent nanosensor for ribose. FEBS Lett. 553 85–89. [DOI] [PubMed] [Google Scholar]
- Lager, I., Looger, L.L., Deuschle, K., Hilpert, M., Lalonde, S., and Frommer, W.B. (2006). Conversion of a putative Agrobacterium sugar-binding protein into a FRET sensor with selectivity for sucrose. J. Biol. Chem., in press. [DOI] [PubMed]
- Lalonde, S., Ehrhardt, D.W., and Frommer, W.B. (2005). Shining light on signaling and metabolic networks by genetically encoded biosensors. Curr. Opin. Plant Biol. 8 574–581. [DOI] [PMC free article] [PubMed] [Google Scholar]
- Lalonde, S., Wipf, D., and Frommer, W.B. (2004). Transport mechanisms for organic forms of carbon and nitrogen between source and sink. Annu. Rev. Plant Biol. 55 341–372. [DOI] [PubMed] [Google Scholar]
- Lechtenberg, B., Schubert, D., Forsbach, A., Gils, M., and Schmidt, R. (2003). Neither inverted repeat T-DNA configurations nor arrangements of tandemly repeated transgenes are sufficient to trigger transgene silencing. Plant J. 34 507–517. [DOI] [PubMed] [Google Scholar]
- Lloyd, J.R., Kossmann, J., and Ritte, G. (2005). Leaf starch degradation comes out of the shadows. Trends Plant Sci. 10 130–137. [DOI] [PubMed] [Google Scholar]
- Meza, T.J., Stangeland, B., Mercy, I.S., Skarn, M., Nymoen, D.A., Berg, A., Butenko, M.A., Hakelien, A.M., Haslekas, C., Meza-Zepeda, L.A., and Aalen, R.B. (2002). Analyses of single-copy Arabidopsis T-DNA-transformed lines show that the presence of vector backbone sequences, short inverted repeats and DNA methylation is not sufficient or necessary for the induction of transgene silencing. Nucleic Acids Res. 30 4556–4566. [DOI] [PMC free article] [PubMed] [Google Scholar]
- Miyawaki, A., Llopis, J., Heim, R., McCaffery, J.M., Adams, J.A., Ikura, M., and Tsien, R.Y. (1997). Fluorescent indicators for Ca2+ based on green fluorescent proteins and calmodulin. Nature 388 882–887. [DOI] [PubMed] [Google Scholar]
- Mourrain, P., et al. (2000). Arabidopsis SGS2 and SGS3 genes are required for posttranscriptional gene silencing and natural virus resistance. Cell 101 533–542. [DOI] [PubMed] [Google Scholar]
- Nagai, T., Ibata, K., Park, E.S., Kubota, M., Mikoshiba, K., and Miyawaki, A. (2002). A variant of yellow fluorescent protein with fast and efficient maturation for cell-biological applications. Nat. Biotechnol. 20 87–90. [DOI] [PubMed] [Google Scholar]
- Ni, M., Cui, D., Einstein, J., Narasimhulu, S., Vergara, C., and Gelvin, S. (1995). Strength and tissue specificity of chimeric promoters derived from the octopine and mannopine synthase genes. Plant J. 7 661–676. [Google Scholar]
- Nordlie, R.C., Foster, J.D., and Lange, A.J. (1999). Regulation of glucose production by the liver. Annu. Rev. Nutr. 19 379–406. [DOI] [PubMed] [Google Scholar]
- Okar, D.A., and Lange, A.J. (1999). Fructose-2,6-bisphosphate and control of carbohydrate metabolism in eukaryotes. Biofactors 10 1–14. [DOI] [PubMed] [Google Scholar]
- Okumoto, S., Looger, L.L., Micheva, K.D., Reimer, R.J., Smith, S.J., and Frommer, W.B. (2005). Detection of glutamate release from neurons by genetically encoded surface-displayed FRET nanosensors. Proc. Natl. Acad. Sci. USA 102 8740–8745. [DOI] [PMC free article] [PubMed] [Google Scholar]
- Oparka, K.J., Duckett, C.M., Prior, D.A.M., and Fisher, D.B. (1994). Real-time imaging of phloem unloading in the root tip of Arabidopsis. Plant J. 6 759–766. [Google Scholar]
- Peragine, A., Yoshikawa, M., Wu, G., Albrecht, H.L., and Poethig, R.S. (2004). SGS3 and SGS2/SDE1/RDR6 are required for juvenile development and the production of trans-acting siRNAs in Arabidopsis. Genes Dev. 18 2368–2379. [DOI] [PMC free article] [PubMed] [Google Scholar]
- Que, Q., Wang, H.Y., English, J.J., and Jorgensen, R.A. (1997). The frequency and degree of cosuppression by sense chalcone synthase transgenes are dependent on transgene promoter strength and are reduced by premature nonsense codons in the transgene coding sequence. Plant Cell 9 1357–1368. [DOI] [PMC free article] [PubMed] [Google Scholar]
- Raghevendran, V., Gombert, A.K., Christensen, B., Kotter, P., and Nielsen, J. (2004). Phenotypic characterization of glucose repression mutants of Saccharomyces cerevisiae using experiments with 13C-labelled glucose. Yeast 21 769–779. [DOI] [PubMed] [Google Scholar]
- Rekas, A., Alattia, J.R., Nagai, T., Miyawaki, A., and Ikura, M. (2002). Crystal structure of Venus, a yellow fluorescent protein with improved maturation and reduced environmental sensitivity. J. Biol. Chem. 277 50573–50578. [DOI] [PubMed] [Google Scholar]
- Rolland, F., Baena-Gonzalez, E., and Sheen, J. (2006). Sugar sensing and signaling in plants: Conserved and novel mechanisms. Annu. Rev. Plant Biol. 57 675–709. [DOI] [PubMed] [Google Scholar]
- Romoser, V.A., Hinkle, P.M., and Persechini, A. (1997). Detection in living cells of Ca2+-dependent changes in the fluorescence emission of an indicator composed of two green fluorescent protein variants linked by a calmodulin-binding sequence—A new class of fluorescent indicators. J. Biol. Chem. 272 13270–13274. [DOI] [PubMed] [Google Scholar]
- Santangelo, G.M. (2006). Glucose signaling in Saccharomyces cerevisiae. Microbiol. Mol. Biol. Rev. 70 253–282. [DOI] [PMC free article] [PubMed] [Google Scholar]
- Sauer, N., Friedlander, K., and Graml-Wicke, U. (1990). Primary structure, genomic organization and heterologous expression of a glucose transporter from Arabidopsis thaliana. EMBO J. 9 3045–3050. [DOI] [PMC free article] [PubMed] [Google Scholar]
- Sauer, U. (2004). High-throughput phenomics: Experimental methods for mapping fluxomes. Curr. Opin. Biotechnol. 15 58–63. [DOI] [PubMed] [Google Scholar]
- Schubert, D., Lechtenberg, B., Forsbach, A., Gils, M., Bahadur, S., and Schmidt, R. (2004). Silencing in Arabidopsis T-DNA transformants: The predominant role of a gene-specific RNA sensing mechanism versus position effects. Plant Cell 16 2561–2572. [DOI] [PMC free article] [PubMed] [Google Scholar]
- Servaites, J.C., and Geiger, D.R. (2002). Kinetic characteristics of chloroplast glucose transport. J. Exp. Bot. 53 1581–1591. [DOI] [PubMed] [Google Scholar]
- Sherson, S.M., Alford, H.L., Forbes, S.M., Wallace, G., and Smith, S.M. (2003). Roles of cell-wall invertases and monosaccharide transporters in the growth and development of Arabidopsis. J. Exp. Bot. 54 525–531. [DOI] [PubMed] [Google Scholar]
- Sherson, S.M., Hemmann, G., Wallace, G., Forbes, S., Germain, V., Stadler, R., Bechtold, N., Sauer, N., and Smith, S.M. (2000). Monosaccharide/proton symporter AtSTP1 plays a major role in uptake and response of Arabidopsis seeds and seedlings to sugars. Plant J. 24 849–857. [DOI] [PubMed] [Google Scholar]
- Tam, R., and Saier, M.H. (1993). Structural, functional, and evolutionary relationships among extracellular solute-binding receptors of bacteria. Microbiol. Rev. 57 320–346. [DOI] [PMC free article] [PubMed] [Google Scholar]
- Töpfer, R., Matzeit, V., Gronenborn, B., Schell, J., and Steinbiss, H.H. (1987). A set of plant expression vectors for transcriptional and translational fusions. Nucleic Acids Res. 15 5890. [DOI] [PMC free article] [PubMed] [Google Scholar]
- Vaucheret, H. (2005). MicroRNA-dependent trans-acting siRNA production. Sci. STKE 2005 pe43. [DOI] [PubMed] [Google Scholar]
- Weber, A., Servaites, J.C., Geiger, D.R., Kofler, H., Hille, D., Groner, F., Hebbeker, U., and Flugge, U.I. (2000). Identification, purification, and molecular cloning of a putative plastidic glucose translocator. Plant Cell 12 787–802. [DOI] [PMC free article] [PubMed] [Google Scholar]
- Xiang, C., Han, P., Lutziger, I., Wang, K., and Oliver, D.J. (1999). A mini binary vector series for plant transformation. Plant Mol. Biol. 40 711–717. [DOI] [PubMed] [Google Scholar]
- Young, J.J., Mehta, S., Israelsson, M., Godoski, J., Grill, E., and Schroeder, J.I. (2006). CO(2) signaling in guard cells: Calcium sensitivity response modulation, a Ca(2+)-independent phase, and CO(2) insensitivity of the gca2 mutant. Proc. Natl. Acad. Sci. USA 103 7506–7511. [DOI] [PMC free article] [PubMed] [Google Scholar]
- Zimmermann, T., Rietdorf, J., and Pepperkok, R. (2003). Spectral imaging and its applications in live cell microscopy. FEBS Lett. 546 87–92. [DOI] [PubMed] [Google Scholar]
Associated Data
This section collects any data citations, data availability statements, or supplementary materials included in this article.