Abstract
Quasielastic neutron and light-scattering techniques along with molecular dynamics simulations were employed to study the influence of hydration on the internal dynamics of lysozyme. We identified three major relaxation processes that contribute to the observed dynamics in the picosecond to nanosecond time range: 1), fluctuations of methyl groups; 2), fast picosecond relaxation; and 3), a slow relaxation process. A low-temperature onset of anharmonicity at T ∼ 100 K is ascribed to methyl-group dynamics that is not sensitive to hydration level. The increase of hydration level seems to first increase the fast relaxation process and then activate the slow relaxation process at h ∼ 0.2. The quasielastic scattering intensity associated with the slow process increases sharply with an increase of hydration to above h ∼ 0.2. Activation of the slow process is responsible for the dynamical transition at T ∼ 200 K. The dependence of the slow process on hydration correlates with the hydration dependence of the enzymatic activity of lysozyme, whereas the dependence of the fast process seems to correlate with the hydration dependence of hydrogen exchange of lysozyme.
INTRODUCTION
A microscopic understanding of protein dynamics, i.e., motions of residues and secondary structures, is crucial for our understanding of protein function. Despite significant efforts in experimental and computational biophysics, many details of molecular motions in proteins remain poorly understood even on a qualitative level. Many relaxation processes (stochastic fluctuations between conformational states and substates) in biomolecules have been identified using NMR, Mössbauer spectroscopy, neutron scattering, and molecular dynamics simulations (1–6). However, their role in protein function is not yet clear and the most important processes that control biochemical activity of proteins have not been identified.
Protein dynamics are a function of temperature and hydration level and are strongly affected by the viscosity of the solvent (7–19). A simple quantity to characterize protein dynamics is the mean-squared atomic displacement 〈r2〉. It has been shown that 〈r2〉 varies linearly with temperature, 〈r2〉 ∝ T, up to ∼300–350 K in dry proteins and up to ∼180–230 K in hydrated proteins (1,11,18,20). Linear variations of 〈r2〉 with temperature correspond to harmonic motions of atoms and residues. However, above T ∼ 180–230 K strong anharmonic behavior of 〈r2〉 is observed in hydrated proteins, DNA, and RNA (8,9,14,17–19,21,22). This onset of anharmonicity appears as a sharp change in the temperature dependence of 〈r2〉 and is called the dynamical transition. These variations of 〈r2〉 have been observed in neutron scattering, x-ray diffraction and Mössbauer spectroscopic experiments and predicted by computer simulations for all hydrated proteins, DNA, and RNA studied to date (6,8,11,14,22–25). The onset of biological activity in proteins coincides with the dynamical transition temperature TD ∼ 200–230 K (8,14,17–19), although a number of exceptions have been reported (26–28). The role of dynamics in enzymatic activity has been reviewed by Daniel et al. (1). They note that different protein functions may have different dynamical dependencies. In addition, the dependence of enzyme activity on conformational dynamics is likely to be very dependent on the enzyme and its catalytic mechanism.
The microscopic nature of the dynamic transition in proteins remains unclear, although the importance of solvent translational motion for the dynamic transition seems to be well established (24,29). Some authors have suggested that proteins are more flexible above TD (30). However, not all regions of the protein undergo the dynamic transition (31) and the idea of molten surface state has also been proposed (32–34). Activation of a slow process that appears in the nanosecond time window at temperatures above TD has been observed (8,20,25,35). Analysis of molecular dynamics (MD) simulations of proteins under analogous conditions has provided microscopic information as to the origins of the dynamical changes activated above TD. Tournier and Smith (25), using an MD simulation of myoglobin and normal-mode analysis, concluded that motions of secondary structures that are activated above TD are responsible for the qualitative change in dynamics at the higher temperatures. The main contribution to 〈r2〉 at temperatures above TD has also been ascribed to the motion of side-chain groups and loop structures in previous experimental studies (3,8). Thus, we still have no clear picture of the dynamic transition and the qualitative change in dynamics above TD.
A change in the hydration level significantly affects the dynamics and activities of proteins. For example, the reported enzymatic activity of lysozyme has a step-like dependence on hydration level. The enzymatic activity is essentially nonmeasurable at hydration levels h < 0.2 (h = g water/g protein). As the hydration level is increased, the onset of enzymatic activity of lysozyme occurs at h ∼ 0.2, then increases sharply between h ∼ 0.2 and h ∼ 0.5, and weakly at h > 0.5, asymptotically approaching the level of activity in a dilute solution (5). This dependence of lysozyme activity on hydration differs from the dependence of hydrogen exchange rate on hydration (36). However, the increase in activity with hydration does agree with electron paramagnetic resonance spectroscopy that characterizes the rotation of a probe molecule close to the protein surface (5). Recently, lysozyme-water interactions have been studied by sorption calorimetry, where the requirement of water to induce a glass transition in the protein was reverified and a phase diagram of the water-lysozyme system over a broad temperature and hydration was presented (37). Many neutron scattering and Mössbauer spectroscopic measurements of proteins, DNA, and RNA have shown a significant change of their dynamics with hydration (6–9,20–22). This change has been interpreted as a change of the number of atoms involved in the motions rather than a change of the type of motion, and also as a change in the flexibility of the protein structure. Recently, the importance of a low-temperature onset of anharmonicity was emphasized in Roh et al. (38). This anharmonicity is independent of hydration and is ascribed primarily to activation of methyl-group dynamics (38).
The main goal of this article is the detailed analysis of the dynamics of lysozyme as a function of hydration and temperature in a broad pico- to nanosecond time window. We employed neutron and light-scattering spectroscopy and MD simulations to cover a broad frequency range from ∼240 MHz (1 μeV) to ∼5 THz (20 meV), thus covering a time range of ∼4 ns–∼0.1 ps. Three major relaxation processes were identified in the dynamics of lysozyme: 1), fluctuations of methyl group; 2), fast picosecond atomic fluctuations; and 3), a slow relaxation process. The relaxation processes have different dependencies on hydration: methyl-group rotation is essentially independent of hydration level; the fast process increases strongly at low hydration levels, h < 0.2, whereas the slow relaxation process is activated only at sufficient hydration levels, h > 0.2. The dependence of the slow process on hydration resembles the hydration dependence of the enzymatic activity of lysozyme, whereas the dependence of the fast process correlates with the hydration dependence of hydrogen exchange.
MATERIALS AND METHODS
Sample preparation
Samples for neutron-scattering measurements
Hen egg white lysozyme (Sigma-Aldrich, St. Louis, MO) was dialyzed to remove salts and lyophilized. The protein powder was dissolved in D2O to replace exchangeable hydrogen atoms in lysozyme molecules with deuterium atoms, and filtered to remove possible aggregates by a glass filter (pore size 0.2 μm). After lyophilization, hydration was achieved by isopiestic equilibration of the deuterium-exchanged protein with saturated solutions of LiCl, NaCl, and K2SO4 in D2O which resulted in hydration levels of h ∼ 0.05, 0.18, and 0.30, respectively. Samples with h ∼ 0.45, 0.50, and 0.80 were prepared by adding D2O to the 0.30 h sample and equilibrating the powders for at least 12 h. The mass of the samples was measured before and after neutron-scattering experiments and no loss of water was detected. The hydration levels were determined after performing neutron-scattering measurements from the observed mass change on drying samples by thermogravimetric analysis.
Samples for light-scattering measurements
Lyophilized lysozyme was used as purchased without further purification. Eight different hydration levels were prepared. LiCl, MgCl2·6H2O, Mg(NO3)2·6H2O, NaCl, and K2SO4 saturated aqueous solutions were used to produce lysozyme samples with 0.03, 0.10, 0.15, 0.20, and 0.35 h, respectively. Samples with 0.50, 0.75, and 0.85 h were obtained by addition of the appropriate amounts of water into the samples with 0.35 h. The hydration levels were determined by thermogravimetric analysis as described above. Samples were prepared with a thickness of ∼0.5–1 mm by sealing the powder between sapphire windows, which contributed a negligible intensity to the light-scattering spectra in the frequency range of interest (ν < 3 THz).
Neutron-scattering measurements
The incoherent neutron-scattering cross section of the hydrogen atom is much larger than that of any other atoms (e.g., ∼40 times larger than that of a deuterium atom). As a result, incoherent scattering of nonexchangeable hydrogen atoms of lysozyme dominates the neutron-scattering spectra of all our samples (it varies from ∼90% of the total scattering in the dry sample, h ∼ 0.03, down to ∼73% of the total scattering in the wet lysozyme at h ∼ 0.8). Thus, neutron-scattering spectra of all samples used in these studies mainly reflect motions of nonexchangeable hydrogen atoms in lysozyme. Details of neutron-scattering experiments of proteins can be found in various review articles (2,7,39). The neutron-scattering measurements were performed at the Center for Neutron Research at the National Institute of Standards and Technology. Total neutron scattering from the samples was ∼10%; thus, multiple scattering was negligible, especially in the high-momentum transfer (Q) region.
Two spectrometers, the high-flux backscattering spectrometer (HFBS) NG2 and the disk-chopper time-of-flight spectrometer (TOF) NG4, were employed to cover a sufficiently broad energy range (∼1 μeV (240 MHz) to ∼100 meV (24 THz)) for analysis of the complex relaxation spectra of proteins. Elastic scans with energy resolution δE ∼ 1 μeV (240 MHz) were carried out on HFBS upon cooling from 300 K down to 10 K at a cooling rate of 0.7 K/min to estimate mean-squared displacement 〈r2〉. The quasielastic scattering spectra in the energy range ΔE = ±36 μeV (9 GHz) and scattering wave vector range 0.25 Å−1 < Q < 1.75 Å−1 were measured at T = 295 K using the same spectrometer. Neutron scattering spectra at higher energies were measured at T = 295 K using TOF with λ = 8 Å (corresponding energy resolution δE ∼ 25 μeV (6 GHz) and elastic Q-range 0.08 Å−1 < Q < 1.46 Å−1). Neutron-scattering data were corrected for background scattering and scattering from the sample cell and analyzed using DAVE software provided by National Institute of Standards and Technology (40). The spectra were normalized by the mass of lysozyme in each sample.
No correction for multiple scattering has been applied. It is known that multiple scattering significantly affects quasielastic scattering (QES) spectra at low Q. The first-order incoherent scattering increases with Q, whereas multiple scattering is essentially Q-independent. As a result, a contribution from multiple scattering is usually only significant at low Q and is negligible at higher Q. Multiple scattering corrections are not a trivial task and complicate the analysis. To eliminate contributions due to multiple scattering in the analysis of QES spectra, we only considered intensities for Q > 0.5 Å−1. This was not necessary in the analysis of the elastic intensities, and thus a broader Q-range was utilized.
Light-scattering measurements
Depolarized light-scattering spectra were measured at T = 295 K in back-scattering geometry using a Raman spectrometer (triple-monochromator T64000, Jobin Yvon, Longjumeau, France) and a six-pass tandem Fabry-Perot interferometer (Sandercock model). A frequency range from ∼25 GHz (∼0.1 meV) up to ∼25 THz (∼10 meV) was covered by these spectrometers. An Ar2+ laser with λ = 514.5 nm and ∼25 mW power on the sample was used as the excitation source.
The spectra had a small contribution due to fluorescence that was corrected as described previously (12). The spectra were normalized at the high-frequency region above ∼3 THz, where vibrational modes do not show a significant dependence on hydration. The contribution of water to the light-scattering spectra in the frequency range of interest was negligible at the hydration levels studied (see, e.g., Caliskan et al. (12)) due to the weak optical polarizability of water. Thus, the light-scattering spectra at the hydration levels measured were dominated by the internal dynamics of the protein.
Molecular dynamics simulation
The initial structure used for molecular dynamics simulations of hydrated lysozyme was taken from coordinates from the protein data bank file 6LYZ (41). Two lysozyme molecules with a random relative orientation were placed in a periodic box (32 Å × 53 Å × 41 Å) and solvated in TIP3P water (42). The CHARMM-22 force field (43) was used as incorporated in the program NAMD (44). The hydrated lysozyme system was equilibrated at 300 K for 1 ns in the NVT ensemble. Configurations at lower temperatures were generated by cooling the equilibrated 300 K configuration at −0.1 K/ps to each of the desired lower temperatures, where the systems were equilibrated for 1 ns under NVE conditions. An additional 10 ns of trajectories were collected at each temperature for further study. Before analysis, each configuration time step was corrected for center of mass and rotational motion. Effective rotational correlation times were calculated using the Lipari-Szabo formalism (45). Mean-square displacements were calculated in the same manner as done in the neutron data reduction, i.e., from Iel(Q,t) using an identical resolution function and Q range. This method has been shown to provide quantitative 〈r2〉 for hydrated protein powders that are in agreement with experiment (46).
RESULTS
The mean-squared atomic displacement was calculated using the Gaussian approximation:
 |
(1) |
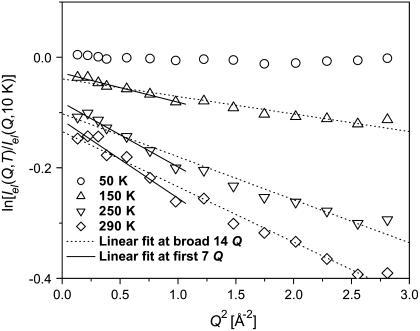
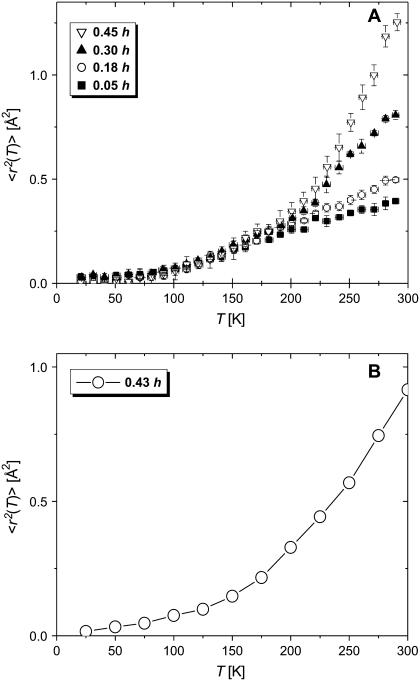
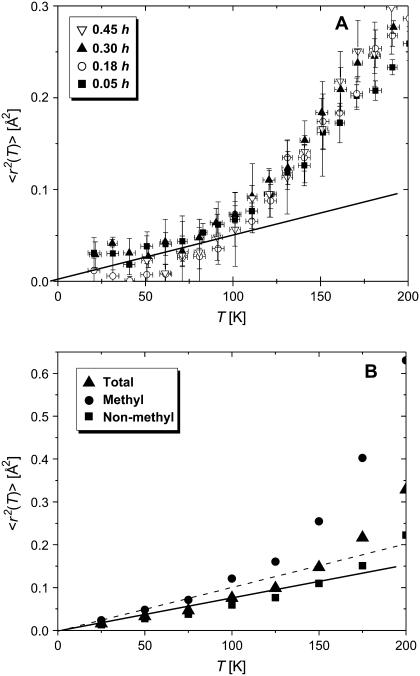
where Iel(Q,T) is the elastic incoherent neutron scattering intensity measured at a particular Q and T. This approximation works in the limit Q→0 as shown in Fig. 1. Thus, the lowest Q-range, 0.35 Å−1 < Q < 1.00 Å−1 (0.1 Å−2 < Q2 < 1 Å−2) was used. 〈r2(T)〉 reflects a variety of hydrogen atomic motions (vibrations, rotations, diffusive motions, etc.) in lysozyme on a timescale faster than ∼1 ns (defined by the resolution of HFBS). 〈r2(T)〉 shows the characteristic dynamic transition at TD ∼ 200–220 K, but only in samples with h > 0.2 (Fig. 2 A). More interesting, however, is the existence of a low-temperature onset of anharmonicity at T ∼100 K that appears in 〈r2(T)〉 of all the samples regardless of the hydration level (Fig. 3 A). This observation clearly contradicts the conventional view (8,11,15,18,21,26,27,47–50) that 〈r2(T)〉 in proteins exhibits only harmonic dynamics below TD.
FIGURE 1.
Ln(Iel(Q,T)/Iel(Q,10 K)) of dry lysozyme versus Q2. The dashed lines represent linear fits using the broad Q range (up to Q2 ∼ 3 Å−2), whereas the solid lines represent linear fits in the narrower Q range up to Q2 ∼ 1 Å−2.
FIGURE 2.
Temperature variations of mean-squared atomic displacement, 〈r2(T)〉. (A) Experimental data at different hydration levels: 0.05 (dry), 0.18, 0.30, and 0.45 h. Crystallization of D2O prevented accurate measurements of 〈r2(T)〉 in samples at h > 0.45. (B) Simulations for wet lysozyme (0.43 h).
FIGURE 3.
Low-temperature behavior of 〈r2(T)〉. (A) Experimental data showing the onset of anharmonicity at T ∼ 120 K. (B) Simulations for wet lysozyme (0.43 h), contributions of methyl and nonmethyl atoms are presented separately. The lines are the extrapolation of low-temperature harmonic behavior.
The 〈r2〉 obtained from MD simulations agrees well with the experimental results for the wet sample in the entire temperature range (Fig. 2 B). Thus, at least on average, the model and simulation methodology accurately represents the temperature dependence of the dynamics of nonexchangeable hydrogen atoms in a hydrated lysozyme powder. Quantitative agreement with experiment was achieved by calculating the 〈r2〉 from S(Q,0) after correcting for the finite resolution of the HFBS using a representative sampling time (>10 ns). Additionally, the agreement with experiment was also aided by adequate temporal sampling of the single-particle correlation function inherent in the incoherent intermediate scattering function, I(Q,t), used to obtain S(Q,ν).
The quasielastic spectra obtained from the HFBS measurements for protein samples of various hydration levels were presented and discussed in our previous publication (38). Surprisingly, a strong QES contribution was observed in the dry sample (38). These observations suggest that a significant relaxation process is present in the dry protein at T = 295 K, i.e., below the dynamical transition temperature of the low-hydration sample. The QES intensity remained essentially unchanged when the hydration level was raised to h ∼ 0.18, but then it increased significantly with h at higher hydration levels (38).
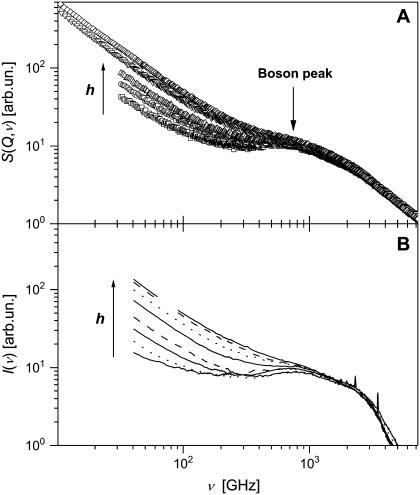
Neutron and light-scattering spectra measured at higher frequencies were dominated by two contributing factors (Fig. 4): 1), QES due to various relaxation processes at frequencies below ν ∼ 200 GHz; and 2), the boson peak at ν ∼ 1 THz that is usually assigned to collective vibrations of protein atoms (9,51,52). The QES contribution increases monotonically with hydration level and overshadows the boson peak at higher h. The QES intensity at higher frequencies increases with hydration at low levels, h < 0.2 (Fig. 4). This differs from the QES behavior observed at lower frequencies. Moreover, the dependence of the QES intensity on hydration level appears to be stronger in the light-scattering spectra than in the neutron-scattering spectra (Fig. 4).
FIGURE 4.
(A) High-frequency dynamic structure factor, STOF(Q,ν), summed over all Q. Samples are 0.05 (dry), 0.18, 0.30, 0.50, and 0.80 h. (B) Light-scattering intensity, I(ν). Samples are 0.03 (dry), 0.10, 0.15, 0.20, 0.35, 0.50, 0.75, and 0.85 h. All neutron- and light-scattering spectra were obtained at T = 295 K and normalized at a high-frequency region that is not sensitive to hydration, ∼2.5 THz (∼10 meV).
DISCUSSION
Low-temperature onset of anharmonicity and methyl-group dynamics
One of the most intriguing observations is the existence of the low-temperature onset of anharmonicity that appears in all the samples, regardless of the hydration level (Fig. 3). A survey of neutron-scattering data from the literature shows that the changes in 〈r2〉 at T ∼ 100 K is apparent in the spectra of a number of proteins (8,48,53,54), but its microscopic nature has not been discussed in detail. Cordone et al. (54) attributed the observed increase in 〈r2〉 at T ∼ 100 K to quantum effects for zero-point vibrations with characteristic energy νvib ∼ 210 cm−1 (∼6 THz). It is possible to interpret our data (Fig. 3) with a similar value of νvib. However, there are no strong vibrational modes in this frequency range (Fig. 4). The boson peak observed at ν ∼ 1 THz (∼20–30 cm−1) dominates the neutron-scattering spectra of proteins and the corresponding quantum effects are only relevant at much lower temperatures. Thus, the low-temperature onset of anharmonic dynamics observed in the behavior of 〈r2〉 cannot be ascribed to a quantum mechanical vibrational contribution.
This conclusion agrees with the results of previously published MD simulations of an isolated, essentially dehydrated molecule of bovine pancreatic trypsin inhibitor (55). Using normal-mode analysis to characterize the temperature dependence of the dynamics, the authors noted an onset of anharmonicity in 〈r2〉 at T ∼ 100 K. They showed that it cannot be ascribed to quantum effects because no significant difference has been observed between classical and quantum mechanical calculations at T > 100 K. However, they did not discuss the microscopic nature of the observed anharmonicity and only indicated that hydrogen atoms are not all equally involved in the observed increase in 〈r2〉. A strong QES contribution observed in the spectra of the dry protein at T = 295 K (Fig. 3) indicates that at least some relaxation modes are activated even at a low hydration level.
In (38) we proposed that activation of methyl-group rotational dynamics is primarily responsible for the low-temperature onset of anharmonicity because 26% of all nonexchangeable H-atoms in lysozyme are on methyl groups. Earlier NMR studies have demonstrated that methyl-group rotational dynamics in proteins and polypeptides is activated at low temperatures independent of hydration level (56–58). Also, earlier neutron-scattering studies of proteins and polypeptides indicate a significant contribution from methyl-group dynamics (59,60). Moreover, detailed NMR studies suggest that methyl-group rotations contribute ∼80% of the total proton relaxation in dry lysozyme, with the remaining proton relaxation occurring in flexible O-H and N-H groups (56). These particular hydrogen atoms do not exist in our study, since they were exchanged with deuterium atoms in our samples. Thus, a higher relative contribution of methyl-group dynamics should be expected in our measurements. A recent analysis of neutron-scattering data in dry myoglobin has also ascribed ∼80% of the observed relaxation to methyl-group rotational dynamics (60).
A preliminary analysis of the low-frequency (HFBS) data for dry lysozyme has been reported in (38). Here we present a more thorough test of whether temperature, frequency, and Q-dependence of the observed QES contribution in dry lysozyme can be assigned to methyl-group rotational dynamics. The dynamic scattering function, S(Q,ν), for methyl-group rotation can be described by a three-site jump model that includes a distribution of relaxation time, τi, presented by a sum of Lorentzians Li(ν,τi) (61):
 |
(2) |
j0(x) is the zeroth-order Bessel function and R is the radius of methyl-group rotation. The characteristic time (τ) of methyl-group rotation usually follows an Arrhenius temperature dependence, τi = τ0exp(Ei/kT)/1.5, with τ0 ∼ 2.8 × 10⁻¹⁴ s (59,61). The activation energy Ei depends on the type of amino acid residue and the local environment (62–65). The distribution of energy barriers g(Ei) that controls methyl-group rotation can be estimated from the temperature variations of the elastic intensity Iel (Q,T) (61):
 |
(3) |
Here  is the Debye-Waller factor and
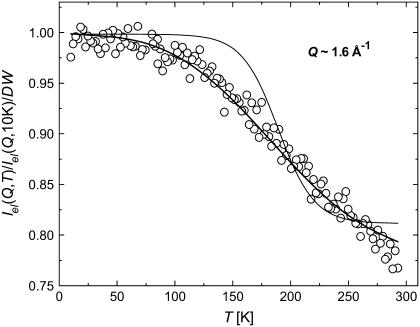
  is the vibrational mean-squared atomic displacement that was estimated from the slope of 〈r2〉 versus T at T < 100 K (Fig. 3 A, solid line). The pmethyl is the fraction of hydrogen atoms involved in the methyl-group rotation and R(ν) is the resolution function of the spectrometer. The latter was approximated by a Gaussian function with full width at half-maximum ∼1.2 μeV (290 MHz). Our analysis shows (Fig. 5) that a single energy barrier cannot describe the experimental data for Iel(Q,T)/DW(Q,T) in the dry sample. Assuming a Gaussian distribution of energy barriers, g(Ei) ∝ exp(−(E0–Ei)2/2ΔE2), Eq.3 provides a good description of the data at different Q with E0 ∼ 16.6 kJ/mol and ΔE ∼ 5.8 kJ/mol (Fig. 5). The estimated distribution of energy barriers g(Ei) agrees well with previously published NMR data for methyl-group rotation in dry lysozyme (56–58,65). Moreover, this distribution describes well the shape of the QES spectra in a dry sample at T = 295 K (38).
FIGURE 5.
Temperature variations of elastic intensity, Iel(Q,T), in dry sample (0.05 h) corrected for the Debye-Waller factor (○). Solid lines represent the results of the fit using Eq. 2 with a single barrier E ∼ 16 kJ/mol (thin line) and a Gaussian distribution of the energy barriers with E0 ∼ 16.6 kJ/mol and ΔE ∼ 5.8 kJ/mol (thick line) for the methyl-group rotation.
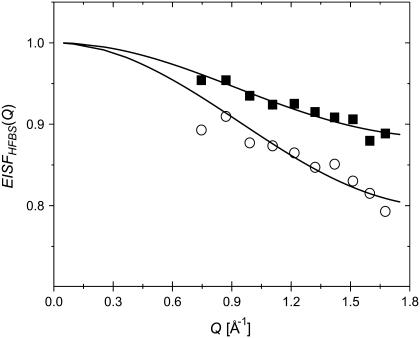
Equation 2 also provides a description of the Q-dependence of the methyl-group spectra. It has contributions from an elastic scattering component (the first term) and a quasielastic component (the second term). One way to analyze the data is by a decomposition of the experimental spectra as the elastic incoherent structure factor (EISF) plus a QES component (see, e.g., Perez et al. (7)). EISF(Q) provides information on the geometry of the atomic motion and the fraction of hydrogen atoms involved. The usual approximation to calculate the EISF(Q) is to present the spectrum as a sum of a δ-function (elastic scattering) and a Lorentzian (quasielastic scattering), both convoluted with the resolution function of the spectrometer. The EISF is calculated as a ratio of elastic scattering to the total elastic and quasielastic scattering. We applied this procedure to analysis of the QES spectra of dry sample at each Q and obtained EISF(Q) (Fig. 6). In the case of methyl-group rotation it should be described by the following equation (39,59):
 |
(4) |
Here the term 1 − pmethyl represents the elastic intensity coming from nonmethyl atoms and the remaining terms represent the elastic intensity due to methyl groups (the first term in Eq. 2 weighted by pmethyl). The best fit of the data to Eq. 4 was obtained with pmethyl ∼ 0.14 ± 0.01 and R ∼ 1.3 ± 0.2 Å (Fig. 6). Although the characteristic radius appears to be close to the radius of a methyl group (Rmethyl ∼ 1 Å), pmethyl ∼ 0.14 is significantly lower than the fraction of hydrogen atoms on methyl groups in lysozyme, ∼0.26. It is known that approximating the QES spectrum by a single Lorentzian is not accurate. Our earlier analysis (Fig. 5) shows that use of a single energy barrier (or single τ) does not describe the experimental data. Instead, a distribution of τ (distribution of Lorentzians) should be used. Use of the distribution of relaxation times (expressed through g(Ei)) instead of a Lorentzian results in much lower values of EISF(Q) (Fig.6) (38), because the relaxations that occur outside of our frequency window are also taken into account. The best fit of the data to Eq. 4 (Fig. 6) results in R ∼ 1.3 ± 0.2 Å and pmethyl ∼ 0.25 ± 0.03, in very good agreement with the expected value for methyl-group rotational dynamics in lysozyme. This analysis clearly shows that the traditionally used approximation of the QES spectra by a single Lorentzian (see, e.g., Perez et al. (7)) is not accurate and can give misleading quantitative results.
FIGURE 6.
EISF(Q) for the dry sample (0.05 h) at T = 295 K obtained using single Lorentzian approximation for QES (•) and using distribution of energy barriers (○). Solid lines represent the fit to Eq. 4.
The interpretation presented above is further supported by analysis of simulation data (Fig. 3 B). Contributions to 〈r2〉 from methyl and nonmethyl hydrogen atoms are easily separated in the simulation data. Such an analysis clearly shows that the major contribution to the low-temperature anharmonicity comes from methyl-group dynamics. Although methyl groups contain only ∼25% of the hydrogen atoms, they contribute ∼65% of anharmonicity even at T = 200 K (Fig. 3 B). Note that the remaining anaharmonicity arising from nonmethyl hydrogen atoms is also apparent in the data at temperatures >150 K (Fig. 3 B).
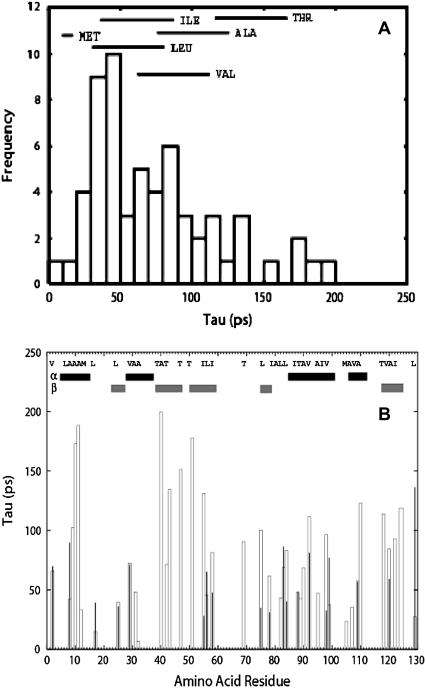
MD simulations of hydrated lysozyme at T = 295 K show that the methyl-group dynamics can be described by a broad distribution of rotational correlation times with an average τ ∼75 ps (Fig. 7 A). This τ corresponds to an average energy barrier ∼16 kJ/mol that agrees well with the value of E0 obtained from analysis of the neutron-scattering data. Simulations, however, can provide a microscopic explanation for the broad distribution of relaxation times and corresponding energy barriers. The fastest methyl rotation (τ ∼ 20–30 ps) appears in methionine residues where there is an extremely low barrier to rotation in the thioether fragment. The longest τ (τ > 200 ps) appears in some alanine and threonine residues (Fig. 7 A). However, the characteristic τ for most of the residues depends also on their positions in the protein (Fig. 7 B). For example, τ varies from ∼25–40 ps (Ala-82, Ala-107) up to ≥200 ps (Ala-10, Ala-11) in Ala residues and from ∼35 ps (Thr-89) up to ≥200 ps (Thr-40) in Thr residues. Thus, the broad distribution of relaxation times observed for methyl groups is dictated by particular parent amino acid residues containing the methyl groups and the local environment within the protein (Fig. 7 B). This conclusion agrees with earlier NMR studies of polypeptides (62–64). Detailed analysis of results of MD simulations shows that seven methyl groups (Met-12, Leu-17 (both methyls), Ile-55 (both methyls), Leu-56 (Cδ1), and Met-105) exhibit anharmonic dynamics at 125 K. They are buried near the active site of the enzyme (66) and therefore, inherently, they may experience a sterically less restricted local environment that is required for enzymatic activity. It has been shown that lysozyme has a long lengthscale interdomain (hinge-bending) motion that involves residues both near the active site and delocalized across the protein (67). A thorough analysis of the dynamics of atoms involved in the low-temperature onset of anharmonicity with hinge-bending motions of lysozyme is in progress but is beyond the scope of the current work.
FIGURE 7.
Distribution of effective rotational correlation times (τ) for methyl groups in lysozyme obtained from molecular dynamics simulations for wet sample (0.43 h) at T = 295 K, (A) presented as a histogram with residue names marked on top, and (B) presented for each residue separately.
Now we comment on why the low-temperature onset of methyl-group dynamics was not identified in previous analyses of neutron-scattering spectra of lysozyme (3,7,11). The data presented in Fig. 2 agree well with the results of Tsai et al. (11) obtained using the same experimental conditions (after taking into account the factor of 3 that the authors did not include in the definition of 〈r2〉). However, Tsai et al. (11) interpreted the temperature variations of 〈r2〉 in dry and wet samples at T < 200 K as purely harmonic/vibrational contributions. The harmonic/vibrational contributions of  for lysozyme at ambient T has been estimated from analysis of vibrational spectra at E > 1 meV (240 GHz) (7). Using the range Q < 2 Å−1, the authors estimated
  to be ∼0.17 Å2. This value is significantly smaller than the total 〈r2〉 ∼ 0.4 Å2 observed for dry lysozyme powder at T ∼ 295 K (Fig. 2). However, extrapolation of the estimated harmonic contribution (Fig. 3 A, solid line) to 295 K gives
  ∼ 0.15 Å2, which is in good agreement with the estimated value of ∼0.17 Å2 (7). The temperature dependence of 〈Δx2〉 in wet lysozyme also has been analyzed by Doster and Settles (3) using neutron-scattering data measured with the IN13 spectrometer, which has a broader energy resolution (∼80 ps) and a broader Q-range (the relevant Q2 range is up to ∼25 Å2) than the spectrometer employed in this work (3). Harmonic behavior was observed up to 180 K, and extrapolation to 300 K gives
  ∼ 0.1 Å2 (taking into account the factor of 3 difference in the definition of 〈Δx2〉 and of 〈r2〉), which is smaller than the values obtained in our work and in other publications (7,11). It is known that the Gaussian approximation (Eq. 1) employed at higher values of Q underestimates 〈r2〉 due to non-Gaussian behavior of the dynamic structure factor. Thus, the difference might be related to the higher Q-range used by Doster and Settles (3) to estimate 〈r2〉 (their article does not describe the Q-range used, but it should be broader because of the higher energy neutrons used by IN13). Taking into account the broader resolution function used in the Doster and Settles study (3), one would expect the onset of methyl-group rotation to appear at T ∼ 150 K. However, this onset may be masked by the dynamical transition at T ∼ 180 K in the data presented by Doster and Settles (3).
Thus, the presented experimental data agree well with earlier studies of lysozyme dynamics. However, the previous studies did not notice or describe in detail the low-temperature onset of anharmonicity. The analysis presented here and the results of an earlier article (38) show that the temperature, spectral, and Q-dependence of the low-frequency QES contribution in dry lysozyme can be quantitatively well described by methyl-group rotational dynamics. It is known that methyl-group dynamics are not affected significantly by hydration (48). Analysis of the present experimental and simulation data (Fig. 3 B) suggests that the primary cause for the low-temperature onset of anharmonicity observed in all samples, regardless of hydration, is due to the onset of methyl-group rotational dynamics. Moreover, the conventional view of harmonic-like dynamics in dry proteins over the entire temperature range studied and in hydrated proteins at T < TD is not completely correct. At the least, methyl groups are fluctuating between different conformational states and provide a significant anharmonic contribution to the neutron-scattering spectra below TD. The analysis of MD simulations of appropriately hydrated lysozyme powder indicates that a minor anharmonicity is contributed also by nonmethyl nonexchangeable hydrogens at T > 125 K (Fig. 3 B). These conclusions are consistent with the recent results that indicate a significant relaxation contribution in dry pig liver esterase (68). Moreover, it is possible that the increase in the QES intensity observed in dry esterase at T > 280K can be ascribed to methyl-group rotation that reaches the energy window (>100 μeV (∼24 GHz)) used in this experiment (68).
Relaxation spectra over a broad frequency range
When analyzing relaxation processes, quasielastic neutron-scattering spectra are often approximated by a sum of a few Lorentzians, where the Q and T dependence of the Lorentzian line width (Γ) are determined (7,9). It is known, however, that relaxation in complex systems, including biological macromolecules, involves a number of processes, each of which is often better described by a strongly stretched exponential (8,20,35,51,52). The latter means that the decay can be approximated by the so-called Kolrausch-Williams-Watts equation, I(Q,t) ∝ exp(−(t/τ)β) with β < 1, or by a Cole-Davidson distribution function for the dynamic susceptibility function in the frequency domain, χ″(ν) = (1 − iντ)−b, b < 1. This function is a simple Lorentzian when b = 1, χ″(ν) = (1 − iντ)−1. Thus, approximation of a relaxation spectrum by a sum of a few Lorentzians (i.e., a sum of a few exponential decays) is not accurate and can provide misleading results.
An alternative way to analyze quasielastic scattering spectra is by presenting them as the imaginary part of the dynamic susceptibility, χ″(Q,ν), instead of S(Q,ν). The dynamic susceptibility is related to S(Q,ν) (its energy gain side, usually measured in neutron scattering) through the Bose occupation number nB(ν) = (exp(hν/kT) − 1)−1,
 |
(5a) |
The light-scattering susceptibility is related to the measured intensity I(ν) through nB(ν) + 1 factor (because the energy loss side of the spectra is traditionally measured in this case):
 |
(5b) |
The use of susceptibility spectra to represent the relaxation processes has several advantages.
Trivial temperature variations are taken into account.
Scattering data can be directly compared to dielectric ɛ″(ν) or mechanical G″(ν) loss data.
Relaxation processes in the susceptibility spectrum appear as a maximum at νmax ∼ (2πτ)−1; therefore, relaxation processes with well-separated τ appear as separated peaks and it is easy to distinguish slow and fast processes.
The spectral shape provides information about the stretching of the relaxation process where usually high- and low-frequency tails of a relaxation maximum can be approximated by a power law χ″(Q,ν) ∝ νb. Values of b = 1 or –1 correspond to a single exponential relaxation (a Lorentzian), whereas –1 < b < 1 corresponds to a stretched relaxation process or a broad distribution of relaxation times. In this respect, the dynamic susceptibility presentation simplifies analysis of complex relaxation spectra.
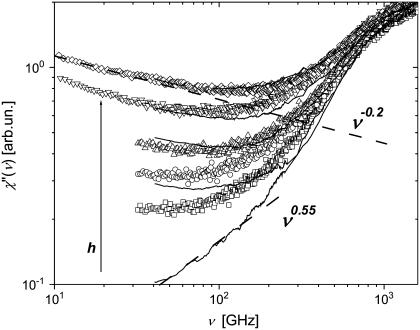
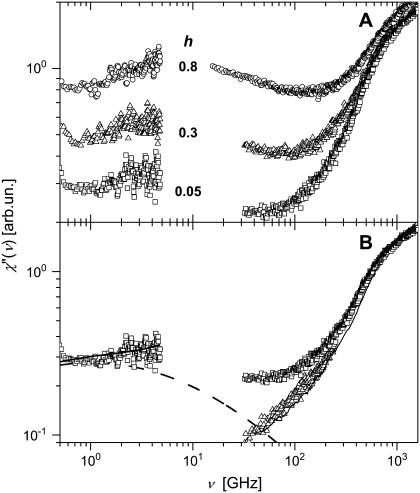
We start our analysis by the comparison of neutron- and light-scattering susceptibility spectra (Fig. 8). Neutron- and light-scattering spectra appear to be similar at high hydration levels (h ≥ 0.3) and show two well-separated relaxation processes, a fast process that dominates at frequency ν > 100 GHz and a slow process that dominates at lower frequencies. The slow process has a strongly stretched high-frequency tail that can be approximated by a power law, χ″(Q,ν) ∝ ν−b, with a small exponent b ∼ 0.2 (Fig. 8). The tails of the slow process disappear (or become negligible) at hydration levels <0.2 h.
FIGURE 8.
Neutron scattering susceptibility, χ″TOF(ν) (symbols), and light-scattering susceptibility, χ″LS(ν) (solid lines), of samples at different hydrations (neutron-scattering measurements: h ∼0.05 (dry), 0.18, 0.30, 0.50, and 0.80; light-scattering measurements: h ∼0.03 (dry), 0.20, 0.35, 0.50, and 0.85) at T = 295 K. The dashed lines show the slope of high-frequency tail of slow relaxation process (χ″(ν) ∝ ν −0.2) and the slope of low-frequency tail of the fast relaxation process (χ″(ν) ∝ ν0.55).
Analysis of the width of the low-frequency QES spectrum of hydrated lysozyme reveals no particular Q-dependence in the Q-range studied, 0.5 Å−1 < Q < 1.75 Å−1. The slow process that is activated at higher hydration levels had an average Γ ∼ 2.5–3 GHz (τ ∼ 50 ps) at T = 295 K, independent of Q. This observation strongly differentiates the slow process in proteins from the slow process (the main structural α-relaxation) in glass-forming systems. The characteristic τα in glass-forming liquids has a strong Q-dependence (69), indicating an underlying diffusion-like process. A Q-independent τ for the slow process in lysozyme suggests that this process is localized at a distance smaller than r < 2π/Qmax ∼ 3.5 Å.
The slow process seen in combined neutron-scattering susceptibility spectra (Fig. 9 A) shows a broad relaxation maximum with νmax ∼ 2–6 GHz (consistent with our estimate of the average Γ), corresponding to τ ∼ 30–80 ps. An increase in hydration level seems to increase the amplitude of the process rather than to change νmax. An extremely strong stretching (the exponent b ∼ 0.2 (Fig. 9)) seems to be a general property of the slow relaxation process in biological macromolecules. The strongly stretching exponent has been estimated for myoglobin (b ∼ 0.25) (8) and for DNA (b ∼ 0.3) (20). This type of spectrum corresponds to either a very complex relaxation process or to an extremely broad distribution of relaxation times. It is obvious that the fit of these spectra by a single Lorentzian will not provide reliable results. As an example, the spectra of hydrated lysozyme measured with a resolution of 80–140 μeV (20–34 GHz) have previously been fit using a single Lorentzian function (7). The authors estimated the Lorentzian width to be Γ ∼ 70–150 μeV (∼17–35 GHz), which differs from our estimates by a factor of 5–10 and, most probably, is limited by the resolution of the spectrometer employed. Our data (Figs. 8 and 9 A) do not show a relaxation maximum in the frequency range 15–40 GHz. Thus, the results obtained with the single Lorentzian fit should be considered with particular care (this question has been discussed previously by Fitter et al. (9,21)).
FIGURE 9.
(A) Neutron-scattering susceptibility, χ″HFBS(ν) and χ"TOF(ν) of (h ∼ 0.05 (dry), 0.30, and 0.80) at T = 295 K in a broad frequency range. (B) Neutron- (□) and light-scattering (thin solid line) susceptibility spectra of dry samples (h ∼ 0.05 and 0.03) at T = 295 K. The thick solid line shows the fit of the low-frequency spectrum using Eq. 3 (Fig. 6); the dashed line shows estimated methyl-group contribution. High-frequency neutron-scattering spectrum (▵) after correction for the methyl-group contribution agrees well with the light-scattering spectrum.
The neutron- and light-scattering spectra differ significantly at low hydration levels (Fig. 8). It is known that methyl-group rotation does not contribute to the light-scattering spectra (see, e.g., Soles et al. (70)). We can estimate the contribution of methyl-group dynamics to the high-frequency neutron-scattering spectra using results from the previous section and our previous work (38). Fig. 9 B shows the combined low- and high- frequency spectra of dry lysozyme. The dashed line marks the contribution from methyl groups that is estimated at lower frequency and extrapolated to higher frequency using the distribution g(Ei) obtained as described above (see also our previous work (38)). The high-frequency neutron scattering spectrum after subtraction of this contribution becomes similar to the light-scattering spectrum (Fig. 9 B). These results further confirm that methyl-group rotational dynamics contribute significantly to the neutron-scattering spectra of proteins. This contribution is especially important in the dry state, where the slow process is suppressed.
It is difficult to analyze the spectral shape of the fast process because it overlaps both with the slow process and methyl-group dynamics at lower frequencies and with the boson peak vibrations at higher frequency. The contribution of the slow process is negligible in the case of the dry protein and we can analyze the spectral shape of the low-frequency tail of the fast process from the light-scattering data (Fig. 8), where the contribution of methyl-group dynamics is also negligible. The low-frequency tail of the susceptibility spectra is well described by a power law χ″(ν) ∝ ν0.55. This is far from the expected linear dependence, χ″(ν) ∝ ν, for a single Lorentzian and suggests either a highly stretched process or a broad distribution of relaxation times in the sample. Analysis of the spectra also suggest that the relaxation maximum of the fast process should be at a frequency >∼100 GHz, i.e., τ should be ∼1 ps or shorter. Similar relaxation times and spectral shapes (stretched low-frequency tail) are also characteristics of fast relaxation in glass-forming and polymeric systems (71,72). It is usually interpreted as a “rattling” of molecular units in a cage formed by their neighbors (8,60). We speculate that the fast conformational fluctuations in proteins might be also related to a “rattling” of atoms of a particular residue in a cage formed by neighboring residues and water molecules.
Thus, the relaxation spectra of lysozyme have at least three major contributions in the frequency range studied: a slow process that appears in our frequency window only at hydration levels h > 0.2 (Figs. 8 and 9) and at T > TD (20,35,38); hydration-independent methyl-group rotational dynamics that are activated at T > 100 K and are not detectable in light-scattering spectra; and, finally, hydration-dependent fast processes (Fig. 8). All three processes are strongly stretched (Figs. 8 and 9).
Influence of hydration on lysozyme dynamics
An increase in the hydration level strongly increases the QES intensity of lysozyme. However, the change in relaxation behavior upon hydration appears to be different at low and high frequency. A steplike increase in QES intensity is observed between h ∼ 0.2 and h ∼ 0.5 for the slow dynamics (38), whereas a monotonic increase of the QES intensity with h is observed at high frequency (Figs. 4 and 8). The temperature dependence of 〈r2〉 shown in Fig. 2, indicates that an additional relaxation process enters the studied frequency window at T above TD ∼ 220 K, but only at hydration levels >0.2 h (Fig. 2). This is consistent with an increase in the QES intensity at low frequency that also appears only at h > 0.2 (38). Thus, the sharp change in 〈r2〉 is associated with the slow relaxation process that enters the accessible frequency window at T ∼ 200–220 K. This conclusion agrees with earlier observations for myoglobin (8) and DNA (20) and the results of light scattering in lysozyme (35).
Analysis of the EISF(Q) of the slow relaxation process can provide information on the type of the relevant motions. It is obvious from the previous section that the EISF(Q) of the hydrated sample has at least three components: 1), the slow process; 2), methyl-group rotational dynamics; and 3), the fast process. The fast process has a negligible contribution at lower frequency (ν < 10 GHz (∼50 μeV)). Thus only the first two components make a significant contribution to the low-frequency neutron-scattering spectra. Assuming that the contribution from methyl-group hydrogen atoms and the slow relaxation process are additive, we can write the EISF(Q) as
 |
(6) |
According to our previous analysis, the contribution from methyl-group hydrogen atoms dominates the spectrum of the dry sample (38). So, as a rough approximation we can rewrite Eq. 4 as
 |
(7) |
Combining Eqs. 6 and 7 provides an expression that can be used to estimate the EISF(Q) of the slow relaxation process:
 |
(8) |
This is a crude approximation, but it might be appropriate for a qualitative model-independent analysis of our experimental data. As we discussed in the first section of the Discussion, traditional calculations of EISF(Q) from the measured QES spectra usually assume a single Lorentzian function. This approximation does not provide an accurate estimate of the relaxation times, nor does it provide a correct representation of the mobile fraction of hydrogen atoms involved in the relevant process (for example, see our estimates of pmethyl given in the first section of the Discussion). Due to the poor statistics of our neutron-scattering spectra, a fit of the QES spectra measured at each Q without prior knowledge of the shape of the relaxation spectrum is not reliable. Thus, in many cases, an approximation by a single Lorentzian might be the only choice for qualitative analysis of EISF(Q). Thus, we use the single Lorentzian approximation for a qualitative analysis of geometry of the slow process and its variation with hydration level. As a first step, we fit the spectra of the dry sample to obtain EISFdry(Q), and then we fit the spectra of hydrated samples to obtain EISFhydrated(Q). EISFhydrated,slow(Q) is calculated at different hydration levels using Eq. 8.
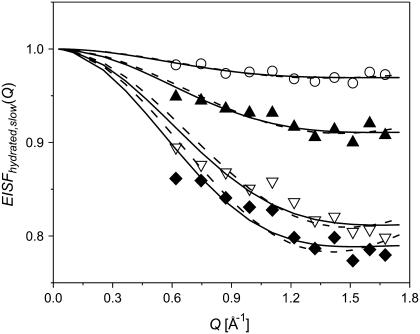
The resulting EISFhydrated,slow(Q) (Fig. 10) at different hydration levels have been fit to the two-site jump model (39)
 |
(9) |
to a three-site jump model (Eq. 4), as well as to a model describing freely diffusive motions in a sphere (73):
 |
(10) |
FIGURE 10.
EISFhydrated,slow(Q) of hydrated samples (for definition, see text, Eq. 8) at h ∼ 0.18 (○); 0.30 (▴); 0.50 (∇); 0.80 (♦) at T = 295 K. The dashed lines present fit to the two-site (Eq. 9) and three-site (Eq. 4) jump models (fits are indistinguishable at this Q-range) and the solid lines present fits to freely diffusive motions in a sphere model (Eq. 10).
Here pslow is the mobile fraction of hydrogen atoms involved in the slow relaxation process in our experimental timescale of ∼20 ps to 1 ns, d is a jump distance and a is the radius of the sphere in which the hydrogen atoms move. The results for two- and three-site jump models are indistinguishable over our limited Q-range and it seems that the diffusion in a sphere model provides a slightly better fit of the data at higher Q (Fig. 10). We note, however, that the Q-range studied is not sufficient to identify which model best describes the slow relaxation process.
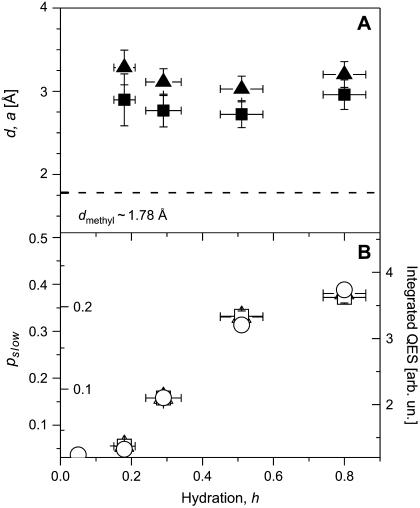
The dependence of the fit parameters on hydration is presented in Fig. 11. It appears that both jump distance d and the sphere radius a, have a value of ∼3 Å (Fig. 11 A), i.e., they differ significantly from the jump distance characteristic of methyl-group hydrogens, Rmethyl  ∼ 1.78 Å (59,61). The estimated value agrees with our earlier estimate based on the Q-independence of the characteristic τ of the slow relaxation process. The characteristic lengthscale of the slow relaxation process appears to be essentially independent of hydration level. The mobile fraction of the hydrogen atoms involved in the slow process, pslow, shows a particular dependence on hydration: it remains low at h < 0.2, it increases strongly between h ∼ 0.2 and h ∼ 0.5 and then increases slightly at h > 0.5 (Fig. 11 B). The results suggest that an increase in hydration leads to an increase in the number of flexible regions rather than to an increase in the amplitude of the particular motion. This conclusion is independent of the model used to fit the EISF(Q) data. Moreover, the variation of pslow with hydration essentially reflects the variations of the model-independent parameter, the integrated QES intensity (Fig. 11 B). It is important to note that the values of pslow do not reflect the actual number of hydrogen atoms involved in the slow relaxation process. It is a significant underestimate of the number of hydrogen atoms because of the use of the single Lorentzian approximation in the calculations of EISFslow(Q) for the strongly stretched process (Fig. 9). This is similar to the results of our analysis of the methyl-group dynamics (Fig. 6 and first section of Discussion). We emphasize that the analysis of the same data without correction for methyl-group rotational dynamics (Eq. 8) will result in a smooth increase in the lengthscale of the motion with an increase in hydration level. Thus, the correction for the methyl-group dynamics is crucial in the analysis of neutron-scattering spectra of proteins.
FIGURE 11.
(A) Amplitude of motions (jump distance d and radius of sphere a) involved in slow relaxation process at different hydration levels obtained from the fit to two-site jump model (▴) and to freely diffusive motions in a sphere model (▪). The dashed line shows the jump distance expected for methyl groups. (B) Variation of mobile fraction of hydrogen atoms involved in the slow relaxation process, Pslow, with hydration obtained from the fit to two-site jump model (▴, outside labels) and to freely diffusive motions in a sphere model (□, inside labels). QES intensity integrated in the frequency range from 2 to 8 GHz (○) is presented for a comparison.
Now we turn to the analysis of the fast process and its dependence on hydration. We don't expect that the analysis of EISF(Q) of the fast process can provide any reliable information. Its spectral shape is not known and cannot be modeled as a single Lorentzian function. Moreover, it overlaps with both the methyl-group dynamics and the slow relaxation process at low frequency and with the boson peak vibrations at high frequency. Therefore, it is difficult to obtain microscopic information on the fast process from the experimental data. Because of these limitations we decided to restrict our analysis to variations of the integrated intensity of the fast process with hydration. We start analyzing the light-scattering spectra because there is no contribution from methyl-group dynamics. To analyze the relaxation spectra at higher hydration levels, the light-scattering susceptibility spectra in the frequency range of interest can be represented by a sum of two contributions:
 |
(11) |
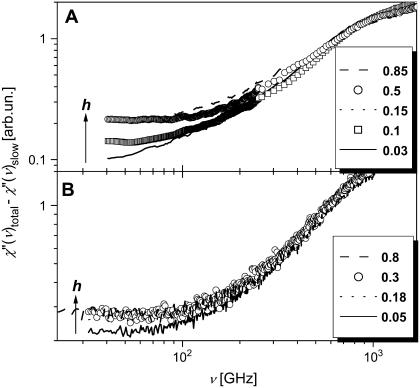
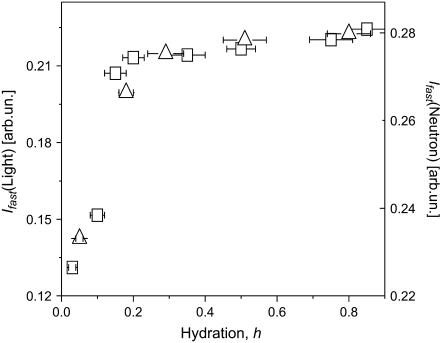
Here, the high-frequency tail of the slow relaxation process was approximated using a power law with an intensity proportional to the mobile fraction of atoms involved in the slow relaxation process. The constant, C, is assumed to be independent of hydration. To estimate the fast process, we subtracted the contribution of the slow relaxation process from the light-scattering spectra (Fig.12 A). The resulting spectra of the fast process show a strong increase in intensity with hydration at low h and no significant dependence on hydration at h > 0.15. Fig. 13 shows the hydration dependence of the fast process intensity integrated over the frequency range 50–100 GHz.
FIGURE 12.
High-frequency χ″(ν), corrected for the contribution of the slow relaxation process at T = 295 K. (A) Light-scattering and (B) neutron-scattering measurements.
FIGURE 13.
Light (□) and neutron (▵) QES intensity corrected for the slow relaxation process and integrated in the frequency range from 50 to 100 GHz as a function of hydration. It reflects essentially the dependence of the fast relaxation process on hydration.
A similar approximation has been used to correct for the contribution of the slow process to the high-frequency neutron scattering spectra (Fig. 12 B). However, the remaining spectra in this case include the fast process and a contribution from methyl-group hydrogen atoms. Assuming that the contribution from methyl-group dynamics does not vary much with hydration, we can estimate the variations of the fast process with hydration from the high-frequency neutron-scattering spectra corrected for the slow relaxation process (Fig. 12 B). Both, light- and neutron-scattering data show a similar hydration dependence of the fast process: It increases sharply at h < 0.2 and varies more slowly at higher hydration levels (Fig. 13). This differs significantly from the hydration dependence of the slow relaxation process and suggests that the fast conformational fluctuations in the picosecond time range are active already in the dry state and become stronger with an increase of hydration; even much below a monolayer coverage, h ∼ 0.38 (5). So, it seems that the fast process varies strongly with hydration level during formation of the surface water H-bonded network (reached at h ∼ 0.15) and is less sensitive to water that condenses on weakly interacting patches of the protein surface (starts at h ∼ 0.25) (5). It does not change much at h > 0.2, where the contribution of the slow relaxation process starts to increase sharply (Fig. 11 B).
Correlations between protein dynamics and enzymatic activity
The influence of hydration on enzymatic activity of lysozyme has been presented in Rupley and Careri (5,75). A solution of lysozyme was prepared with equimolar amounts of the hexasaccharide of N-acetylglucosamine at pH values between 8 and 9 to minimize catalysis during preparation. The solutions were lyophilized to give the dry enzyme-substrate complex, which was subsequently rehydrated to the required hydration levels, and catalytic activity has been measured as a function of hydration level.
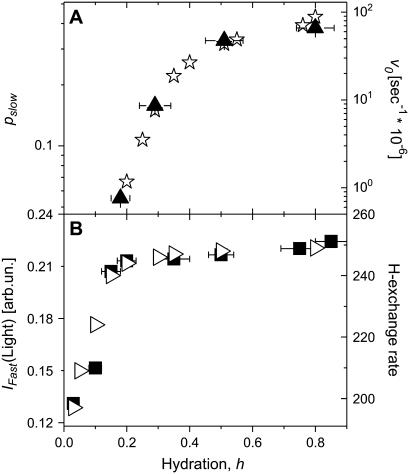
The observed hydration dependence of the slow relaxation process (mobile fraction of hydrogen atoms pslow) correlates well with the hydration dependence of catalytic activity (Fig. 14 A): 1), the mobile fraction remains very small up to h ∼ 0.18; 2), it increases strongly between h ∼ 0.18 and h ∼ 0.50; and 3), a further weak increase is observed above h ∼ 0.50. These results suggest that the slow relaxation process includes motions important for enzymatic activity of lysozyme. Recent studies of pig liver esterase indicated the presence of enzymatic activity even in dehydrated protein (75) and the authors of (68) suggested that the hydration-induced anharmonic motions (the slow process in our case) are not required for activity of this enzyme. Thus, it is possible that the importance of the slow process for enzymatic activity varies for different proteins.
FIGURE 14.
(A) Parallel comparison of hydration dependences of the mobile fraction of hydrogen atoms involved in the slow relaxation process (▴) and enzymatic reaction rate, v0, of the lysozyme to hexasaccharide of N-acetylglucosamine ((GlcNAc)6) (⋆) as estimated by Rupley and colleagues (5,74). (B) Parallel comparison of hydration dependences of the integrated QES intensity of the fast process (▪) and hydrogen exchange rate (▹) in units of moles of exchanged H atoms/1 mol of lysozyme/24 h as estimated in Schinkel et al. (36). (T = 295 K).
The microscopic mechanism of this slow process remains unclear. Tournier and Smith (25) identified a mode involving the rigid body motion of two groups of helices that activates above the dynamic transition in hydrated myoglobin. A hinge-bending motion is a well-known mode in lysozyme (67). These types of rigid-body motions, involving correlated motions of secondary structures, are consistent with the estimated lengthscale of the motion and the significant number of hydrogen atoms observed in the slow process. A more detailed analysis of our simulation results, to elucidate the nature of the slow relaxation process in hydrated proteins, is forthcoming.
The fast process and enzymatic activity have different dependencies on hydration (Fig. 14). The fast process is activated at much lower hydration levels than enzymatic activity and is significant even in the dry protein. It is interesting to note that the dependence of fast conformational fluctuations on hydration level is similar to the hydration dependence of hydrogen exchange (Fig. 14 B). It is possible that the increase in flexibility promoted in the onset of hydrogen isotope exchange is associated with activation of the fast conformational fluctuations. Based on our analysis, we speculate that the fast process is not directly related to enzymatic activity but might be an important precursor for the slow relaxation process.
The following scenario emerges. There are two significant anharmonic contributions to the dynamics of dry protein: methyl-group rotational dynamics and fast picosecond conformational fluctuations. Initially, the slow relaxation process is strongly suppressed and the protein is rather rigid. With an increase in hydration up to h ∼ 0.2 the contribution of the fast process to protein dynamics increases sharply, whereas the slow relaxation process remains suppressed. When the fast process (rattling of residues in cages formed by their neighbors) reaches a particular level at h ∼0.2, it creates a level of protein flexibility sufficient to activate the slow relaxation process. The slow relaxation process then increases sharply with h > 0.2. In other words, fast conformational fluctuations are a necessary precursor for the motions of secondary structures. The latter become active on our pico- and nanosecond timescale only when the fast fluctuations reach a particular level. When the motion of secondary structures (the slow relaxation process) is activated, lysozyme can become catalytically active.
CONCLUSION
We have presented a detailed analysis of the influence of hydration on picosecond to nanosecond dynamics of lysozyme. The neutron-scattering measurements and simulations for dry and hydrated lysozyme clearly show the existence of two onsets of anharmonicity in the 〈r2〉 of nonexchangeable hydrogen atoms on this timescale: 1), the low-temperature onset that is observed in all samples regardless of their hydration level and is primarily ascribed to methyl-group rotation; and 2), the well-known dynamical transition at T ∼ 200–220 K that is observed only in samples at hydration >∼0.2 h. Our results suggest that an analysis of incoherent neutron-scattering spectra of proteins should explicitly include methyl-group dynamics because of their significant contribution to QES spectra. Moreover, it might also be useful for the analysis of results of MD simulations to exclude the contribution from methyl groups. Our recent analyses of MD simulations results for lysozyme encased in glycerol or trehalose (76,77) demonstrated that removing the contribution of methyl group hydrogen atoms in the calculation of the intermediate scattering function of lysozyme can provide microscopic insight that would otherwise be missed.
In addition to methyl-group dynamics, two other relaxation processes have been identified: 1), fast conformational fluctuations and 2), a slow relaxation process with larger-scale motions, but still localized to ∼3 Å. They have a different dependence on hydration: methyl-group dynamics seem to be rather insensitive to h, the fast fluctuations increase rapidly at h < 0.2 and then increase only slightly with further increase in h, whereas the slow relaxation process does not activate until h ∼ 0.2, then increases sharply between h ∼ 0.2 and h ∼ 0.5 and only slightly at h > 0.5. Therefore, we speculate that the effect of an increase in hydration level is to first increase the fast conformational fluctuations and then, at h ∼ 0.2, the hydration water activates the slower relaxation process.
It is important to emphasize that the observed results, namely active methyl-group dynamics and fast process, differ from the usual view of protein dynamics. The dynamics of dry protein includes significant anharmonic contributions, and also the dynamics of wet proteins is not completely harmonic below TD. The latter conclusion agrees with the recent analysis of MD simulations (55) and experimental studies presented in (68). The most important observation is the correlation between the slow relaxation process and enzymatic activity, suggesting that the activation of the slow relaxation process might be necessary for lysozyme function. A microscopic mechanism of the slow relaxation process remains unclear, but it might be related to motions of secondary structures.
Acknowledgments
We thank Yifu Ding and the National Institute of Standards and Technology Center for Neutron Research for assistance with neutron-scattering measurements, and Dan Neumann and John Copley for helpful discussions.
This work was supported by the National Science Foundation, Polymer program (DMR-0315388), and utilized facilities supported in part by the National Science Foundation under Agreement No. DMR-0086210. J.E.C. acknowledges the support of the National Research Council.
References
- 1.Daniel, R. M., R. V. Dunn, J. L. Finney, and J. C. Smith. 2003. The role of dynamics in enzyme activity. Annu. Rev. Biophys. Biomol. Struct. 32:69–92. [DOI] [PubMed] [Google Scholar]
- 2.Gabel, F., D. Bicout, U. Lehnert, M. Tehei, M. Weik, and G. Zaccai. 2002. Protein dynamics studied by neutron scattering. Q. Rev. Biophys. 35:327–367. [DOI] [PubMed] [Google Scholar]
- 3.Doster, W., and M. Settles. 1998. The dynamical transition in proteins: the role of hydrogen bonds. In Workshop on Hydration Processes in Biology: Theoretical and Experimental Approaches. M. C. Bellissent-Funel, editor. IOS Press, Les Houches, France. 177–191.
- 4.Gregory, R. B., M. Gangoda, R. K. Gilpin, and W. Su. 1993. The influence of hydration on the conformation of lysozyme studied by solid-state 13C-NMR spectroscopy. Biopolymers. 33:513–519. [DOI] [PubMed] [Google Scholar]
- 5.Rupley, J. A., and G. Careri. 1991. Protein hydration and function. Adv. Protein Chem. 41:37–172. [DOI] [PubMed] [Google Scholar]
- 6.Parak, F. G. 2003. Physical aspects of protein dynamics. Rep. Prog. Phys. 66:103–129. [Google Scholar]
- 7.Perez, J., J. M. Zanotti, and D. Durand. 1999. Evolution of the internal dynamics of two globular proteins from dry powder to solution. Biophys. J. 77:454–469. [DOI] [PMC free article] [PubMed] [Google Scholar]
- 8.Doster, W., S. Cusack, and W. Petry. 1989. Dynamical transition of myoglobin revealed by inelastic neutron scattering. Nature. 337:754–756. [DOI] [PubMed] [Google Scholar]
- 9.Fitter, J., R. E. Lechner, and N. A. Dencher. 1997. Picosecond molecular motions in bacteriorhodopsin from neutron scattering. Biophys. J. 73:2126–2137. [DOI] [PMC free article] [PubMed] [Google Scholar]
- 10.Diehl, M., W. Doster, W. Petry, and H. Schober. 1997. Water-coupled low-frequency modes of myoglobin and lysozyme observed by inelastic neutron scattering. Biophys. J. 73:2726–2732. [DOI] [PMC free article] [PubMed] [Google Scholar]
- 11.Tsai, A. M., D. A. Neumann, and L. N. Bell. 2000. Molecular dynamics of solid-state lysozyme as affected by glycerol and water: a neutron scattering study. Biophys. J. 79:2728–2732. [DOI] [PMC free article] [PubMed] [Google Scholar]
- 12.Caliskan, G., A. Kisliuk, A. Tsai, C. Soles, and A. P. Sokolov. 2003. Protein dynamics in viscous solvents. J. Chem. Phys. 118:4230–4236. [Google Scholar]
- 13.Zanotti, J. M., M. C. Bellissent-Funel, and J. Parello. 1997. Dynamics of a globular protein studied by neutron scattering and solid-state NMR. Physica B (Amsterdam). 234–236:228–230. [Google Scholar]
- 14.Rasmussen, B. F., A. M. Stock, D. Ringe, and G. A. Petsko. 1992. Crystalline ribonuclease A losese function below the dynamical transition at 200 K. Nature. 357:423–424. [DOI] [PubMed] [Google Scholar]
- 15.Paciaroni, A., S. Cinelli, and G. Onori. 2002. Effect of the environment on the protein dynamical transition: a neutron scattering study. Biophys. J. 83:1157–1164. [DOI] [PMC free article] [PubMed] [Google Scholar]
- 16.Ansari, A., E. E. Di Iorio, D. D. Dlott, H. Frauenfelder, I. E. T. Iben, P. Langer, H. Roder, T. B. Sauke, and E. Shyamsunder. 1986. Ligand binding to heme proteins: relevance of low-temperature data. Biochemistry. 25:3139–3146. [DOI] [PubMed] [Google Scholar]
- 17.Parak, F., and E. W. Knapp. 1984. A consistent picture of protein dynamics. Proc. Natl. Acad. Sci. USA. 81:7088–7092. [DOI] [PMC free article] [PubMed] [Google Scholar]
- 18.Ferrand, M., A. J. Dianoux, W. Petry, and G. Zaccai. 1993. Thermal motions and function of bacteriorhodopsin in purple membrane: effects of temperature and hydration studied by neutron scattering. Proc. Natl. Acad. Sci. USA. 90:9668–9672. [DOI] [PMC free article] [PubMed] [Google Scholar]
- 19.Ostermann, A., R. Waschipky, F. G. Parak, and G. U. Nienhaus. 2000. Ligand binding and conformational motions in myoglobin. Nature. 404:205–208. [DOI] [PubMed] [Google Scholar]
- 20.Sokolov, A. P., H. Grimm, A. Kisliuk, and A. J. Dianoux. 2001. Slow relaxation process in DNA. J. Biol. Phys. 27:313–327. [DOI] [PMC free article] [PubMed] [Google Scholar]
- 21.Fitter, J. 1999. The temperature dependence of internal molecular motions in hydrated and dry α-amylase: the role of hydration water in the dynamical transition of proteins. Biophys. J. 76:1034–1042. [DOI] [PMC free article] [PubMed] [Google Scholar]
- 22.Caliskan, G., R. M. Briber, D. Thirumalai, V. Garcia-Sakai, S. A. Woodson, and A. P. Sokolov. 2006. Dynamic transition in tRNA is solvent induced. J. Am. Chem. Soc. 128:32–33. [DOI] [PubMed] [Google Scholar]
- 23.Frauenfelder, H., and B. McMahon. 1998. Dynamics and function of proteins: the search for general concepts. Proc. Natl. Acad. Sci. USA. 95:4795–4797. [DOI] [PMC free article] [PubMed] [Google Scholar]
- 24.Tournier, A. L., J. Xu, and J. C. Smith. 2003. Translational hydration water dynamics drives the protein glass transition. Biophys. J. 85:1871–1875. [DOI] [PMC free article] [PubMed] [Google Scholar]
- 25.Tournier, A. L., and J. C. Smith. 2003. Principal components of the protein dynamical transition. Phys. Rev. Lett. 91:208106. [DOI] [PubMed] [Google Scholar]
- 26.Daniel, R. M., J. C. Smith, M. Ferrand, S. Héry, R. Dunn, and J. L. Finney. 1998. Enzyme activity below the dynamical transition at 220 K. Biophys. J. 75:2504–2507. [DOI] [PMC free article] [PubMed] [Google Scholar]
- 27.Dunn, R. V., V. Réat, J. Finney, M. Ferrand, J. C. Smith, and R. M. Daniel. 2000. Enzyme activity and dynamics: xylanase activity in the absence of fast anharmonic dynamics. Biochem. J. 346:355–358. [PMC free article] [PubMed] [Google Scholar]
- 28.Bragger, J. M., R. V. Dunn, and R. M. Daniel. 2000. Enzyme activity down to −100°C. Biochim. Biophys. Acta. 1480:278–282. [DOI] [PubMed] [Google Scholar]
- 29.Tarek, M., and D. J. Tobias. 2002. Role of protein-water hydrogen bond dynamics in the protein dynamical transition. Phys. Rev. Lett. 88:138101. [DOI] [PubMed] [Google Scholar]
- 30.Zaccai, G. 2000. How soft is a protein? A protein dynamics force constant measured by neutron scattering. Science. 288:1604–1607. [DOI] [PubMed] [Google Scholar]
- 31.Gregory, R. B. 1998. The Role of Water in Foods. Chapman-Hall, New York.:57–99.
- 32.Kneller, G. R., and J. C. Smith. 1994. Liquid-like side-chain dynamics in myoglobin. J. Mol. Biol. 242:181–185. [DOI] [PubMed] [Google Scholar]
- 33.Gregory, R. B., and R. W. Lumry. 1985. Hydrogen-exchange evidence for distinct structural classes in globular proteins. Biopolymers. 24:301–326. [DOI] [PubMed] [Google Scholar]
- 34.Zhou, Y., D. Vitkup, and M. J. Karplus. 1999. Native proteins are surface-molten solids: application of the Lindemann criterion for the solid versus liquid state. J. Mol. Biol. 285:1371–1375. [DOI] [PubMed] [Google Scholar]
- 35.Caliskan, G., A. Kisliuk, and A. P. Sokolov. 2002. Dynamic transition in lysozyme: role of a solvent. J. Non-Cryst. Sol. 307–310:868–873. [Google Scholar]
- 36.Schinkel, J. E., N. W. Downer, and J. A. Rupley. 1984. Hydrogen exchange of lysozyme powders. Hydration dependence of internal motions. Biochemistry. 24:352–366. [DOI] [PubMed] [Google Scholar]
- 37.Kocherbitov, V., T. Arnebrant, and O. Söderman. 2004. Lysozyme-water interactions studied by sorption calorimetry. J. Phys. Chem. B. 108:19036–19042. [Google Scholar]
- 38.Roh, J. H., V. N. Novikov, R. B. Gregory, J. E. Curtis, Z. Chowdhuri, and A. P. Sokolov. 2005. Onsets of anharmonicity in protein dynamics. Phys. Rev. Lett. 95:038101. [DOI] [PubMed] [Google Scholar]
- 39.Bée, M. 1988. Quasielastic Neutron Scattering. Adam Hilger, Philadelphia.
- 40.NIST. 2005. http://www.ncnr.nist.gov/dave
- 41.Diamond, R. 1974. Real-space refinement of the structure of hen egg-white lysozyme. J. Mol. Biol. 82:371–391. [DOI] [PubMed] [Google Scholar]
- 42.Stillinger, F. H., and A. Rahman. 1974. Improved simulation of liquid water by molecular dynamics. J. Chem. Phys. 60:1545–1557. [Google Scholar]
- 43.MacKerell, A. D., Jr., D. Bashford, M. Bellott, R. L. Dunbrack, Jr., J. M. Evanseck, M. J. Field, S. Fischer, J. Gao, H. Guo, S. Ha, D. Joseph-McCarthy, L. Kuchnir, K. Kuczera, F. T. K. Lau, C. Mattos, S. Michnick, T. Ngo, D. T. Nguyen, B. Prodhom, W. E. Reiher III, B. Roux, M. Schlenkrich, J. C. Smith, R. Stote, J. Straub, M. Watanabe, J. Wiorkiewicz-Kuczera, D. Yin, and M. Karplus. 1998. All-atom empirical potential for molecular modeling and dynamics studies of proteins. J. Phys. Chem. B. 102:3586–3616. [DOI] [PubMed] [Google Scholar]
- 44.Phillips, J. C., R. Braun, W. Wang, J. Gumbart, E. Tajkhorshid, E. Villa, C. Chipot, R. D. Skeel, L. Kale, and K. Schulten. 2005. Scalable molecular dynamics with NAMD. J. Comput. Chem. 26:1781–1802. [DOI] [PMC free article] [PubMed] [Google Scholar]
- 45.Lipari, G., and A. Szabo. 1982. Model-free approach to the interpretation of nuclear magnetic resonance relaxation in macromolecules. 1. Theory and range of validity. J. Am. Chem. Soc. 104:4546–4559. [Google Scholar]
- 46.Tarek, M., G. J. Martyna, and D. J. Tobias. 2000. Amplitudes and frequencies of protein dynamics: analysis of discrepancies between neutron scattering and molecular dynamics simulations. J. Am. Chem. Soc. 122:10450–10451. [Google Scholar]
- 47.Réat, V., R. Dunn, M. Ferrand, J. L. Finney, R. M. Daniel, and J. C. Smith. 2000. Solvent dependence of dynamic transitions in protein solutions. Proc. Natl. Acad. Sci. USA. 97:9961–9966. [DOI] [PMC free article] [PubMed] [Google Scholar]
- 48.Réat, V., H. Patzelt, M. Ferrand, C. Pfister, D. Oesterhelt, and G. Zaccai. 1998. Dynamics of different functional parts of bacteriorhodopsin: H-2H labeling and neutron scattering. Proc. Natl. Acad. Sci. USA. 95:4970–4975. [DOI] [PMC free article] [PubMed] [Google Scholar]
- 49.Lehnert, U., V. Réat, M. Weik, G. Zaccai, and C. Pfister. 1998. Thermal motions in bacteriorhodopsin at different hydration levels studied by neutron scattering: correlation with kinetics and light-induced conformational changes. Biophys. J. 75:1945–1952. [DOI] [PMC free article] [PubMed] [Google Scholar]
- 50.Bicout, D. J., and G. Zaccai. 2001. Protein flexibility from dynamical transition: a force constant analysis. Biophys. J. 80:1115–1123. [DOI] [PMC free article] [PubMed] [Google Scholar]
- 51.Doster, W., S. Cusack, and W. Petry. 1990. Dynamic instability of liquidlike motions in a globular protein observed by inelastic neutron scattering. Phys. Rev. Lett. 65:1080–1084. [DOI] [PubMed] [Google Scholar]
- 52.Sokolov, A. P., H. Grimm, and R. Kahn. 1999. Glassy dynamics in DNA: ruled by water of hydration? J. Chem. Phys. 110:7053–7057. [Google Scholar]
- 53.Veronique, R., P. Calmettes, J. C. Smith, M. Desmadril, G. Goddens, and D. Durand. 1997. Picosecond dynamical changes on denaturation of yeast phosphoglycerate kinase revealed by quasielastic neutron scattering. Proteins. 28:380–387. [PubMed] [Google Scholar]
- 54.Cordone, L., M. Ferrand, E. Vitrano, and G. Zaccai. 1999. Harmonic behavior of trehalose-coated carbon-monoxy-myoglobin at high temperature. Biophys. J. 76:1043–1047. [DOI] [PMC free article] [PubMed] [Google Scholar]
- 55.Hayward, J. A., and J. C. Smith. 2002. Temperature dependence of protein dynamics: computer simulation analysis of neutron scattering properties. Biophys. J. 82:1216–1225. [DOI] [PMC free article] [PubMed] [Google Scholar]
- 56.Andrew, E. R., D. J. Bryant, and E. M. Cashell. 1980. Proton magnetic relaxation of proteins in the solid state: molecular dynamics of ribonuclease. Chem. Phys. Lett. 69:551–554. [Google Scholar]
- 57.Keniry, M. A., A. Kintanar, R. L. Smith, H. S. Gutowsky, and E. Oldfield. 1984. Nuclear magnetic resonance studies of amino acids and proteins. Deuterium nuclear magnetic resonance relaxation of deuteriomethyl-labeled amino acids in crystals and in halobacterium halobium and Escherichia coli cell membranes. Biochemistry. 23:288–298. [DOI] [PubMed] [Google Scholar]
- 58.Krushelnitsky, A. G., V. D. Fedotov, J. Spevacek, and J. Straka. 1996. Dynamics structure of proteins in solid state. 1H and 13C NMR relaxation study. J. Biomol. Struct. Dyn. 14:211–224. [DOI] [PubMed] [Google Scholar]
- 59.Fitter, J., R. E. Lechner, G. Büldt, and N. A. Dencher. 1996. Internal molecular motions of bacteriorhodopsin: hydration-induced flexibility studied by quasielastic incoherent neutron scattering using oriented purple membranes. Proc. Natl. Acad. Sci. USA. 93:7600–7605. [DOI] [PMC free article] [PubMed] [Google Scholar]
- 60.Doster, W., and M. Settles. 2005. Protein-water displacement distributions. Biochim. Biophys. Acta 1749:173–186. [DOI] [PubMed] [Google Scholar]
- 61.Reference deleted in proof.
- 62.Frick, B., and L. J. Fetters. 1994. Methyl group dynamics in glassy polyisoprene: a neutron backscattering investigation. Macromolecules. 27:974–980. [Google Scholar]
- 63.Andrew, E. R., W. S. Hinshaw, M. G. Hutchins, and R. O. I. Sjöblom. 1976. Proton magnetic relaxation and molecular motion in polycrystalline amino acids I. Aspartic acid, cystine, glycine, histidine, serine, tryptophan and tyrosine. Mol. Phys. 31:1479–1488. [Google Scholar]
- 64.Andrew, E. R., W. S. Hinshaw, M. G. Hutchins, R. O. I. Sjöblom, and P. C. Canepa. 1976. Proton magnetic relaxation and molecular motion in polycrystalline amino acids II. Alanine, isoleucine, leucine, methionine, norleucine, threonine and valine. Mol. Phys. 32:795–806. [Google Scholar]
- 65.Andrew, E. R., W. S. Hinshaw, M. G. Hutchins, and R. O. I. Sjöblom. 1977. Proton magnetic relaxation and molecular motion in polycrystalline amino acids III. Arginine, asparagines, cysteine, glutamine, phenylalanine and proline. Mol. Phys. 34:1695–1706. [Google Scholar]
- 66.Andrew, E. R., D. N. Bone, D. J. Bryant, E. M. Cashell, R. Gaspar, Jr., and Q. A. Meng. 1982. Proton relaxation studied of dynamics of proteins in the solid state. Pure Appl. Chem. 54:585–594. [Google Scholar]
- 67.Kelly, J. A., A. R. Sielecki, B. D. Sykes, M. N. G. James, and D. C. Phillips. 1979. X-ray crystallography of the binding of the bacterial cell wall trisaccharide NAM-NAG-NAM to lysozyme. Nature. 282:875–878. [DOI] [PubMed] [Google Scholar]
- 68.Brooks, B., and M. Karplus. 1985. Normal modes for specific motions of macromolecules: application to the hinge-bending mode of lysozyme. Proc. Natl. Acad. Sci. USA. 82:4995–4999. [DOI] [PMC free article] [PubMed] [Google Scholar]
- 69.Kurkal, V., R. M. Daniel, J. L. Finney, M. Tehei, R. V. Dunn, and J. C. Smith. 2005. Enzyme activity and flexibility at very low hydration. Biophys. J. 89:1282–1287. [DOI] [PMC free article] [PubMed] [Google Scholar]
- 70.Colmenero, J., A. Arbe, A. Alegría, M. Monkenbusch, and D. Richter. 1999. On the origin of the non-exponential behavior of the α-relaxation in glass-forming polymers: incoherent neutron scattering and dielectric relaxation results. J. Phys. Condens. Matter. 11:A363–A370. [Google Scholar]
- 71.Soles, C., R. M. Dimeo, D. A. Neumann, A. Kisliuk, A. P. Sokolov, J. Liu, A. F. Yee, and W. L. Wu. 2001. Correlations of the boson peak with positron annihilation in series of polycarbonate copolymers. Macromolecules. 34:4082–4088. [Google Scholar]
- 72.Surovtsev, N. V., J. Wiedersich, V. N. Novikov, E. Rössler, and A. P. Sokolov. 1998. Light scattering spectra of the fast relaxation in glasses. Phys. Rev. B. 58:14888–14891. [Google Scholar]
- 73.Caliskan, G., A. Kisliuk, V. N. Novikov, and A. P. Sokolov. 2001. Relaxation spectra in PMMA: comparison of acoustic attenuation and light scattering data. J. Chem. Phys. 114:10189–10195. [Google Scholar]
- 74.Volino, F., and A. J. Dianoux. 1980. Neutron incoherent scattering law for diffusion in a potential of spherical symmetry: general formalism and application to diffusion inside a sphere. Mol. Phys. 41:271–279. [Google Scholar]
- 75.Rupley, J. A., P. H. Yang, and G. Tollin. 1980. Thermodynamic and related studies of water interacting with proteins. In Water in Polymers. ACS Symposium Series, Vol. 127. S. P. Rowland, editor. American. Chemical. Society. Washington, DC. 111–132.
- 76.Lind, P. A., R. M. Daniel, C. Monk, and R. V. Dunn. 2004. Enzyme catalysis of substrate vapor: enzyme activity occurs at very low hydration. Biochim. Biophys. Acta. 1702:103–110. [DOI] [PubMed] [Google Scholar]
- 77.Dirama, T. E., G. A. Carri, and A. P. Sokolov. 2005. Coupling between lysozyme and glycerol dynamics: microscopic insights from molecular dynamics simulations. J. Chem. Phys. 122:244910. [DOI] [PubMed] [Google Scholar]
- 78.Dirama, T. E., J. E. Curtis, G. A. Carri, and A. P. Sokolov. 2006. Coupling between lysozyme and trehalose dynamics: microscopic insights from molecular dynamics simulations. J. Chem. Phys. 124:034901. [DOI] [PubMed] [Google Scholar]


