Abstract
Gfi-1 is a zinc finger transcriptional repressor originally recognized for its role in T cell differentiation and lymphomas. Recent experiments reveal that gene-targeted Gfi-1-deficient mice are neutropenic and that Gfi-1 mutations cause human neutropenia. In both cases, myeloid progenitor cells lose the ability to distinctly differentiate granulocytes from monocytes. The molecular mechanism of the hematopoietic abnormalities caused by Gfi-1 deficiency remains undetermined because of a lack of known Gfi-1 target genes. To identify Gfi-1 targets in vivo, we performed large-scale chromatin immunoprecipitation analysis on a set of 34 candidate genes in myeloblast (KG-1 and HL-60), monoblast (U937), and T lymphocyte cell lines (Jurkat), in concert with RT-PCR-based expression profiling. We identified 32 Gfi-1 binding sites in a functionally variable set of 16 genes, including complements of cell-cycle regulators, transcription factors, and granulocyte-specific markers. Cluster analysis of expression patterns and chromatin immunoprecipitation data reveals that Gfi-1 targets a subset of genes differentiating hematopoietic lineages and therefore plays a relatively superior role in the hierarchy of factors governing stem cell differentiation.
Growth factor independence 1 (Gfi-1) is a cellular protooncogene originally identified by an insertional mutagenesis survey for mouse T cell lymphomas acquiring interleukin 2 (IL-2) growth independence (1). Gfi-1 contains six C2H2 zinc fingers that bind DNA in a sequence-specific fashion (2). It functions as a position- and orientation-independent transcriptional repressor through a unique N-terminal SNAG domain (3).
Initial work highlights Gfi-1's importance in T cell development. Proviral integration up-regulates Gfi-1 during mouse lymphomagenesis (4, 5). Overexpression in transgenic mice induces a T cell differentiation block (6, 7). Gfi-1 inhibits activation-induced T cell death by repressing proapoptotic factors (8) and by overriding a G1 cell-cycle checkpoint (9). Gfi-1 regulates IL-4/STAT6-dependent Th2 cell proliferation (10) and IL-6/STAT3-mediated proliferative responses to antigenic stimulation (11). The paralogue Gfi-1b recognizes the same DNA sequence and similarly represses transcription through its SNAG domain (12). Gfi-1b-deficient mice demonstrate embryonic lethality resulting from absent erythrocytes (13), indicating that the two function in a tissue-specific manner.
Gene targeting has recently revealed that Gfi-1-deficient mice are unexpectedly neutropenic (14, 15), demonstrating its perhaps, even greater, contributions to myelopoiesis. We have recently found (45) that heritable Gfi-1 mutations cause human neutropenia and fail to repress ELA2, encoding neutrophil elastase, mutations of which are the major cause of inherited human neutropenia syndromes (16, 17). In both mice and humans with Gfi-1 mutations, myeloid progenitor cells fail to differentiate to mature neutrophils, causing the accumulation of monocytes and abnormal cells that blend features of monocytes and granulocytes. The molecular mechanism responsible for hematopoietic defects arising from Gfi-1 deficiency still remains unaccounted. One obstacle is the lack of recognized Gfi-1 target genes. Just one cellular promoter is known to be repressed by Gfi-1, that for the antiapoptotic factor bax (2, 8). To identify genes regulated by Gfi-1 during hematopoiesis in vivo, we performed large-scale chromatin immunoprecipitation (ChIP) assays. We find that Gfi-1 binds to a functionally diverse set of genes acting concertedly during hematopoietic differentiation.
Methods and Materials
Cell Culture.
Cells and media were purchased from American Type Culture Collection and Invitrogen, respectively. KG-1 and HL-60 cells were cultured in Iscove's modified Dulbecco's medium with 20% FBS, U-937 and Jurkat T cells in RPMI medium 1640 with 10% FCS, and NIH 3T3 cells in Dulbecco's modified Eagle's medium with 10% BCS. Cells were grown in the presence of 1% antibiotic-antimycotic solution (Invitrogen) in a humidified incubator at 37°C with 5% CO2. HL-60 cells (3–5 × 10⁵ cells per ml) were differentiated with addition of 1 μM all-trans-retinoic acid (ATRA).
Constructs.
pCMV5-Gfi-1, containing rat Gfi-1 cDNA, and pGfi-1-RV, also containing rat Gfi-1 cDNA, were gifts of P. Tsichlis (Tufts University, Boston) and J. Zhu (National Institute of Allergy and Infectious Diseases, National Institutes of Health, Bethesda), respectively. pCS+Myc-Gfi-1 was constructed by PCR amplifying the coding region of Gfi-1-RV and inserting it into EcoRI/XhoI sites in pCS2+Myc. pB30 × 2-TKCAT and pTKCAT were gifts from H. L. Grimes (University of Louisville School of Medicine, Louisville, KY). To generate TKCAT constructs with different Gfi-1 binding sites, the two B30 boxes were excised from pB30 × 2 with BglII/BamHI. The digested vector was filled in with the Klenow fragment of DNA polymerase, then was calf intestinal phosphatase dephosphorylated with blunt-end ligation of T4-kinased, double-stranded oligonucleotides.
Western Blotting.
Whole-cell extracts were separated by SDS/PAGE and electroblotted onto nitrocellulose, then were developed with 1:500 goat α-Gfi-1 (N-20) primary (Santa Cruz Biotechnology) and horseradish peroxidase-conjugated donkey α-goat secondary (Amersham Pharmacia) antisera using enhanced chemiluminescence (Amersham Pharmacia) detection.
ChIP Assay.
ChIP assay (18, 19) was modified as follows: 2 × 10⁸ cells in 200-ml volumes were fixed with 1% formaldehyde for 10 min at 37°C and terminated with 0.125 M glycine. Cells were sonicated with the Ultrasonic Dismembranator 500 (Fisher Scientific) in 1× radioimmunoprecipitation assay buffer (with proteinase inhibitors) on ice to generate soluble chromatin complex with DNA fragments of lengths <3 kb. The equivalent of ≈107 cells (1.5 ml of soluble chromatin) and 15 μl of N-20 antibody were used per reaction. Approximately 2 ng of immunoprecipitated DNA was used as template in each reaction in a total volume of 20 μl. Approximately 1/10,000 to 1/20,000 of the genomic DNA isolated from 1.5 ml of soluble chromatin (≈5 ng) was used as the input template per reaction. Semiquantitative PCR was performed for each gene with primer pairs (see Table 1, which is published as supporting information on the PNAS web site, www.pnas.org) based on GenBank genomic sequences analyzed with PRIMER3 software, which can be accessed at www.genome.wi.mit.edu/cgi-bin/primer/primer3_www.cgi. Each experiment was performed at least three times and representative data are shown.
RT-PCR Analysis.
Total RNA was prepared by using the Absolutely RNA kit (Stratagene). cDNA was synthesized with Superscript III (Invitrogen) from 1 μg of total RNA and primed with oligo(dT)12. Primers for each cDNA sequence (see Table 2, which is published as supporting information on the PNAS web site) were chosen by using PRIMER3 software. PCR of ACT, IL-8, E2F6, cMyc, and all other genes used 34 and 32 cycles, respectively, with conditions establishing log-linear amplification. RT-PCR products were resolved by agarose gel electrophoresis with ethidium bromide staining.
Electrophoretic Mobility-Shift Assay (EMSAs).
Myc epitope-tagged rat Gfi-1 was synthesized in vitro by using the TnT SP6 transcription/translation system (Promega). Double-stranded oligonucleotides (see Table 3, which is published as supporting information on the PNAS web site) were 5′-32P end-labeled by using T4 polynucleotide kinase. Binding reactions (10 μl vol) contained labeled DNA probes (2,000 cpm) in 10 mM Tris⋅HCl, pH 7.5, 50 mM NaCl, 1 mM MgCl2, 1 mM ZnSO4, 0.5 mM DTT, 0.5 mM EDTA, 10% glycerol, 0.05% Nonidet P-40, and 1 μg of poly(dI-dC), with 1/50th (1 μl) of the synthesized protein and were performed for 20 min at room temperature. N-20 (200 ng) antibody/reaction was added for supershift.
Transient Transfection Analysis.
NIH 3T3 cells were transiently transfected by using LipofectAMINE PLUS reagent (Invitrogen). Reporter constructs (1 μg) were cotransfected with internal control Renilla luciferase vector pRL-TK (200 ng) and either pCMV5-Gfi-1 or control vector (100 ng). Cell lysates were harvested 40 h later. Chloramphenicol acetyltransferase (CAT) activity was assayed with the CAT ELISA kit (Roche Applied Science) and normalized to luciferase activity measured with the dual luciferase reporter assay (Promega). Experiments were performed at least in triplicate with reporting of standard error of the mean.
Computational Methods.
The Gfi-1 consensus binding motif was calculated from the 32 EMSA-positive candidate sequences using meme (20), which was accessed at http://meme.sdsc.edu/meme/website/intro.html. Cluster analysis was performed by using epclust, which was accessed at http://ep.ebi.ac.uk/EP/EPCLUST. Hierarchical clustering uses Euclidean distances and average linkage. RT-PCR expression data were normalized to GAPDH. ChIP data are reported as the PCR product from specific antibody precipitant relative to the PCR of input material.
Results
ChIP Identification of Gfi-1 Targets.
ChIP is a valuable method for studying site-specific protein–DNA interactions in living cells; for example, as used to define promoters responsive to E2F and RB (21). Other techniques (22), such as microarray expression profiling and Serial Analysis of Gene Expression (SAGE), map global changes in gene expression, but do not allow for the direct identification of targeted promoters because one transcription factor may, in turn, activate other signaling pathways.
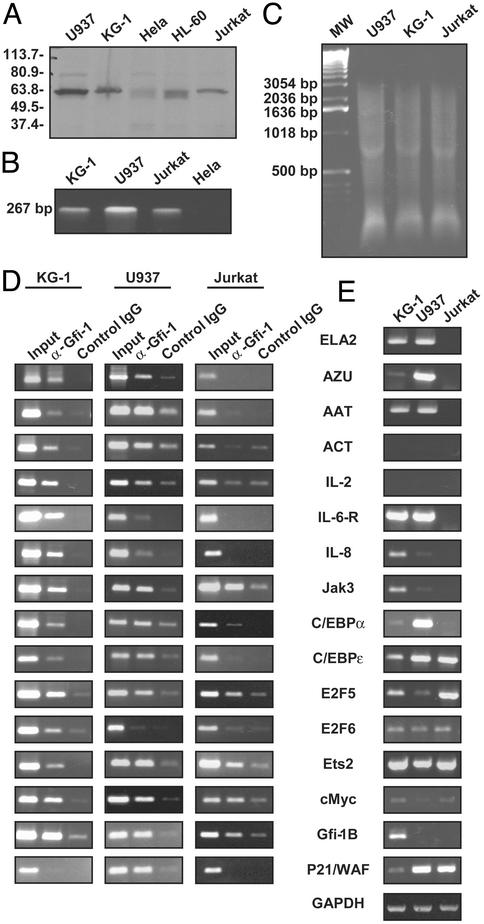
We chose to study Gfi-1 regulation of 34 candidate genes (Table 1) associated with hematopoiesis, or granulopoiesis in particular, including myeloid-specific proteinases and inhibitors, cell fate decision-related cell-surface receptors, cell-cycle regulators, transcription factors, and cytokines with corresponding receptors. We selected two human cell lines, promyelocytic KG-1 and monocytic U937 cells, representing two different stages of myelopoiesis. Both express Gfi-1, as shown by Western blot (Fig. 1A) and RT-PCR (Fig. 1B).
Figure 1.
Gfi-1 target genes. (A) Expression of Gfi-1 protein by Western blot. (B) Expression of Gfi-1 transcript by RT-PCR. (C) Sonicated chromatin used as input for ChIP assay, with ethidium bromide-stained agarose gel. (D) ChIP assays and representative results. (E) Semiquantitative RT-PCR of Gfi-1 target genes with GAPDH as control.
We first used ChIP to examine the occupancy of each promoter in the set of candidate genes in KG-1 cells. Noting that Gfi-1 can function from a distance (3), we used sonication to generate soluble chromatin fragments of less than ≈3 kb (Fig. 1C), and we designed specific primers within the 3-kb promoter region upstream of the transcription initiation site of each corresponding gene (Table 1). We confirmed that among the 34 tested genes, Gfi-1 is specifically immunoprecipitated from the promoters of the 15 genes listed in Fig. 1D. [ELA2, encoding neutrophil elastase, is also a target of Gfi-1 in KG-1 cells (45).] A limitation of the method is that identification of binding sites in atypical locations such as >3 kb upstream or within introns or the 3′ UTR requires more exhaustive searching.
Mutation of neutrophil elastase (ELA2) is the primary cause of human hereditary neutropenia (16, 17). Proteinase 3 (Pr3) and azurocidin (AZU) are related neutrophil- and monocyte-derived proteases. These three genes are organized in a common locus on chromosome 19 and are coordinately expressed in myelomonocytic lineages. In addition to neutrophil elastase, cathepsin G (CatG) is the other major proteinase of human neutrophil granules. α1-antitrypsin (AAT) is the principal inhibitor of neutrophil elastase and cathepsin G (23). α1-antichymotrypsin (ACT) is a homologue of AAT primarily synthesized in the liver. Among these genes, ELA2 (45), Azu, AAT, and ACT are targets of Gfi-1 in KG-1 cells (Fig. 1D). Thus, Gfi-1 regulates a set of granulocyte specific genes.
Granulocyte colony-stimulating factor (G-CSF), G-CSF receptor, granulocyte/macrophage CSF (GM-CSF), and GM-CSF receptor β (glycoprotein of Mr 130,000) are growth factors and corresponding receptors that are necessary for granulocyte or macrophage commitment. IL-8 and IL-8 receptor play important roles in mediating the activation and migration of neutrophils into tissue from peripheral blood (24). IL-2, Jak3, IL-6 receptor, and Stat3 represent ligand-activated signaling pathways required for T cell proliferation. Among them, IL-2, Jak3, IL-6-R, and IL-8 are targeted by Gfi-1 in KG-1 cells (Fig. 1D), indicating its role in activating neutrophils, macrophages, and T lymphocytes.
CCAAT/enhancer-binding protein α (C/EBPα) (25), C/EBPɛ (26), and PU.1 (27, 28) are transcription factors essential for the development of neutrophils. GATA1 transcription factor is indispensable for erythroid and megakaryocyte development (29, 30). Gfi-1b is the Gfi-1 paralogue required for erythropoiesis (13). Gfi-1 is recruited to C/EBPα, C/EBPɛ, and Gfi-1b in KG-1 cells (Fig. 1D), indicating a relatively primary position in the hierarchy of transcriptional control of myeloid differentiation.
E2F family transcription factors, including E2F1 to E2F6 and DP2, the Ets family protein Ets1 and Ets2, the cMyc oncoprotein, and cyclin-dependent kinase inhibitor P21/WAF are cell-cycle regulators. Gfi-1 is recruited to E2F5, E2F6, Ets2, and cMyc in KG-1 cells (Fig. 1D), suggesting that it coordinates the cell cycle.
The cell fate decision-related cell-surface receptors Notch1 and Notch2 are involved in hematopoietic lineage specification (31, 32), but they are not targeted by Gfi-1 in myeloid cells.
We determined whether the 15 genes identified above are also recognized by Gfi-1 in monocytic U937 cells and Jurkat T cells. All, except IL-6-R, IL-8, and E2F6 are targeted by Gfi-1 in U937 cells. In Jurkat T cells, however, only Jak3, C/EBPα, E2F5, Ets2, cMyc, and Gfi-1b are targets of Gfi-1. This result is reasonable, considering that the cellular environment of U937 cells is more similar to KG-1 cells than to Jurkat cells. We also examined P21/WAF because it is repressed by Gfi-1b in vitro (12); however, Gfi-1 targets P21/WAF only in U937, but not in KG-1 cells or Jurkat T cells (Fig. 1D).
Gfi-1 Promoter Occupancy and Expression.
To test whether there is a correlation between the recruitment of Gfi-1 and transcription, we examined the expression pattern of the above 16 target genes by RT-PCR in KG-1, U937, and Jurkat T cells (Fig. 1E). Surprisingly, expression of target genes is not consistently correlated with Gfi-1 recruitment. There are at least three possibilities. First, as a repressor, Gfi-1 may only be required when silencing of expression cannot be achieved through other mechanisms. For example, Gfi-1 is not needed, and cannot access, genes in regions of closed chromatin where transcription does not occur. Second, gene expression is tightly regulated, so that in some circumstances Gfi-1 may be called on to completely shut off activity, whereas in others its role may be to dampen overly high levels of expression. Third, Gfi-1 could also conceivably function as a transcriptional activator. In fact, Gfi-1b may act either as an activator or repressor, depending on the promoter and developmental context (33).
Gfi-1 Binding Sites in Targeted Genes.
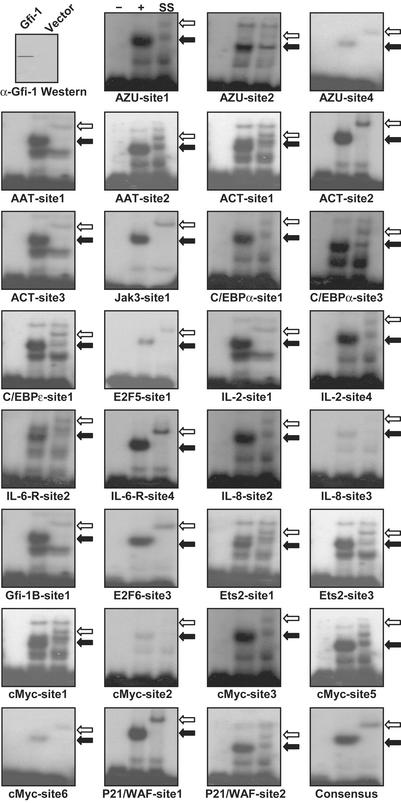
To validate the immunoprecipitation results, we sought to identify Gfi-1 binding sites in targeted promoters. The consensus-recognition sequence, determined by selection for Gfi-1 binding from a population of random DNA sequences, is TAAA(T/G)CAC(A/T)GCA, and only the core sequence AA(T/G)C is invariant (2). We identified potential Gfi-1 binding sites within the 3-kb promoter region of each target gene based on the presence of the core sequence. Each of 62 potential binding sites was tested by EMSA (Table 3), and the 32 positive results shown (Fig. 2). At least one Gfi-1 binding site is present in the promoter of each targeted gene.
Figure 2.
Characterization of Gfi-1 binding sites in target genes by EMSA. (Upper Left) α-Gfi-1 Western blot of in vitro-synthesized Gfi-1 compared with TnT transcription/translation system programmed with vector-only control. EMSA was performed with oligonucleotides listed in Table 3. The first lane (−) of the remaining 31 panels shows DNA probe alone. The second lane (+) shows the addition of TnT-synthesized Gfi-1. The third lane is supershift with α-Gfi-1 antibody. Black and white arrows show shift and supershift, respectively. Negative results for 30 other tested potential binding sites are not shown.
Gfi-1 Activity on Targeted Genes.
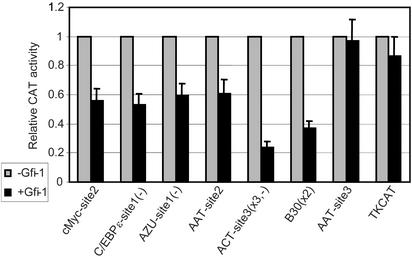
To confirm that the Gfi-1 binding sites identified by EMSA are able to recruit Gfi-1 in living cells, we performed transient transfection assays in NIH 3T3 cells. We inserted six Gfi-1 binding sites (ELA2-site-8, cMyc-site-2, C/EBPɛ-site-1, AZU-site-1, AAT-site-2, and ACT-site-3), and one potential binding site that was determined by EMSA to be negative for Gfi-1 binding (AAT-site-3), into a construct containing the CAT reporter gene driven by the herpes simplex virus thymidine kinase promoter (3). The constructs B30 × 2-TKCAT and TKCAT (3) act as positive and negative controls, respectively. Gfi-1 represses expression from reporters containing binding sites, whereas that of the control constructs was unaffected (Fig. 3), confirming that the Gfi-1 binding sites identified by EMSA function in living cells.
Figure 3.
Functional recruitment of Gfi-1 to binding sites identified by EMSA in NIH 3T3 cells. A minus sign indicates that the site is in reverse orientation; ACT-site3 and B30 consensus are trimerized and dimerized, respectively. Each construct has a different basal level of CAT expression, so relative CAT activity of each construct in the presence of Gfi-1 is normalized to activity in its absence.
Gfi-1 Recruitment During Granulocytic Differentiation of HL-60 Cells.
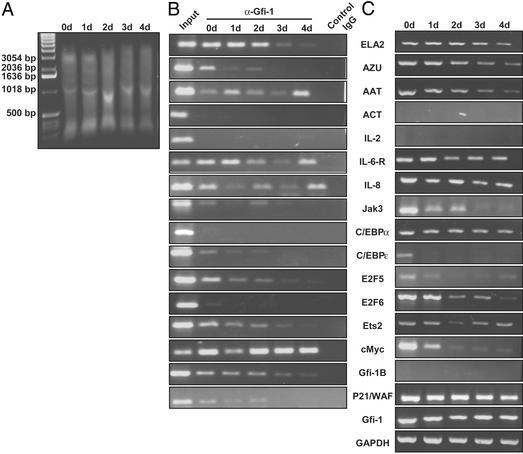
By using ChIP (Fig. 4A) and RT-PCR, respectively, we examined the pattern of Gfi-1 binding (Fig. 4B) and expression (Fig. 4C) of target genes during granulocytic maturation of HL-60 cells, induced to differentiate by treatment with ATRA (34–36) over the course of 4 days. Note that Gfi-1 is also expressed in HL-60 cells (Fig. 4C). All of the Gfi-1 target genes, except ACT, IL-2, and Gfi-1b, are expressed in HL-60 cells, and their expression is down-regulated during differentiation (Fig. 4C). All Gfi-1 target genes, except ACT, IL-2, C/EBPα, and E2F6, are bound by Gfi-1 in HL-60 cells. During the time course of differentiation, recruitment of Gfi-1 to most of the genes, including ELA2, AZU, Jak3, C/EBPɛ, E2F5, Ets2, and P21/WAF, diminishes; presumably, as is documented for ELA2 (34), the chromatin assumes a closed configuration, and Gfi-1 is neither required nor can access the locus for binding. Binding of Gfi-1 to cMyc remains constant (Fig. 4B) during differentiation despite a sharp reduction of cMyc expression (Fig. 4C), suggesting other factors may make greater contributions to its regulation. Surprisingly, recruitment of Gfi-1 to AAT, IL-6-R, and IL-8 varies periodically (and reproducibly, data not shown) during differentiation (Fig. 4B). These findings highlight Gfi-1's pivotal role during granulocytic differentiation and emphasize the complexity of the transcriptional network regulating granulocytic differentiation.
Figure 4.
Promoter occupancy by Gfi-1 and expression of target genes during granulocytic differentiation of HL-60 cells with ATRA (0–4 days). (A) Sonicated chromatin used as input for ChIP, with ethidium bromide-stained agarose gel. (B) ChIP assays and representative results. (C) RT-PCR expression of target genes.
Although the results are similar for HL-60 and KG-1 cells, there are also differences, probably attributable to the fact that KG-1 cells are early myeloblasts, whereas HL-60 cells are late myeloblasts (35). For example, C/EBPα and E2F6 are expressed in both cells (Fig. 1E and 4C), but they are only targeted by Gfi-1 in KG-1 (Fig. 1D), and not HL-60 (Fig. 4B) cells. Conversely, Gfi-1b is expressed in KG-1 (Fig. 1E), but not HL-60 (Fig. 4C) cells, although Gfi-1 targets Gfi-1b in both cells (Fig. 1D and Fig. 4B). ACT and IL-2 are not expressed in either KG-1 (Fig. 1E) or HL-60 cells (Fig. 4C) and Gfi-1 does not bind either promoter in HL-60 cells (Fig. 4B), whereas it targets both in KG-1 cells (Fig. 1D). Thus, recruitment of Gfi-1 varies considerably with cellular context.
Discussion
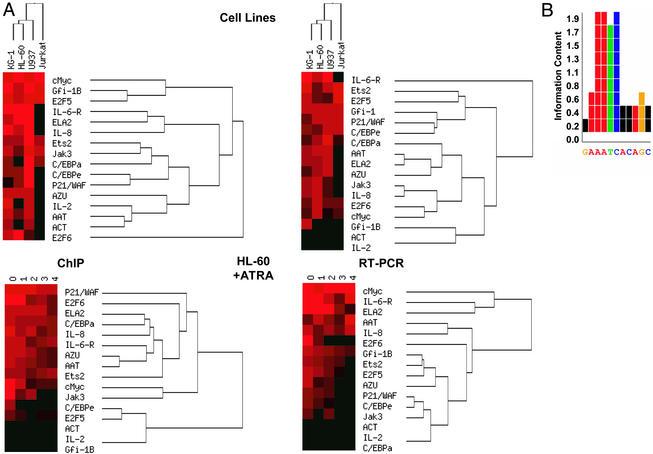
Stratification of genes by their response to specific transcription factors offers a different perspective from which to dissect the complexity of cellular differentiation programs. We initially chose to investigate 34 genes as potential Gfi-1 targets, based on functional attributes suggesting contributions to myelopoiesis. Sixteen of the tested genes prove to be Gfi-1 targets (Fig. 1D). To explore relationships among the targeted genes, we processed RT-PCR expression and ChIP data by using cluster analysis (37). When visualized in this manner, the expression data (Fig. 5A) reveal that a subset of genes allows for discrimination of myeloid lineages (KG-1, HL-60, and U937) from T lymphocytes (Jurkat cells). In particular, transcription of the subset Ets2, E2F5, P21/WAF, and C/EBPɛ is relatively enriched in Jurkat cells. A similar subset of expressed genes helps to set myeloblasts (KG-1 and HL-60) apart from monocytes (U937) and includes JAK3, IL8, E2F6, and cMyc. Clustering by Gfi-1 binding using ChIP data, however, yields a categorization tree dissimilar to that obtained from expression profiling (Fig. 5A). This lack of correspondence suggests that Gfi-1 governs transcriptional responses from a relatively high-level perspective within the transcriptional hierarchy and recruits other transcription factors to coordinate genes marking terminal differentiation. The data further reveal that Gfi-1 binding and expression for many of the target genes diminishes as HL-60 cells mature to granulocytes, indicating that other transcriptional repression mechanisms, such as chromatin architecture, assume greater responsibility.
Figure 5.
Summary of Gfi-1 binding and expression data. (A) Cluster analysis of ChIP and RT-PCR expression data. (B) Consensus motif of 32 positive sites. The information content of the MEME algorithm is a measure of which positions of the motif are most highly conserved.
Analysis of target promoters enables refinement of Gfi-1's recognition site (Fig. 5B), previously determined only on the basis of binding artificially generated DNA fragments. Not all sequences containing the central AATC bind Gfi-1, indicating a requirement for flanking base pairs.
Gfi-1 and Granulopoiesis.
The phenotype of Gfi-1-deficient mice and humans provides support for concluding that Gfi-1 functions as a repressor at a relatively primary stage of hematopoietic differentiation. Both species demonstrate replacement of mature neutrophils with an indistinctly differentiated, immature myeloid lineage blending features of neutrophils and monocytes, thus highlighting Gfi-1's essential contributions to delineating the two cell types. Presumably, coordination of genetic regulatory events during terminal differentiation becomes subordinated to other transcription factors such as C/EPBɛ. Accordingly, mice (26) and humans (38) deficient for C/EPBɛ do not demonstrate neutropenia, but rather, have the disease “specific-granule deficiency,” in which there is an absence of the granules characteristic of mature neutrophils. We also identify C/EBPα and Ets2 as targets of Gfi-1, both of which are critical for granulopoiesis. C/EBPα null mice completely lack both neutrophils and eosinophils (25), whereas the Ets repressor complex regulates terminal macrophage differentiation (39). Gfi-1 binds C/EBPα in early (KG-1) but not late (HL-60) myeloblasts and binds to C/EBPɛ and Ets2 in both. These results again indicate that Gfi-1 may control granulopoiesis through regulating other essential transcription factors.
Gfi-1 and Cell-Cycle Control.
Gfi-1 promotes cell proliferation and prevents apoptosis. Specifically, Gfi-1 contributes to T cell activation by repressing G1 arrest, which can be induced by IL-2 withdrawal (3). Gfi-1 may also regulate apoptosis through repression of multiple proapoptotic regulators (8). Constitutive expression of Gfi-1 accelerates entry of resting T cells into S phase and decreases apoptosis (9). Induction of Gfi-1 by IL-4 increases Th2 cell expansion by promoting proliferation and preventing apoptosis (10). Gfi-1 cooperates with the cell-cycle regulators PIM-1 and cMyc (6, 7, 40). The E2F family of transcription factors also plays a critical role in cell-cycle progression through its ability to regulate the expression of target genes, including cyclins and cyclin-dependent kinases (41). Ets family factors, as well, participate in the transcriptional control of cell cycle regulatory genes (42–44). Our data show that Gfi-1 counts E2F5, E2F6, Ets2, cMyc, and P21/WAF among its targets in myeloid cell lines. Gfi-1 may therefore contribute to granulopoiesis through the regulation of cell-cycle factors.
Regulation of Gfi-1b.
The Gfi-1 paralogue, Gfi-1b, similarly inhibits G1 arrest and differentiation (12). Although Gfi-1b and Gfi-1 have distinct tissue-specific roles in vivo (13–15), they are expressed commonly in some tissues and cell lines (12). It is possible that there is competition between the two, as they share a common DNA-binding specificity. ChIP analysis reveals that Gfi-1b is target of Gfi-1, indicating that the two factors may regulate each other.
Supplementary Material
Acknowledgments
This work was supported by National Institutes of Health, Doris Duke Foundation, and Burroughs-Wellcome grants (to M.H.). We thank Drs. H. L. Grimes, J. Zhu, and P. Tsichlis for vectors.
Abbreviations
- Gfi-1
growth factor independence 1
- ChIP
chromatin immunoprecipitation
- EMSA
electrophoretic mobility-shift assay
References
- 1.Gilks C B, Bear S E, Grimes H L, Tsichlis P N. Mol Cell Biol. 1993;13:1759–1768. doi: 10.1128/mcb.13.3.1759. [DOI] [PMC free article] [PubMed] [Google Scholar]
- 2.Zweidler-Mckay P A, Grimes H L, Flubacher M M, Tsichlis P N. Mol Cell Biol. 1996;16:4024–4034. doi: 10.1128/mcb.16.8.4024. [DOI] [PMC free article] [PubMed] [Google Scholar]
- 3.Grimes H L, Chan T O, Zweidler-McKay P A, Tong B, Tsichlis P N. Mol Cell Biol. 1996;16:6263–6272. doi: 10.1128/mcb.16.11.6263. [DOI] [PMC free article] [PubMed] [Google Scholar]
- 4.Schmidt T, Zornig M, Beneke R, Moroy T. Nucleic Acids Res. 1996;24:2528–2534. doi: 10.1093/nar/24.13.2528. [DOI] [PMC free article] [PubMed] [Google Scholar]
- 5.Scheijen B, Jonkers J, Acton D, Berns A. J Virol. 1997;71:9–16. doi: 10.1128/jvi.71.1.9-16.1997. [DOI] [PMC free article] [PubMed] [Google Scholar]
- 6.Schmidt T, Karsunky H, Rodel B, Zevnik B, Elsasser H P, Moroy T. EMBO J. 1998;17:5349–5359. doi: 10.1093/emboj/17.18.5349. [DOI] [PMC free article] [PubMed] [Google Scholar]
- 7.Schmidt T, Karsunky H, Gau E, Zevnik B, Elsasser H P, Moroy T. Oncogene. 1998;17:2661–2667. doi: 10.1038/sj.onc.1202191. [DOI] [PubMed] [Google Scholar]
- 8.Grimes H L, Gilks C B, Chan T O, Porter S, Tsichlis P N. Proc Natl Acad Sci USA. 1996;93:14569–14573. doi: 10.1073/pnas.93.25.14569. [DOI] [PMC free article] [PubMed] [Google Scholar]
- 9.Karsunky H, Mende I, Schmidt T, Moroy T. Oncogene. 2002;21:1571–1579. doi: 10.1038/sj.onc.1205216. [DOI] [PubMed] [Google Scholar]
- 10.Zhu J, Guo L, Min B, Watson C J, Hu-Li J, Young H A, Tsichlis P N, Paul W E. Immunity. 2002;16:733–744. doi: 10.1016/s1074-7613(02)00317-5. [DOI] [PubMed] [Google Scholar]
- 11.Rodel B, Tavassoli K, Karsunky H, Schmidt T, Bachmann M, Schaper F, Heinrich P, Shuai K, Elsasser H P, Moroy T. EMBO J. 2000;19:5845–5855. doi: 10.1093/emboj/19.21.5845. [DOI] [PMC free article] [PubMed] [Google Scholar]
- 12.Tong B, Grimes H L, Yang T Y, Bear S E, Qin Z, Du K, El-Deiry W S, Tsichlis P N. Mol Cell Biol. 1998;18:2462–2473. doi: 10.1128/mcb.18.5.2462. [DOI] [PMC free article] [PubMed] [Google Scholar]
- 13.Saleque S, Cameron S, Orkin S H. Genes Dev. 2002;16:301–306. doi: 10.1101/gad.959102. [DOI] [PMC free article] [PubMed] [Google Scholar]
- 14.Karsunky H, Zeng H, Schmidt T, Zevnik B, Kluge R, Schmid K W, Duhrsen U, Moroy T. Nat Genet. 2002;30:295–300. doi: 10.1038/ng831. [DOI] [PubMed] [Google Scholar]
- 15.Hock H, Hamblen M J, Rooke H M, Traver D, Bronson R T, Cameron S, Orkin S H. Immunity. 2003;18:109–120. doi: 10.1016/s1074-7613(02)00501-0. [DOI] [PubMed] [Google Scholar]
- 16.Horwitz M, Benson K F, Person R E, Aprikyan A G, Dale D C. Nat Genet. 1999;23:433–436. doi: 10.1038/70544. [DOI] [PubMed] [Google Scholar]
- 17.Dale D C, Person R E, Bolyard A A, Aprikyan A G, Bos C, Bonilla M A, Boxer L A, Kannourakis G, Zeidler C, Welte K, et al. Blood. 2000;96:2317–2322. [PubMed] [Google Scholar]
- 18.Orlando V, Strutt H, Paro R. Methods. 1997;11:205–214. doi: 10.1006/meth.1996.0407. [DOI] [PubMed] [Google Scholar]
- 19.Duan Z, Stamatoyannopoulos G, Li Q. Mol Cell Biol. 2001;21:3083–3095. doi: 10.1128/MCB.21.9.3083-3095.2001. [DOI] [PMC free article] [PubMed] [Google Scholar]
- 20.Bailey T L, Elkan C. Proceedings of the Second International Conference on Intelligent Systems for Molecular Biology. Menlo Park, CA: AAAI Press; 1994. pp. 28–36. [PubMed] [Google Scholar]
- 21.Takahashi Y, Rayman J B, Dynlacht B D. Genes Dev. 2000;14:804–816. [PMC free article] [PubMed] [Google Scholar]
- 22.Butte A. Nat Rev Drug Discov. 2002;1:951–960. doi: 10.1038/nrd961. [DOI] [PubMed] [Google Scholar]
- 23.Travis J. Am J Med. 1988;84:37–42. doi: 10.1016/0002-9343(88)90156-8. [DOI] [PubMed] [Google Scholar]
- 24.Modi W S, Dean M, Seuanez H N, Mukaida N, Matsushima K, O'Brien S J. Hum Genet. 1990;84:185–187. doi: 10.1007/BF00208938. [DOI] [PubMed] [Google Scholar]
- 25.Zhang D E, Zhang P, Wang N D, Hetherington C J, Darlington G J, Tenen D G. Proc Natl Acad Sci USA. 1997;94:569–574. doi: 10.1073/pnas.94.2.569. [DOI] [PMC free article] [PubMed] [Google Scholar]
- 26.Yamanaka R, Barlow C, Lekstrom-Himes J, Castilla L H, Liu P P, Eckhaus M, Decker T, Wynshaw-Boris A, Xanthopoulos K G. Proc Natl Acad Sci USA. 1997;94:13187–13192. doi: 10.1073/pnas.94.24.13187. [DOI] [PMC free article] [PubMed] [Google Scholar]
- 27.Scott E W, Simon M C, Anastasi J, Singh H. Science. 1994;265:1573–1577. doi: 10.1126/science.8079170. [DOI] [PubMed] [Google Scholar]
- 28.McKercher S R, Torbett B E, Anderson K L, Henkel G W, Vestal D J, Baribault H, Klemsz M, Feeney A J, Wu G E, Paige C J, Maki R A. EMBO J. 1996;15:5647–5658. [PMC free article] [PubMed] [Google Scholar]
- 29.Fujiwara Y, Browne C P, Cunniff K, Goff S C, Orkin S H. Proc Natl Acad Sci USA. 1996;93:12355–12358. doi: 10.1073/pnas.93.22.12355. [DOI] [PMC free article] [PubMed] [Google Scholar]
- 30.Shivdasani R A, Fujiwara Y, McDevitt M A, Orkin S H. EMBO J. 1997;16:3965–3973. doi: 10.1093/emboj/16.13.3965. [DOI] [PMC free article] [PubMed] [Google Scholar]
- 31.Allman D, Aster J C, Pear W S. Immunol Rev. 2002;187:75–86. doi: 10.1034/j.1600-065x.2002.18707.x. [DOI] [PubMed] [Google Scholar]
- 32.Ohishi K, Varnum-Finney B, Bernstein I D. Int J Hematol. 2002;75:449–459. doi: 10.1007/BF02982106. [DOI] [PubMed] [Google Scholar]
- 33.Jegalian A G, Wu H. J Biol Chem. 2002;277:2345–2352. doi: 10.1074/jbc.M105575200. [DOI] [PubMed] [Google Scholar]
- 34.Wong E T, Jenne D E, Zimmer M, Porter S D, Gilks C B. Blood. 1999;94:3730–3736. [PubMed] [Google Scholar]
- 35.Morosetti R, Park D J, Chumakov A M, Grillier I, Shiohara M, Gombart A F, Nakamaki T, Weinberg K, Koeffler H P. Blood. 1997;90:2591–2600. [PubMed] [Google Scholar]
- 36.Cao Z, Flanders K C, Bertolette D, Lyakh L A, Wurthner J U, Parks W T, Letterio J J, Ruscetti F W, Roberts A B. Blood. 2003;101:498–507. doi: 10.1182/blood-2002-05-1549. [DOI] [PubMed] [Google Scholar]
- 37.Eisen M B, Spellman P T, Brown P O, Botstein D. Proc Natl Acad Sci USA. 1998;95:14863–14868. doi: 10.1073/pnas.95.25.14863. [DOI] [PMC free article] [PubMed] [Google Scholar]
- 38.Lekstrom-Himes J A, Dorman S E, Kopar P, Holland S M, Gallin J I. J Exp Med. 1999;189:1847–1852. doi: 10.1084/jem.189.11.1847. [DOI] [PMC free article] [PubMed] [Google Scholar]
- 39.Klappacher G W, Lunyak V V, Sykes D B, Sawka-Verhelle D, Sage J, Brard G, Ngo S D, Gangadharan D, Jacks T, Kamps M P, et al. Cell. 2002;109:169–180. doi: 10.1016/s0092-8674(02)00714-6. [DOI] [PubMed] [Google Scholar]
- 40.Berns A, van der Lugt N, Alkema M, van Lohuizen M, Domen J, Acton D, Allen J, Laird P W, Jonkers J. Cold Spring Harbor Symp Quant Biol. 1994;59:435–447. doi: 10.1101/sqb.1994.059.01.049. [DOI] [PubMed] [Google Scholar]
- 41.Dyson N. Genes Dev. 1998;12:2245–2262. doi: 10.1101/gad.12.15.2245. [DOI] [PubMed] [Google Scholar]
- 42.Roussel M F, Davis J N, Cleveland J L, Ghysdael J, Hiebert S W. Oncogene. 1994;9:405–415. [PubMed] [Google Scholar]
- 43.Sullivan J, Feeley B, Guerra J, Boxer L M. J Biol Chem. 1997;272:1943–1949. doi: 10.1074/jbc.272.3.1943. [DOI] [PubMed] [Google Scholar]
- 44.Langer S J, Bortner D M, Roussel M F, Sherr C J, Ostrowski M C. Mol Cell Biol. 1992;12:5355–5362. doi: 10.1128/mcb.12.12.5355. [DOI] [PMC free article] [PubMed] [Google Scholar]
- 45. Person, R. E., Lin, F.-Q., Duan, Z., Benson, K. E., Wechsler, J., Papadaki, H. A., Eliopoulos, G. E., Kaufman, C., Bertolone, S. J., Nakamoto, B., et al. (2003) Nat. Genet., in press. [DOI] [PMC free article] [PubMed]
Associated Data
This section collects any data citations, data availability statements, or supplementary materials included in this article.


