Abstract
MITF, TFE3, TFEB, and TFEC comprise a transcription factor family (MiT) that regulates key developmental pathways in several cell lineages. Like MYC, MiT members are basic helix-loop-helix-leucine zipper transcription factors. MiT members share virtually perfect homology in their DNA binding domains and bind a common DNA motif. Translocations of TFE3 occur in specific subsets of human renal cell carcinomas and in alveolar soft part sarcomas. Although multiple translocation partners are fused to TFE3, each translocation product retains TFE3's basic helix–loop–helix leucine zipper. We have identified the genes fused by the chromosomal translocation t(6;11)(p21.1;q13), characteristic of another subset of renal neoplasms. In two primary tumors we found that Alpha, an intronless gene, rearranges with the first intron of TFEB, just upstream of TFEB's initiation ATG, preserving the entire TFEB coding sequence. Fluorescence in situ hybridization confirmed the involvement of both TFEB and Alpha in this translocation. Although the Alpha promoter drives expression of this fusion gene, the Alpha gene does not contribute to the ORF. Whereas TFE3 is typically fused to partner proteins in subsets of renal tumors, we found that wild-type, unfused TFE3 stimulates clonogenic growth in a cell-based assay, suggesting that dysregulated expression, rather than altered function of TFEB or TFE3 fusions, may confer neoplastic properties, a mechanism reminiscent of MYC activation by promoter substitution in Burkitt's lymphoma. Alpha-TFEB is thus identified as a fusion gene in a subset of pediatric renal neoplasms.
MITF, TFE3, TFEB, and TFEC are closely related basic helix–loop–helix leucine zipper (bHLH-LZ) transcription factors (1–8) that may homo- or heterodimerize in all combinations to bind DNA (9). These factors share sequence homology in their DNA-contacting basic domains (10), as well as activation domains, and recognize identical DNA sequences (9), suggesting that they may regulate similar downstream targets. Genetic and biochemical studies have revealed functional overlap of MiT activity in certain developmental lineages. Specifically, use of knockout mice by Jenkins and colleagues (8) has elegantly demonstrated that, whereas mutation of either Mitf or TFE3 in mice does not disrupt osteoclast development, mutation of both genes or presence of a dominant-negative allele produces severe osteopetrosis. Homozygous mutation of MITF in the mouse is particularly devastating to the melanocyte lineage, resulting in failure of melanocyte development (5). In humans, Mitf haploinsufficiency results in type IIa Waardenburg syndrome (11). Mice homozygous null for TFE3 or TFEC had no recognized abnormalities (8), but TFEB nulls exhibited embryonic lethality associated with placental vascular defects (12). In addition, Mitf and TFE3 have been found to undergo identical modifications after cytokine stimulation (13), and MITF has been shown to directly regulate BCL2, a key apoptotic regulator, in a manner important for melanocyte and melanoma survival (14).
Among members of the MiT family, TFE3 has previously been implicated in cancer-associated translocations. TFE3 translocations occur in distinctive renal carcinomas of childhood and young adults and in alveolar soft part sarcoma. In these translocations, the DNA binding domain of TFE3 is fused to various N-terminal partners, including PRCC, NonO (p54nrb), PSF, or ASPL (15–20). Although the mechanism through which these fusions contribute to oncogenesis remains unclear, several studies suggest that the PRCC-TFE3 (21, 22) and ASPL-TFE3 fusion proteins (M.L., unpublished observations) are transcriptional activators. One study explored the possibility that PRCC-TFE3 may interfere with mitotic checkpoint control via the PRCC domain (23), although it is unclear whether such a mechanism could apply to the other fusion partners.
Recently a class of renal tumors containing a novel t(6;11)(p21.1;q12) translocation has been described (24). Whereas these tumors exhibit epithelioid morphology suggestive of renal carcinoma, they are distinctive in their non-immunoreactivity for epithelial markers (cytokeratin, epithelial membrane antigen) and positive immunoreactivity for melanocytic markers (HMB45, MelanA). We report here that TFEB is targeted by this translocation in both of two tumors examined. TFEB fuses with the Alpha gene at 11q13, an intronless gene that does not contribute coding sequence to the fusion product. Furthermore, hypothesizing that dysregulated expression may contribute to the oncogenic mechanism for TFE3 and TFEB, we demonstrate that constitutive expression of wild-type, unfused TFE3 can rescue melanoma clonogenic growth in response to inhibition of Wnt signaling.
Materials and Methods
Clinical History.
The index case was an 18-yr-old female with a history of obesity, hirsutism, and polycystic ovary syndrome. A right renal mass was detected, and partial nephrectomy was performed. The patient was well, without evidence of recurrent neoplastic disease at 18-mo follow-up. Postoperatively, she continued to require spironolactone for control of hirsutism. Clinical details of the second patient, an 18-yr-old male with a 7-cm left renal mass, are published (24).
Pathologic Examination.
Portions of tumor from a partial nephrectomy performed on the index patient were immediately placed in 2% glutaraldehyde for ultrastructural analysis, in antibiotic-enriched cell culture medium for cytogenetic analysis, in OCT compound for −60°C storage, and in 10% buffered formalin for histologic evaluation. Paraffin-embedded sections were stained with hematoxylin and eosin (H&E) and Hale's colloidal iron.
Immunohistochemical staining was performed on formalin-fixed paraffin-embedded material by using a streptavidin-biotin-based alkaline phosphatase detection kit (universal multispecies USA horseradish peroxidase kit; Signet Laboratories, Dedham, MA) with liquid DAB-plus (Zymed). The following antibodies were used: HMB-45, monoclonal S100, desmin (BioGenex Laboratories, San Ramon, CA), epithelial membrane antigen, AE1-AE3, chromogranin (Signet Laboratories), low-molecular-weight cytokeratin (CAM 5.2; Becton Dickinson), CD10 (Cell Marque, Hot Springs, AR), and vimentin clone V-9 (DAKO). Positive and negative controls were stained in parallel.
Glutaraldehyde-fixed tissue was postfixed in osmium tetroxide and embedded in Epon 812. One-micrometer-thick sections were stained with toluidine blue and examined microscopically to confirm the presence of tumor. Ultrathin sections were stained with uranyl acetate and lead nitrate and examined with a Philips 300 electron microscope (Philips, Eindhoven, The Netherlands).
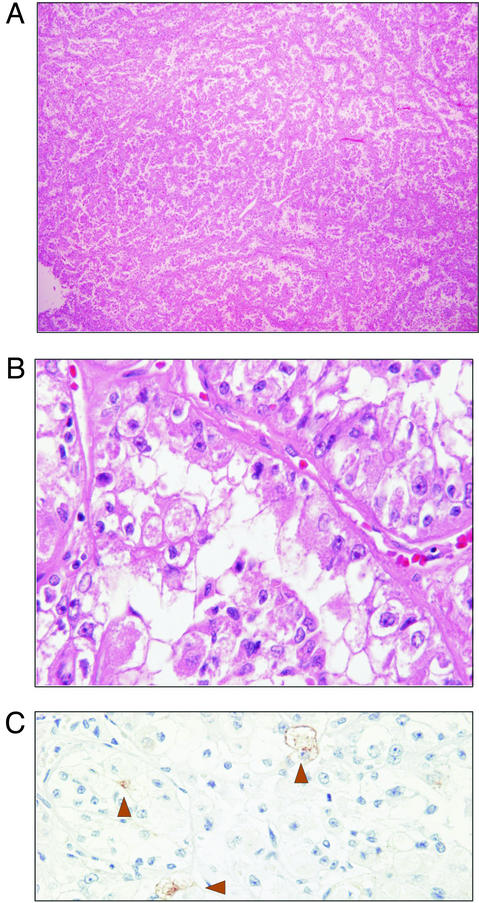
Gross examination of the right upper kidney pole revealed a well-circumscribed tan-yellow homogeneous 2.8 × 2.5 × 2.5-cm mass distending the renal capsule. Histologically, the tumor consisted of epithelioid cells arranged in a nested alveolar or acinar pattern (Fig. 1A). In areas, these acini were elongated and irregular, imparting a papillary-like appearance to the architecture. Acinar lumens often contained clusters of degenerating cells with pyknotic nuclei. Rare “blood lakes” were identified. Individual cells were round-to-polygonal with abundant cytoplasm. Cells with eosinophilic granular cytoplasm and cells with clear cytoplasm were interspersed, with the eosinophilic cells being generally more basally located (Fig. 1B). Nuclei were round and often showed nucleoli that were conspicuous at low power, corresponding to a Fuhrman nuclear grade 3 of 4. Rare foci of psammomatous calcification were present. Foam cells, hyaline globules, and hemosiderin were not identified. Nests were nearly back-to-back, separated by thin capillary-sized vascular channels. Positive staining for colloidal iron, HMB-45 (focal, rare; Fig. 1C), CD10, and vimentin was observed. Tumor cells were negative for AE1/AE3, Cam5.2, epithelial membrane antigen, S100, chromogranin, and desmin. The tumor was encompassed by a fibrous capsule (which lacked calcification), did not involve the renal sinus, and corresponded to a NWTS-5 stage I (National Wilms Tumor Study Group, 2001).
Figure 1.
Light microscopic features of t(6;11) carcinoma. (A) At low magnification, the tumor consisted of epithelioid cells arranged in a nested alveolar or acinar pattern (H&E, original magnification, ×5). (B) Higher magnification showed cells with voluminous clear and granular eosinophilic cytoplasm. Acinar lumens often contained clusters of degenerating cells with pyknotic nuclei. Individual cells were round to polygonal with abundant cytoplasm. Acinar structures were separated by thin vascular channels (H&E, original magnification, ×60). (C) Immunostaining showed rare focal positivity for HMB-45 (H&E, original magnification, ×40).
Ultrastructural examination showed that the granular cells contained numerous mitochondria and that the clear cells contained abundant glycogen pools and apical neutral fat droplets. Groups of cells were invested by a well-developed basal lamina. Intermediate-type cell junctions were observed. Poorly formed lumens showed junctional complexes and rudimentary microvilli. The most prominent organelle, other than the mitochondria, was rough endoplasmic reticulum, which was present in parallel stacks and concentric arrangements. No premelanosomes or melanosomes were identified. Snap-frozen tumor tissue and RNA from a second case, corresponding to case 1 from the initial description (24), were also examined.
RNA Isolation, cDNA Synthesis, and 5′ RACE.
Poly(A)+ RNA was isolated from the primary tumor according to the manufacturer's recommendations (PolyA Pure; Ambion, Austin, TX). cDNA was generated from 1 μg of RNA (Smart RACE cDNA Amplification Kit, CLONTECH). 5′ RACE was performed with the universal primer mix and three TFEB-specific primers (AS1, 5′-GCA GCT GCT GCT GTT GCT GCT GCT GCT-3′; AS2, 5′-GGT CAT TGG CCT TGG GGA TCA GCA TTC C-3′; and AS3, 5′-CTT GGA CAG GCT GGG GAA TGG GGA GC-3′). To identify the fusion point in the second tumor, cDNA was synthesized from 1 μg of total RNA (Smart RACE cDNA amplification kit) and amplified with an Alpha primer (5′-CCA ATA GAA GGG CAA TGC TTT AGA-3′) and TFEB AS1.
Sequence Analysis.
5′ RACE or RT-PCR products were separated by agarose gel electrophoresis, and novel bands were isolated and cloned (pCR4 Topo; Invitrogen). Several clones were sequenced. PCR products were directly sequenced with an antisense TFEB primer (5′-TCC TCC TGC TGC GCC TGC TCC CGA AT-3′). Sequences were compared by using the blastn search routine (NCBI). Protein homology searches were performed with blastx 2.2.5 (NCBI) and the NCBI conserved domain database and search service, v1.60.
Cytogenetic Analysis.
Cytogenetic analysis was performed by mincing representative portions of the tumor, followed by disaggregation with collagenase. Cell culture and metaphase harvest were performed as described (25). Fluorescence in situ hybridization (FISH) analyses were performed by using bacterial artificial chromosome (BAC) clones flanking the TFEB and Alpha gene loci as identified by the Human Genome Browser (http://genome.ucsc.edu). BAC insert DNAs were isolated and labeled with biotin or digoxigenin by random octamer priming and hybridized to metaphase or interphase tumor cells, as described (26).
Northern Blot and Colony Assay.
One microgram of total or poly(A)+ RNA was separated by 1.5% agarose-formaldehyde gel electrophoresis, transferred to a nylon membrane (Nytran, Amersham Pharmacia), and crosslinked by UV irradiation (GS Gene Linker; Bio-Rad) as described (27). Tumor or multiple tissue Northern blots (FirstChoice Northern Human Blot I, Ambion) were hybridized with radiolabeled probes prepared by random primer annealing and Klenow-directed DNA polymerization in the presence of [α-32P]dATP in Rapid-hyb buffer (Amersham Pharmacia).
Colony assays were performed by using B16 cells as described (28). All transfections contained equivalent amounts of vector (or vector + insert) DNAs in addition to constant puromycin resistance plasmid.
Results
A renal cell carcinoma in a 17-yr-old girl was found to display a karyotype of 46,XX,t(6;11)(p21.1;q12). As shown in Fig. 1, characteristic features included epithelioid cells arranged in acini and papillary-like structures (for additional details see Materials and Methods). Unlike typical papillary renal cell carcinoma, this tumor lacked intracellular brown pigment and foam cells. The absence of cytokeratin and the presence of HMB-45 staining were also unusual for renal cell carcinoma. Electron microscopic examination demonstrated features characteristic of renal cell epithelial origin.
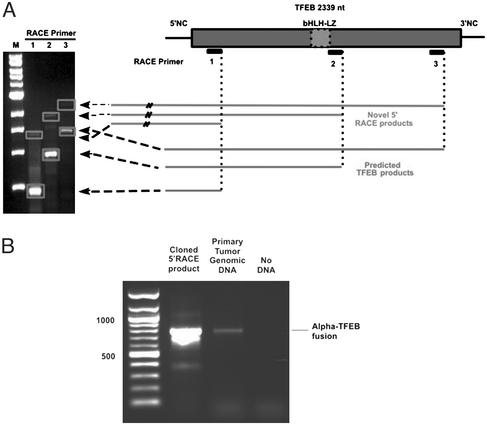
The clinical presentation, histology, immunohistochemistry, and ultrastructural findings were similar to those previously reported in renal tumors associated with the t(6;11) (24). Among the genes present at this location, TFEB was an attractive candidate given its similarity to TFE3, which is implicated in similar tumors. By analogy to known TFE3 fusions, we hypothesized that any functional translocation involving TFEB would likely preserve its bHLH-LZ. We therefore designed three antisense primers, including two that were located 3′ to the bHLH-LZ-encoding region (Fig. 2A). Using these primers, we performed 5′ RACE on cDNA generated from frozen primary tumor material (Fig. 2A). Each reaction yielded a product corresponding to predicted mobility of wild-type TFEB, as well as a novel product with mobility predicting ≈1,000 additional nucleotides 5′ of the most upstream primer. RACE products were cloned and sequenced. In each clone, TFEB exon 2 sequence was identified. Sequence upstream of exon 2 was initially derived from intron 1 of TFEB but then diverged to a sequence with homology to a region on chromosome 11. Given concerns for possible PCR or cloning artifacts, we performed PCR on genomic DNA from the same tumor using primers derived from the novel chromosome 11 sequence and TFEB (Fig. 2B). Genomic PCR yielded an identical product to that from PCR of the RNA-based (RACE-derived) clone.
Figure 2.
(A) cDNA prepared from the index primary renal neoplasm was subjected to 5′ RACE with three antisense primers. Agarose gel electrophoresis reveals RACE products. Predicted PCR products derived from native TFEB message migrate with a smaller molecular weight than the novel PCR products (bands outlined with dotted line). (B) Primary renal tumor genomic DNA as well as cloned RACE product were subjected to PCR with an upstream primer derived from the novel non-TFEB sequence and a downstream primer derived from TFEB. Both DNA samples yielded identically sized PCR products.
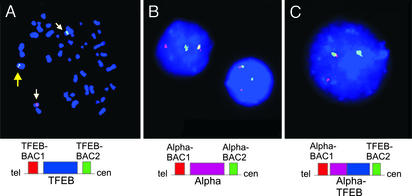
TFEB translocation was corroborated by dual-color FISH using split-apart BAC probes ≈100 kb centromeric (RP11-533O20) and telomeric (RP11-328M4) to the TFEB locus. Metaphase FISH revealed translocation of the telomeric TFEB locus probe to chromosome 11, whereas the centromeric TFEB locus probe was retained on the derivative chromosome 6 (Fig. 3A). Likewise, rearrangement of the chromosome 11 (Alpha) gene locus was confirmed by using probes within 100 kb telomeric (RP11-263H6) and centromeric (RP11-436C17) to that locus (Fig. 3B). Finally, juxtaposition of the TFEB and Alpha loci was demonstrated by dual-color, “bring-together” FISH with TFEB centromeric and Alpha telomeric BACs (Fig. 3C).
Figure 3.
(A) 6p21.1 translocation breakpoint evaluated in t(6;11)(p21.1;q13) metaphase cell by dual-color FISH. BACs telomeric (red) and centromeric (green) to TFEB are separated by the translocation. Yellow arrow indicates overlapping signal from nontranslocated chromosome. (B) 11q13 translocation breakpoint evaluation by using BACs telomeric (red) and centromeric (green) to the Alpha locus. Rearrangement of this locus is shown in each of four interphase tumor cells. (C) Colocalization of TFEB centromeric BAC (green) and Alpha telomeric BAC (red) in tumor interphase cell. Overlapping green and red FISH signals appear yellow when merged.
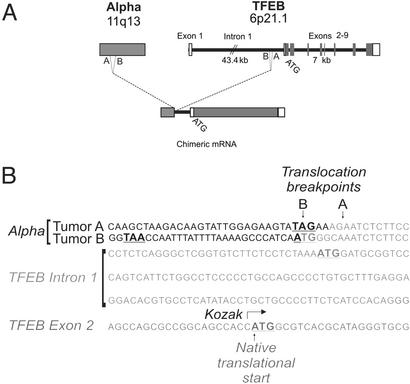
Examination of the chromosome 11 sequence revealed perfect homology with a previously identified gene, Alpha (29, 30), which is fused to the first intron of TFEB (Fig. 4A). Although the TFEB gene extends nearly 50 kb, the first intron comprises over 43 kb. Fig. 4B shows the sequence of the translocation breakpoint. In the index case, an additional adenine and guanine residue are located 5′ of the translocation. The Alpha gene contributes no coding sequence to the TFEB fusion due to an in-frame stop codon located 4 nt before the breakpoint. An in-frame ATG derived from TFEB intronic sequence becomes appended to the TFEB transcript 120 nt 5′ to the normal initiation ATG (in exon 2). However, the intronic ATG completely lacks consensus ribosomal binding sequences (Kozak) (31, 32) whereas the native ATG is flanked by a canonical ribosomal binding site, suggesting that the Alpha promoter likely induces expression of full-length TFEB without intron-derived sequence. Sequence analysis of the 40 aa theoretically encoded by TFEB's intronic upstream ATG fails to detect significant homology.
Figure 4.
(A) Schematic representation of the t(6;11)(p21.1;q13) indicating translocations of the Alpha gene on chromosome 11 into intron 1 of TFEB preserving the entire coding region of TFEB. (B) Sequence of the Alpha-TFEB junctions in the two tumors identifying the translocation breakpoints in TFEB intron 1. In-frame initiation and termination codons are bold. Chromosome 6 sequence is italicized. Nucleotides of unclear origin at the breakpoints are underlined.
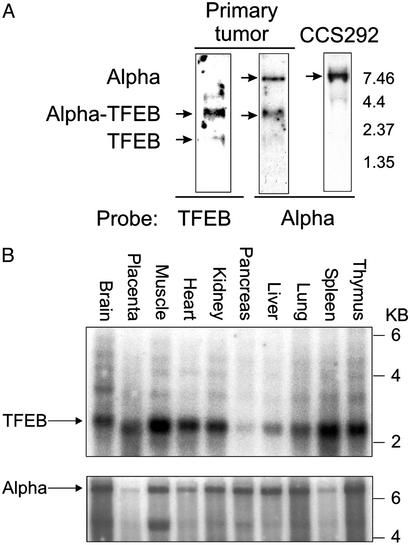
The Alpha gene is on chromosome 11 (29, 30) and produces a 7.5- to 8.5-kb intronless transcript (GenBank accession number AP000769.4). The region of Alpha sequenced in the TFEB fusion corresponds to nucleotides 733-1580 (GenBank accession number AF203815). Northern blot analysis of primary renal tumor poly(A)+ RNA revealed an abundant, identically migrating species using both Alpha and TFEB probes, consistent with its being derived from the Alpha-TFEB fusion (Fig. 5A). The length of this transcript is ≈3.8 kb, suggesting that the complete Alpha message 5′ to the breakpoint is fused to TFEB. A faint band visible at ≈2.3 kb may represent TFEB expressed from the nontranslocated chromosome. Neither the 2.3-kb band nor a faintly hybridizing band at 5.4 kb hybridized with Alpha probe. In addition to the presumed Alpha-TFEB fusion, Northern blot with Alpha probe detects a robust signal matching the predicted size of native Alpha (Fig. 5A) seen in an unrelated tumor cell line (CCS292), as well as additional cell lines and tissues (Fig. 5 A and C, and data not shown). The near-equivalent intensity of the Alpha and Alpha-TFEB fusion bands suggests roughly comparable mRNA abundance.
Figure 5.
(A) Northern blot analysis of primary tumor poly(A)+ RNA probed with TFEB sequence derived from 5′ RACE hybridizes to the Alpha-TFEB fusion. A faint smaller band may correspond to endogenous TFEB message. Primary tumor mRNA hybridized with Alpha sequence derived from the 5′ RACE demonstrates two mRNA species corresponding to the molecular weight of Alpha message and Alpha-TFEB message. In a control cell line (CCS292), hybridization with Alpha reveals an mRNA species with its predicted molecular weight. (B) Multiple tissue Northern blot analysis (prenormalized to GAPDH) for TFEB and Alpha expression demonstrating expression of both genes in all tissues examined.
TFEB and Alpha mRNA expression was examined in multiple human tissues by using commercial (poly(A)+ RNA) Northern blots prenormalized to GAPDH. TFEB was expressed at its predicted size of 2.3 kb in all tissues examined, with particularly strong expression in skeletal muscle (Fig. 5B). TFEB is also clearly expressed in the kidney. Several faintly hybridizing bands were seen at higher molecular weights, possibly reflecting cross-hybridization or alternative spliced forms of TFEB [one of which may be similar to the 5.4-kb species seen in the renal tumor (Fig. 5A)]. Alpha is also expressed in all tissues examined and migrates at the predicted size of 8.5 kb (Fig. 5B). Alpha and Alpha-TFEB transcripts seem to be polyadenylated, given their enrichment by poly(A)+ selection.
We also examined a second renal neoplasm harboring t(6;11)(p21.1;q12), the pathology of which has been described (24). RT-PCR of cDNA derived from this tumor by using an Alpha and a TFEB exon 2 primer resulted in a product (Fig. 4B) again containing fusion of Alpha to the 3′ end of the first intron of TFEB. This translocation occurs 91 bp 3′ of the first tumor's chromosome 11 breakpoint and 5–6 bp 5′ of the first tumor's chromosome 6 breakpoint. The Alpha gene again contributes an in-frame stop codon 25 bp 5′ of the breakpoint. The sequence of the breakpoint itself comprises a possible initiation methionine. However, as was the case in the first tumor, no consensus ribosomal binding site flanks the upstream ATG although, as with the other tumor, intron-derived coding sequences could nonetheless theoretically be appended to the N terminus of native TFEB (although they would not be Alpha-derived).
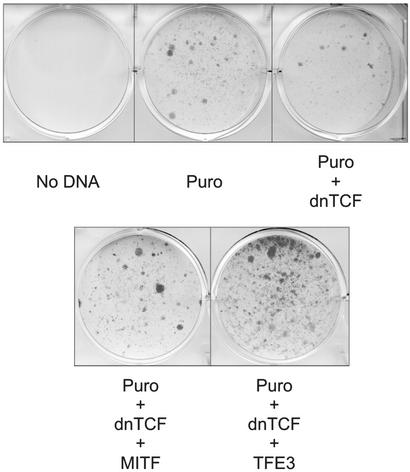
The lack of coding sequence contributed by Alpha suggests that wild-type MiT function, rather than altered fusion protein activities, may modulate tumor growth or survival through dysregulated expression (although it is formally possible that intronic sequences might be translated and potentially alter function). Given the involvement of TFE3 in multiple protein fusions, to examine this hypothesis, we asked whether unfused, wild-type TFE3 might stimulate clonogenic growth of Wnt-suppressed B16 melanoma cells, based on a similar behavior recently observed for constitutively expressed Mitf (28). Introduction of dominant-negative TCF together with puromycin resistance plasmid produced strong suppression of puromycin-resistant colonies, as reported (28). Constitutive expression of either Mitf or wild-type, unfused TFE3 potently rescued clonogenic growth (Fig. 6). Whereas this assay is clearly limited to measuring only specific phenotypic properties (in a nonrenal tumor line), it is nonetheless consistent with the possibility that the primary contribution of MiT factors to tumorigenesis is through altered expression rather than fundamental changes in activity of the transcription factors. Additional studies will be needed to further examine the transforming activity of MiT factors within renal neoplasms.
Figure 6.
Constitutive expression of TFE3 promotes clonogenic growth. B16 melanoma cells were cotransfected with plasmid containing a puromycin resistance gene (Puro) together with either dominant-negative TCF (dn TCF) or dominant-negative TCF and either MITF or TFE3. All transfections contained equivalent amounts of vector (or vector + insert) DNAs in addition to constant puromycin resistance plasmid. After ≈10 days of puromycin selection, plates were washed, fixed, and stained with crystal violet.
Discussion
We report the identification of an Alpha-TFEB fusion in two pediatric renal tumors bearing the recurrent t(6;11)(p21.1;q13). There were several similarities between the index patient in this report and previously reported cases with the same translocation (24). All patients were young (ages 10, 14, and 18) and presented with early stage tumors. It is not known whether the underlying androgenic disorders observed in the index case and one previously described patient contributed to the tumors' inception or growth.
Like previously described renal tumors with t(6;11), this tumor showed polygonal cells primarily arranged in nests separated by capillary-sized vessels. The cytoplasm in all cases ranged from clear to granular and eosinophilic, and the nuclear features were similar. Within acinar lumens, clusters of smaller cells were observed in all cases. All tumors lacked cytokeratin expression and showed focal HMB-45 positivity. Of note, two other renal neoplasms showing t(6;11)(p21;q13) were reported in abstract form as “renal cell carcinoma, clear cell type”; however, these reports lack any pathologic description or follow-up data (33).
Clinicopathologic features of other renal neoplasms with recurrent translocations involving TFE3 have been described (19, 34). These tumors include the “ASPL-TFE3 renal carcinomas” showing t(X;17)(p11.2;q25) (19), and “PRCC-TFE3 renal carcinoma” showing t(X;1)(p11.2;q21) (34). Like the t(6;11) tumors, these neoplasms seem primarily to affect children and young adults. Importantly, the histologic appearance is of a lesion that might previously have been termed papillary renal cell carcinoma. Cytogenetic analysis, however, demonstrates that these are distinctive neoplastic entities.‡‡
Whether this family of renal epithelioid tumors should retain the designation “carcinoma” is potentially questionable because the lesions are sometimes cytokeratin-negative. We prefer the designation carcinoma for these tumors based on their histologic and electron microscopic features, but recognize and emphasize that they differ from most adult carcinomas. It will be useful to distinguish these tumors to better recognize any prognostic or treatment-related differences conferred by the translocations. In this case, the tumors might be called TFEB-associated (or TFE3-associated, or more globally MiT family-associated) renal neoplasms.
The t(6;11)(p21.1;q13) translocation described in this report places the entire ORF of TFEB downstream of the 5′ end of the Alpha gene. TFEB has not previously been implicated in malignancy. The Alpha gene resides near the multiple endocrine neoplasia type 1 locus (29, 36) in a region implicated in chromosomal abnormalities of various other tumors (36). The Alpha gene is unusual in that it is very AT-rich, transcribed in an intronless fashion, and contains no ORF of significant length.
TFE3 is fused to a variety of different partner genes in primary renal neoplasms (37). In every case, the DNA binding region of TFE3 is preserved, suggesting that target gene recognition may be retained. The fusion transcript described in this report contains the entire ORF of TFEB, and the Alpha gene fails to provide any 5′ ORF sequence. An in-frame ATG derived from TFEB intronic sequence lacks a Kozak consensus element, but could nonetheless theoretically append 40 aa to the N terminus of TFEB. It remains to be determined whether such a sequence (if translated) would alter TFEB function measurably. Alternatively, oncogenic activity of the translocation product may arise through dysregulated TFEB expression rather than altered sequence with distinct biochemical activity. Such a possibility is consistent with the preservation of TFE3's DNA binding domain in all known fusions with its multiple partner genes. Although MiT factor expression has not been carefully examined or reported, it is plausible that dysregulation of a normally tightly regulated promoter may result in mistimed transcription factor activity. With striking similarities to TFEB/TFE3, this type of dysregulation is well known for Myc, another bHLH-LZ transcription factor, when it is juxtaposed to the Ig heavy chain enhancer by the t(8;14)(q24;q32) in Burkitt's lymphoma (38–41).
MITF has been found to regulate expression of many melanocytic markers, including tyrosinase, TRP1, and TRP2 (7, 42–44). Recently, MITF was found to directly bind and activate the genes encoding the HMB-45 and Melan-A antigens (35). In the two previously reported renal tumors sharing this chromosomal translocation, both HMB-45 and Melan-A showed strong focally positive staining (24), and HMB-45 staining was also seen in the case described here. Because TFEB and MITF use identical DNA-contacting basic domains, it is plausible that expression of HMB-45 reflects the transcriptional activity of an MiT family member such as TFEB. The histological similarity between this TFEB translocation-associated carcinoma and TFE3 translocation-associated carcinomas suggests that common targets of this family may regulate tumorigenesis. As noted above, genetic evidence for such functional redundancy/overlap between MiT members has been formally demonstrated in the osteoclast lineage for Mitf and TFE3 (8).
Whereas members of the MiT transcription factor family have not been previously identified as oncogenes (outside of TFE3 fusions), a variety of observations are quite consistent with such activity. The related factor Mitf is required not only for melanocytic differentiation, but also for lineage survival. Its loss in mouse or man results in absence of melanocytes (5). Furthermore, among Mitf's potential transcriptional targets is the anti-apoptotic factor BCL2 (14), a factor that may contribute to survival during oncogenesis. Quantitative PCR analysis revealed robust BCL2 expression in one of the tumors reported here (data not shown), although it is unknown whether this level represents overexpression, because the normal cell of origin is unknown.
MITF has also recently been identified as a functionally important downstream target of Wnt/β-catenin in both melanocyte development and melanoma cells (28, 45, 46). In the latter case, disruption of Wnt/β-catenin by dominant-negative TCF resulted in loss of clonogenic growth, which could be rescued by expression of Mitf directed by a heterologous promoter (28). As reported here, in the absence of any fusion partner sequences, wild-type TFE3 expressed by a strong constitutive promoter scored strongly in this assay. Although this experiment does not directly address either oncogenic transformation or renal transformation events, the fact that unfused TFE3 exhibits this activity is consistent with the possibility that the defect in translocated/fused TFE3 relates to misexpression rather than altered biochemical activity (although additional possibilities also exist). Clearly, additional studies will be necessary to more fully examine these mechanisms. It is likely that other cellular events combine with these translocations in the development of an oncogenic phenotype. It will be of interest to see whether additional shared molecular events accompany these clinically related renal tumors exhibiting MiT family translocations.
Abbreviations
- bHLH-LZ
basic helix–loop–helix leucine zipper
- H&E
hematoxylin and eosin
- FISH
fluorescence in situ hybridization
- BAC
bacterial artificial chromosome
Footnotes
Yeh, Y., Vargas, S., Fletcher, J. A. & Perez-Atayde, A. (2002) Modern Pathol. 15, 7P (abstr.).
References
- 1.Beckmann H, Su L K, Kadesch T. Genes Dev. 1990;4:167–179. doi: 10.1101/gad.4.2.167. [DOI] [PubMed] [Google Scholar]
- 2.Roman C, Cohn L, Calame K. Science. 1991;254:94–97. doi: 10.1126/science.1840705. [DOI] [PubMed] [Google Scholar]
- 3.Beckmann H, Kadesch T. Genes Dev. 1991;5:1057–1066. doi: 10.1101/gad.5.6.1057. [DOI] [PubMed] [Google Scholar]
- 4.Carr C S, Sharp P A. Mol Cell Biol. 1990;10:4384–4388. doi: 10.1128/mcb.10.8.4384. [DOI] [PMC free article] [PubMed] [Google Scholar]
- 5.Hodgkinson C A, Moore K J, Nakayama A, Steingrimsson E, Copeland N G, Jenkins N A, Arnheiter H. Cell. 1993;74:395–404. doi: 10.1016/0092-8674(93)90429-t. [DOI] [PubMed] [Google Scholar]
- 6.Zhao G Q, Zhao Q, Zhou X, Mattei M G, de Crombrugghe B. Mol Cell Biol. 1993;13:4505–4512. doi: 10.1128/mcb.13.8.4505. [DOI] [PMC free article] [PubMed] [Google Scholar]
- 7.Steingrímsson E, Moore K J, Lamoreux M L, Ferre-D'Amare A R, Burley S K, Zimring D C, Skow L C, Hodgkinson C A, Arnheiter H, Copeland N G, et al. Nat Genet. 1994;8:256–263. doi: 10.1038/ng1194-256. [DOI] [PubMed] [Google Scholar]
- 8.Steingrímsson E, Tessarollo L, Pathak B, Hou L, Arnheiter H, Copeland N G, Jenkins N A. Proc Natl Acad Sci USA. 2002;99:4477–4482. doi: 10.1073/pnas.072071099. [DOI] [PMC free article] [PubMed] [Google Scholar]
- 9.Hemesath T J, Steingrimsson E, McGill G, Hansen M J, Vaught J, Hodgkinson C A, Arnheiter H, Copeland N G, Jenkins N A, Fisher D E. Genes Dev. 1994;8:2770–2780. doi: 10.1101/gad.8.22.2770. [DOI] [PubMed] [Google Scholar]
- 10.Fisher D E, Parent L A, Sharp P A. Cell. 1993;72:467–476. doi: 10.1016/0092-8674(93)90122-7. [DOI] [PubMed] [Google Scholar]
- 11.Tassabehji M, Newton V E, Read A P. Nat Genet. 1994;8:251–255. doi: 10.1038/ng1194-251. [DOI] [PubMed] [Google Scholar]
- 12.Steingrimsson E, Tessarollo L, Reid S W, Jenkins N A, Copeland N G. Development. 1998;125:4607–4616. doi: 10.1242/dev.125.23.4607. [DOI] [PubMed] [Google Scholar]
- 13.Weilbaecher K N, Motyckova G, Huber W E, Takemoto C M, Hemesath T J, Xu Y, Hershey C L, Dowland N R, Wells A G, Fisher D E. Mol Cell. 2001;8:749–758. doi: 10.1016/s1097-2765(01)00360-4. [DOI] [PubMed] [Google Scholar]
- 14.McGill G, Horstmann M, Widlund H, Du J, Motyckova G, Nishimura E, Lin Y-L, Ramaswamy S, Avery W, Ding H-F, et al. Cell. 2002;109:707–718. doi: 10.1016/s0092-8674(02)00762-6. [DOI] [PubMed] [Google Scholar]
- 15.Sidhar S K, Clark J, Gill S, Hamoudi R, Crew A J, Gwilliam R, Ross M, Linehan W M, Birdsall S, Shipley J, Cooper C S. Hum Mol Genet. 1996;5:1333–1338. doi: 10.1093/hmg/5.9.1333. [DOI] [PubMed] [Google Scholar]
- 16.Weterman M A, Wilbrink M, Geurts van Kessel A. Proc Natl Acad Sci USA. 1996;93:15294–15298. doi: 10.1073/pnas.93.26.15294. [DOI] [PMC free article] [PubMed] [Google Scholar]
- 17.Clark J, Lu Y J, Sidhar S K, Parker C, Gill S, Smedley D, Hamoudi R, Linehan W M, Shipley J, Cooper C S. Oncogene. 1997;15:2233–2239. doi: 10.1038/sj.onc.1201394. [DOI] [PubMed] [Google Scholar]
- 18.Heimann P, El Housni H, Ogur G, Weterman M A J, Petty E M, Vassart G. Cancer Res. 2001;61:4130–4135. [PubMed] [Google Scholar]
- 19.Argani P, Antonescu C R, Illei P B, Lui M Y, Timmons C F, Newbury R, Reuter V E, Garvin A J, Perez-Atayde A R, Fletcher J A, et al. Am J Pathol. 2001;159:179–192. doi: 10.1016/S0002-9440(10)61684-7. [DOI] [PMC free article] [PubMed] [Google Scholar]
- 20.Ladanyi M, Lui M Y, Antonescu C R, Krause-Boehm A, Meindl A, Argani P, Healey J H, Ueda T, Yoshikawa H, Meloni-Ehrig A, et al. Oncogene. 2001;20:48–57. doi: 10.1038/sj.onc.1204074. [DOI] [PubMed] [Google Scholar]
- 21.Weterman M J, van Groningen J J, Jansen A, Geurts van Kessel A. Oncogene. 2000;19:69–74. doi: 10.1038/sj.onc.1203255. [DOI] [PubMed] [Google Scholar]
- 22.Skalsky Y M, Ajuh P M, Parker C, Lamond A I, Goodwin G, Cooper C S. Oncogene. 2001;20:178–187. doi: 10.1038/sj.onc.1204056. [DOI] [PubMed] [Google Scholar]
- 23.Weterman M A, van Groningen J J, Tertoolen L, Geurts van Kessel A. Proc Natl Acad Sci USA. 2001;98:13808–13813. doi: 10.1073/pnas.241304198. [DOI] [PMC free article] [PubMed] [Google Scholar]
- 24.Argani P, Hawkins A, Griffin C A, Goldstein J D, Haas M, Beckwith J B, Mankinen C B, Perlman E J. Am J Pathol. 2001;158:2089–2096. doi: 10.1016/S0002-9440(10)64680-9. [DOI] [PMC free article] [PubMed] [Google Scholar]
- 25.Fletcher J A, Kozakewich H P, Hoffer F A, Lage J M, Weidner N, Tepper R, Pinkus G S, Morton C C, Corson J M. N Engl J Med. 1991;324:436–442. doi: 10.1056/NEJM199102143240702. [DOI] [PubMed] [Google Scholar]
- 26.Xiao S, Renshaw A, Cibas E S, Hudson T J, Fletcher J A. Am J Pathol. 1995;147:896–904. [PMC free article] [PubMed] [Google Scholar]
- 27.Sambrook J, Russell D W. Molecular Cloning: A Laboratory Manual. Plainview, NY: Cold Spring Harbor Lab. Press; 2001. [Google Scholar]
- 28.Widlund H R, Horstmann M A, Price E R, Cui J, Lessnick S L, Wu M, He X, Fisher D E. J Cell Biol. 2002;158:1079–1087. doi: 10.1083/jcb.200202049. [DOI] [PMC free article] [PubMed] [Google Scholar]
- 29.Guru S G, Argarwal S K, Manickam P, Olufemi S-E, Crabtree J S, Weisemann J M, Kester M B, Kim Y S, Wang Y, Emmert-Buck M R, et al. Genome Res. 1997;7:725–735. doi: 10.1101/gr.7.7.725. [DOI] [PMC free article] [PubMed] [Google Scholar]
- 30.James M R, Richard C W, 3rd, Schott J J, Yousry C, Clark K, Bell J, Terwilliger J D, Hazan J, Dubay C, Vignal A, et al. Nat Genet. 1994;8:70–76. doi: 10.1038/ng0994-70. [DOI] [PubMed] [Google Scholar]
- 31.Kozak M. Cell. 1978;15:1109–1123. doi: 10.1016/0092-8674(78)90039-9. [DOI] [PubMed] [Google Scholar]
- 32.Kozak M. Cell. 1986;44:283–292. doi: 10.1016/0092-8674(86)90762-2. [DOI] [PubMed] [Google Scholar]
- 33.Dijkhuizen T, van den Berg E, Storkel S, Geurts van Kessel A, Janssen B, de Jong B. Cancer Genet Cytogenet. 1996;91:141. [Google Scholar]
- 34.Argani P, Antonescu C R, Couturier J, Fournet J C, Sciot R, Debiec-Rychter M, Hutchinson B, Reuter V E, Boccon-Gibod L, Timmons C, et al. Am J Surg Pathol. 2002;26:1553–1566. doi: 10.1097/00000478-200212000-00003. [DOI] [PubMed] [Google Scholar]
- 35. Du, J., Miller, A. J., Widlund, H. R., Horstmann, M., Ramaswamy, S. & Fisher, D. E. (2003) Am. J. Pathol., in press. [DOI] [PMC free article] [PubMed]
- 36.van Asseldonk M, Schepens M, de Bruijn D, Janssen B, Merkx G, Geurts van Kessel A. Genomics. 2000;66:35–42. doi: 10.1006/geno.2000.6194. [DOI] [PubMed] [Google Scholar]
- 37.Bodmer D, van den Hurk W, van Groningen J J, Eleveld M J, Martens G J, Weterman M A, van Kessel A G. Hum Mol Genet. 2002;11:2489–2498. doi: 10.1093/hmg/11.20.2489. [DOI] [PubMed] [Google Scholar]
- 38.ar-Rushdi A, Nishikura K, Erikson J, Watt R, Rovera G, Croce C M. Science. 1983;222:390–393. doi: 10.1126/science.6414084. [DOI] [PubMed] [Google Scholar]
- 39.Nishikura K, ar-Rushdi A, Erikson J, Watt R, Rovera G, Croce C M. Proc Natl Acad Sci USA. 1983;80:4822–4826. doi: 10.1073/pnas.80.15.4822. [DOI] [PMC free article] [PubMed] [Google Scholar]
- 40.Erikson J, Nishikura K, ar-Rushdi A, Finan J, Emanuel B, Lenoir G, Nowell P C, Croce C M. Proc Natl Acad Sci USA. 1983;80:7581–7585. doi: 10.1073/pnas.80.24.7581. [DOI] [PMC free article] [PubMed] [Google Scholar]
- 41.Erikson J, Finger L, Sun L, ar-Rushdi A, Nishikura K, Minowada J, Finan J, Emanuel B S, Nowell P C, Croce C M. Science. 1986;232:884–886. doi: 10.1126/science.3486470. [DOI] [PubMed] [Google Scholar]
- 42.Bentley N J, Eisen T, Goding C R. Mol Cell Biol. 1994;14:7996–8006. doi: 10.1128/mcb.14.12.7996. [DOI] [PMC free article] [PubMed] [Google Scholar]
- 43.Yasumoto K, Mahalingam H, Suzuki H, Yoshizawa M, Yokoyama K. J Biochem (Tokyo) 1995;118:874–881. doi: 10.1093/jb/118.5.874. [DOI] [PubMed] [Google Scholar]
- 44.Yasumoto K, Yokoyama K, Shibata K, Tomita Y, Shibahara S. Mol Cell Biol. 1994;14:8058–8070. doi: 10.1128/mcb.14.12.8058. [DOI] [PMC free article] [PubMed] [Google Scholar]
- 45.Dorsky R I, Raible D W, Moon R T. Genes Dev. 2000;14:158–162. [PMC free article] [PubMed] [Google Scholar]
- 46.Takeda K, Yasumoto K, Takada R, Takada S, Watanabe K, Udono T, Saito H, Takahashi K, Shibahara S. J Biol Chem. 2000;275:14013–14016. doi: 10.1074/jbc.c000113200. [DOI] [PubMed] [Google Scholar]


