

Abstract
We previously showed that murine polyomavirus mutants that lack both middle T (MT) and small T (ST) functions have a severe pleiotropic defect in early and late viral gene expression as well as genome amplification. The respective contribution of MT and ST to this phenotype was unclear. This work separates the roles of MT and ST in both permissive mouse cells and nonpermissive rat cells. It demonstrates for the first time a role for both proteins. To gain insight into the signaling pathways that might be required, we focused on MT and its mutants. The results show that each of the major MT signaling connections, Shc, phosphatidylinositol 3′-kinase, and phospholipase C γ1, could contribute in an additive way. Unexpectedly, a mutant lacking all these connections because the three major tyrosines had been converted to phenylalanine retained some activity. A mutant in which all six MT C-terminal tyrosines had been mutated was inactive. This suggests a novel signaling pathway for MT that uses the minor tyrosines. What is common to ST and the individual MT signaling pathways is the ability to signal to the polyomavirus enhancer, in particular to the crucial AP-1 and PEA3/ets binding sites. This connection explains the pleiotropy of MT and ST effects on transcription and DNA replication.
The early proteins of the small DNA tumor viruses, murine polyomavirus (PYV) and simian virus 40, have been extensively studied as model inducers of cellular proliferation. In contrast, less attention has been paid to their roles in the viral lytic cycle. Early studies of mutations/deletions in middle T antigen (MT) and small T antigen (ST) or in MT-only mutants (hr-t and del mutants) revealed a crucial function in virion maturation and a minor role in DNA replication (21, 22, 27, 58). In a preceding study (10), we demonstrated that, in the genetic background of the commonly used A2 natural isolate, PYV mutants that fail to produce MT and ST undergo a dramatic reduction in both early and late gene transcription. These mutants also exhibit a substantial decrease in genome replication, which could not be simply explained as a result of decreased large T transcription (10). Since both PYV transcription and replication are controlled by the enhancer, the pleiotropic MT/ST effects point to the viral enhancer as a mediator of MT/ST functions. We have been interested in furthering the understanding of PYV MT and ST roles in these lytic functions with the hope of simultaneously gaining insight into their roles in the proliferative response.
The enhancer exerts a cis-acting simultaneous control on early and late gene expression as well as DNA replication (15, 44, 59, 62). Fine mapping of the enhancer has attributed a key role for a 20-bp “α core” subdomain (nucleotides [nt] 5110 to 5130) and its bipartite PEA1/AP-1 and PEA3 binding site and minor roles to additional subdomains that contain, among others, PEA3 and/or c/EBP binding sites (43, 44, 46, 57, 62, 70).
Considerable support can be found for the linkage of MT and to a much lesser extent ST signaling to the activation of AP-1 and PEA3/ets (reviewed in the Discussion). Both AP-1 and PEA3/ets family members are bona fide downstream targets of the MT signaling pathways. Indeed, MT induces a high upregulation of a reporter gene under the control of the PYV bipartite PEA1 and PEA3 binding site, resulting from synergistic actions of AP-1 and PEA3 (65-67). ST has not been similarly tested so far. The convergence of the requirement for AP-1 and PEA3 transcription factors, their simultaneous roles in transcription and replication, and the effects of MT and likely ST downstream signaling on the activation of these factors provide a compelling rationale for a major multifunctional if indirect role for MT (and ST) in viral gene expression and genome amplification, in addition to the previously described role for MT in the maturation process (21-23). Both transcription factors PEA1 (the murine analog of AP-1) and PEA3 (a member of a large family of factors that includes ets proteins) also play key roles in cancer (14). Therefore, the same pathways that are used for lytic infection also serve in transformation by the viral oncogenes.
In the present studies, we sought to further define, separate, and contrast the effects of MT from those of ST, as well as to identify the MT tyrosines that mediate the MT role in lytic infection processes. The results of these experiments considerably expand our understanding of ST and MT functions and reveal additional roles for MT tyrosines than those derived from transformation studies.
MATERIALS AND METHODS
Virus strains.
All mutants were constructed in the A2 genetic background (19). The A185 MTnull/STnull mutant derived from wild-type A2 (WT A2) (38) harbors a 71-bp deletion (nt 646 to 717) in the large T intron (10) and produces only the large T protein. This strain fails to produce the MT and ST mRNAs (reference 10 and findings of this study herein). The six MT carboxy-terminal tyrosines, Y250, Y258, Y288, Y297, Y315, and Y322 (encoded as UAU or UAC) (Fig. 1), were mutated to phenylalanine (UUU or UUC, respectively) one at a time and in serial combinations as listed in Table 1. Mutations were introduced as A→T transitions in primers spanning the corresponding nt 985, 1009, 1099, 1126, 1180, and 1201, using the QuikChange mutagenesis kit (Stratagene). In all six cases, these mutations are neutral in the overlapping large T antigen frame. MT-Ter was constructed with a G→A transversion at nt 825, causing a Glu→ termination at residue 197 in the MT frame. The 196-amino-acid truncated MT protein produced is identical to ST except for the five C-terminal residues (Lys-Arg-Arg-Ser-Glu replacing Ser-Leu-Ser-Pro). This mutation also causes a Gly89→Val change in the LT frame. All mutations were confirmed by sequencing an approximately 600-bp region spanning the mutations. The 1387T mutant, a generous gift from Tom Benjamin, contains a termination codon at nt 1387, lacks a 37-amino-acid C-terminal membrane anchor, and is in a different genetic background (7).
FIG. 1.

Functional map of MT and ST. A linear map of the 421- and 195-amino-acid MT and ST proteins is shown. The landmarks shown are the positions of the MT and ST splice sites; the J-domain and the PP2A and src binding domains; the carboxy-terminal hydrophobic membrane insertion domain; the pS257 binding site for 14-3-3 protein; the positions of the three major tyrosines (underlined), Y250, Y315, and Y322, and their connections to downstream signaling intermediates; and the positions of the three minor tyrosines (dashed underline), Y258, Y288, and Y297.
TABLE 1.
Properties of mutants useda
| MT mutation class | Name | Mutant tyrosine | MT | ST |
|---|---|---|---|---|
| None | WT A2 | None | WT | WT |
| Null | A185 | Null | Null | |
| Trunc | MT-Ter | Trunc/null | WT | |
| Trunc | 1387T | Trunc | WT | |
| Y1F | Y250F | 250 | Mutant | WT |
| Y315F | 315 | M | WT | |
| Y322F | 322 | M | WT | |
| Y2F | Y250/315F | 250 + 315 | M | WT |
| Y250/322F | 250 + 322 | M | WT | |
| Y315/322F | 315 + 322 | M | WT | |
| Y3FM | Y250/315/322F | 250 + 315 + 322 | M | WT |
| Y4F | Y250+/315+ | 258 + 288 + 297 + 322 | M | WT |
| Y250+/322+ | 258 + 288 + 297 + 315 | M | WT | |
| Y315+/322+ | 250 + 258 + 288 + 297 | M | WT | |
| Y5F | Y250+ | 258 + 288 + 297 + 315 + 322 | M | WT |
| Y315+ | 250 + 258 + 288 + 297 + 322 | M | WT | |
| Y322+ | 250 + 258 + 288 + 297 + 315 | M | WT | |
| Y6F | Y6F | 250 + 258 + 288 + 297 + 315 + 322 | M | WT |
| Y3Fm | Y258/288/297F | 258 + 288 + 297 | M | WT |
All mutants produce a wild-type ST except for A185, which is MTnull/STnull. MT-Ter contains a termination codon at residue 197 in the MT frame. The MT protein produced is identical to ST except for its five C-terminal residues (Lys-Arg-Arg-Ser-Glu replacing Ser-Leu-Ser-Pro) and comigrates with authentic ST. In 1387T (7), MT is truncated at amino acid 384. The absence of the carboxy-terminal hydrophobic membrane insertion domain (394 to 421) results in a cytoplasmic location. MT C-terminal tyrosines (Y) were mutated to phenylalanine (F) as described in Materials and Methods. The major (M) tyrosines, Y250, Y315, and Y322, were mutated one at a time (Y1F), pairwise (Y2F), and as a triple combination (Y3FM). The minor tyrosines, Y258, Y288, and Y297, were mutated as a group (Y3Fm). All six tyrosines were mutated simultaneously (Y6F), and the major tyrosines were added back singly, resulting in three quintuple mutants (Y5F) with a single functional tyrosine, or in pairwise combinations as three quadruple (Y4F) mutants with two functional tyrosines.
Virus stocks were grown on NIH 3T3 cells; the lysates were used without purification.
Cells and infections.
A murine NIH 3T3 cell subline (originally from Tom Benjamin's laboratory) was used for the study as well as to grow virus stocks. This line has a functional p53, as it induces the expression of p21 in response to treatment with actinomycin D; however, it is negative for p16 expression. Fischer rat FR3T3 cells were also used. Cells were plated in 60-mm culture plates in Dulbecco's modified Eagle's medium (GIBCO BRL) supplemented with 10% newborn calf serum (GIBCO BRL) up to 25% confluence. Prior to infection, cells were brought into synchrony in the G0 state by lowering the serum supplement to 0.5% for 24 h. Infections were carried out in phosphate buffer (1× phosphate-buffered saline) supplemented with 0.5% serum. After 1 to 2 h, the unadsorbed virus was removed, and cells were washed once with 1× phosphate-buffered saline and refed with medium supplemented with either 10% serum or 0.5% as stated. A multiplicity of infection (MOI) of 10 PFU was used. Since the major focus of these studies concerns transcription and DNA replication, it was important to have the same levels of viral templates in comparisons of different mutants. Thus, the titers of stocks of wild-type and mutant viral strains were matched so that input genome levels were equal. This strategy bypasses problems such as inaccurate titers of the A185 MTnull/STnull small plaque mutant. Genome equivalency was verified in all experiments by assaying genome levels between 4 and 12 h postinfection (hpi). The times given throughout also correspond to times post-release from G0.
Some experimental variability was expected due to the inherent difficulty in controlling for equal inputs in experiments involving a large number of mutants. As previously discussed (10), results for the severity of the defects of mutants in different categories also depended upon variations in host cell “permissivity,” hence, the use of specific cell conditions for infections. All conclusions are based upon at least three independent experiments.
Protein analysis.
Cells were lysed at various times with protein sample buffer (5% sodium dodecyl sulfate [SDS], 0.03% bromophenol blue, 20% glycerol, 5% β-mercaptoethanol, 0.5 M Tris-HCl pH 6.8) and boiled for 5 min. One-third aliquots of the lysates were electrophoresed in 10% polyacrylamide and electroblotted onto polyvinylidene difluoride membranes (Amersham). A polyclonal rat antitumor serum, harvested as ascites fluid, was used as the primary antibody. This antibody recognizes all three early proteins, large, middle, and small T, as well as a few cellular proteins, which can serve as an internal loading control. Goat anti-rat-horseradish peroxidase (Pierce) was used as the secondary antibody. A rabbit anticapsid antibody, a gift from Robert Garcea, was used for the detection of the VP1 capsid protein, with goat anti-rabbit-horseradish peroxidase as the second antibody.
Analysis of viral transcripts.
Infected cells were lysed in TRIzol solution (GIBCO BRL) at various times. Total RNA was extracted with chloroform and precipitated with isopropanol. For Northern blot assays, RNA samples were electrophoresed in a 1% agarose gel containing 2.2 M formaldehyde and transferred to a nylon membrane (Amersham). Probes were labeled either with radioactive [α-32P]dCTP or with digoxigenin as indicated in the figure legends.
To detect early transcripts, a pGEM-1-based plasmid, pG3PyH4, was used, which contains PYV MspI fragment 4 (nt 399 to 1101), cloned between the HindIII and EcoRI sites. The plasmid was cleaved with HindIII, and the T7 RNA polymerase was used to synthesize the anti-early probe. This probe spans the three overlapping early introns and can detect all three early mRNAs, i.e., the 19S MT and ST mRNAs and the 18S large T mRNA, as well as the unspliced precursor and multigenomic early RNAs. To score for late RNAs, sequences spanning nt 3918 to 2928 were inserted between the HindIII and BamHI sites of pSPT18 (Roche Molecular Biochemicals). The plasmid was cleaved with HindIII. This probe detects all major late RNAs, the major 16S VP1 mRNA, and the minor VP2/VP3 mRNAs as it spans the 3′ terminus of the late RNAs, spliced and unspliced, as well as the multigenomic late RNAs.
The strand-specific RNA probes were labeled with digoxigenin using the kit from Roche Molecular Biochemicals, following the instructions from the manufacturer. The hybridizations with digoxigenin-substituted probes were carried out as follows. Blots were prehybridized for 2 h at 68°C in 50% formamide, 5× SSC (1× SSC is 0.15 M NaCl plus 0.015 M sodium citrate), 0.02% SDS, 0.1% N-laurylsarcosine, 2% blocking reagent (Roche Molecular Biochemicals), and then hybridized overnight at 68°C in a hybridization mixture containing digoxigenin-labeled RNA probe. The membranes were washed twice with 2× SSC and 0.1% SDS at room temperature for 15 min each and twice with 0.5× SSC and 0.1% SDS at 68°C for 15 min each time. The membranes were treated with blocking agent solution for 1 h and then with the anti-digoxigenin-alkaline phosphatase, diluted 10,000-fold in blocking buffer for 30 min. After extensive washing, the chemiluminescent phosphatase substrate detection reagent was applied for 1 min and the membranes were exposed to X-ray film.
Genome amplification analysis.
Infected cells were lysed in 10 mM Tris-HCl, 10 mM EDTA, 0.2% SDS (pH 7.6) supplemented with 0.1 μg/ml of proteinase K (Sigma). DNA was extracted with phenol-chloroform. DNA was digested with the restriction endonuclease EcoRI (GIBCO BRL), which has a single recognition site in the PYV genome and linearizes it. Digested DNA was electrophoresed in 1% agarose, stained with ethidium bromide, and blotted onto nylon membranes (Amersham Pharmacia Biotech). Hybridization was carried out at 65°C in 1× Denhardt's solution, 2× SSPE (1× SSPE is 0.18 M NaCl, 10 mM NaH2PO4, and 1 mM EDTA [pH 7.7]) by standard procedures with a 32P-radiolabeled probe containing the whole PYV genomic DNA, labeled with [α-32P]dCTP (3,000 mCi/mmol; New England Nuclear) with a multiprime DNA labeling kit (Amersham). The hybridized blots were washed under stringent conditions. The blots were exposed to X-ray film (Kodak) for a few days at −70°C with an intensifying screen. To quantitate the level of viral genomes, membranes were scanned with a Storm PhosphorImager.
Plaque assays.
NIH 3T3 cells were grown to 80% confluence and infected with virus dilutions for 1 h at 37°C. Infected cells were refed with medium containing 5% serum and 0.9% agar and incubated for 7 days at 37°C. The plates were stained with neutral red. The plaques were counted after a >4-h incubation at 37°C.
Complementation with MT-expressing retroviral vectors.
MT wild-type cDNA introduced in the pLZRS-based Pinco vector (Pinco-MT) was obtained from Luca Primo (24, 28). DrdI-EcoR1 fragments (nt 961 to 1562) from various MT mutants were used to shuttle between PYV or pMex-MT and Pinco-MT. Retroviral stocks were produced by cotransfections of the Pinco vectors and a Moloney virus-based helper plasmid in 293T cells by using Lipofectamine. Stocks were titrated by determining the frequency of green fluorescent protein-positive cells following infection and by quantitating MT protein expression by Western blotting. NIH 3T3 cells were infected with MT retroviruses in the presence of Polybrene and refed with serum containing medium. Twenty hours later, cells were superinfected with the A185 PYV mutant and cells were refed with medium supplemented with 0.5% serum. Samples were taken at 6 and 48 h post-A185 infection for protein, genome, and mature virus quantitation, similarly to what was described for PYV-only infections. In the case of infection with A185 only, equal loading of protein samples is reflected by equal intensities of the cross-reacting cellular bands.
Several other attempts to develop a complementation strategy failed. Stable MT-expressing cell lines were found to be quite resistant to PYV infection (at least strain A2) as previously noted (2, 31, 63), as were inducible cell lines based on constitutive Tet-VP16 expression. We also did not succeed in coinfecting with PYV and adenovirus vectors.
Transformation assays.
Fischer rat FR3T3 cells were set at 2 × 10⁵ cells per 60-mm dish and infected 24 h later at an MOI of 10 PFU/cell. Equivalency of genome input levels was confirmed at or before 24 hpi, as described for infection of NIH 3T3 cells. To assay for focal overgrowth of the monolayers, cultures were maintained in medium containing 5% calf serum that was refreshed every 3 or 4 days. At 14 days postinfection (dpi), monolayers were rinsed, fixed, stained with methylene blue, and photographed. To assay for anchorage-independent growth, infected monolayers were trypsinized 24 hpi and passed into semisolid agar (0.36%) containing Dulbecco's modified Eagle's medium supplemented with 15% calf serum.
RESULTS
MT and ST contributions to viral gene expression.
Given the overlapping MT/ST gene organization of the PYV genome (Fig. 1), examination of the individual contributions of MT and ST in the normal viral context is not straightforward. Such a study would be best carried out with a set of four strains: MT+/ST+, MTnull/STnull, MTnull/ST+, and MT+/STnull. However, the inability to construct strains expressing MT but not ST (MT+/STnull) prevents the examination of MT-only contributions. The contributions of ST and that of MT added to ST can be deduced from comparisons of the first three mutants. For the MTnull/STnull mutant, we used A185 (38) (described in Materials and Methods), in which the deletion eliminates splicing signal, leading to the generation of a single LT-encoding transcript (10) (see below). As an MTnull/ST+ strain in the A2 background, we introduced a termination mutation proximal to the MT splicing acceptor (MT-Ter) as described in Materials and Methods (Table 1). The truncated 196-amino-acid protein produced is as close to ST as possible, but for an altered C-terminal 5 amino acids, and might function like it. Since both ST and truncated MT transcripts are generated in MT-Ter, a twofold elevation in ST levels would be expected. In addition, we used the 1387T MTtrunc/ST+ termination mutant, which produces a 421-amino-acid-long truncated cytoplasmic MT in a different genetic background (7).
Gene expression of these four strains was tested by Western blotting in infections of NIH 3T3 cells carried out in medium supplemented with 0.5% or 10% serum. A representative set of results obtained in early (24 hpi) (Fig. 2A) and late (48 hpi) (Fig. 2B) phases of infection is shown. The pattern of early proteins produced by wild-type A2 was as described previously, with higher LT expression (and earlier [data not shown]) than MT or ST (9). The absence of both MT and ST (A185) resulted in a large decrease in the LT level compared to wild type, as expected from our previous results (10). The presence of ST in MT-Ter and 1387T partially restored this defect, demonstrating ST participation in polyomavirus gene expression. The higher level of gene expression in 1387T relative to MT-Ter was seen in all experiments. We believe that this likely reflects differences in the genetic background of these two strains rather than differences in the residual activities of the two truncated proteins. 1387T was generated in the same genetic background as the hr-t mutants, in which the loss of MT and ST functions does not seem to lead to deleterious effects on gene expression (10), presumably because of the selection of compensatory mutations in large T (39).
FIG. 2.
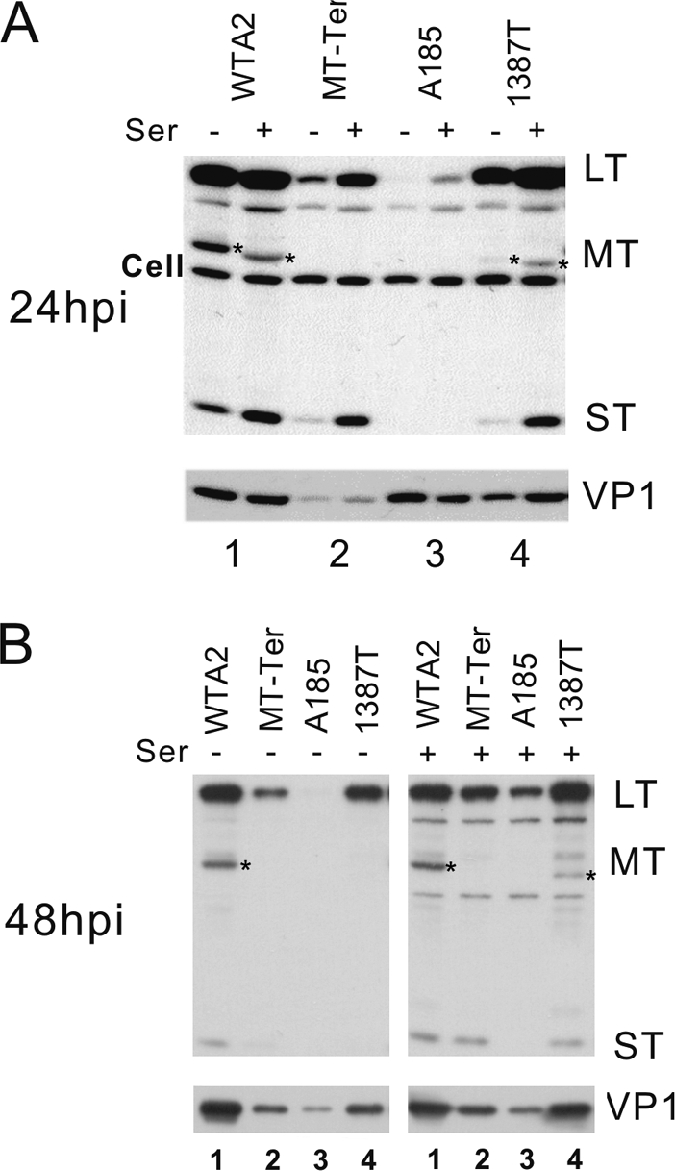
Gene expression patterns of viral strains with MT null and/or ST null mutations. NIH 3T3 cells were infected with equal doses of the wild type and mutants as indicated above the lanes. Doses of input virus genomes were verified by Southern blotting analysis (see Fig. 7, below). Infection and Western blotting conditions are described in Materials and Methods. Infected cells were cultivated in medium containing 0.5% (−ser) or 10% serum (+ser). Protein samples were collected at 24 hpi (A) or 48 hpi (B). The exposure of the blot with the 48-hpi samples was shorter than that for the 24-hpi blot. The positions of LT, MT(*), and ST are indicated on the right. Note the overlap in migration of the MT-Ter and ST proteins and the smaller size of 1387T MT. The antibody used cross-reacts with some cell proteins (Cell bands). The intensity of these cellular bands serves as a loading control. The lighter exposure at 48 hpi failed to reveal the cellular band. The membranes were stripped and reprobed with an antibody for the late capsid protein (VP1). Different arrangements of the samples were chosen to display the 24- and 48-hpi samples. (A) Alternating the results for samples with and without serum highlights the effect of serum factors on viral gene expression. (B) The display of all samples under the same serum treatment condition highlights strain-specific differences in viral gene expression.
Similarly, the expression of the late gene VP1 was severely affected by the absence of MT and ST, while the defect of the ST-producing strains was intermediate. In the case of A185, the late gene expression defect was masked at early times by a high level of input VP1 (Fig. 2A). A185 stocks showed a higher ratio of capsids to genomes in A185 stocks early after infection. This was likely due to a high level of empty capsids, presumably reflecting the maturation defect of A185 (see below). However, the VP1 gene expression defect was revealed at later times, when the capsid level that accumulated in wild-type-infected cells surpassed the A185 input level (Fig. 2B).
Because MT downstream signaling overlaps with that triggered by growth factors (16), we examined the capacity of serum factors to compensate for the gene expression defect(s) caused by the absence of MT and ST. High (10%) serum treatment was most beneficial in complementing the defect of the most deficient mutants, e.g., A185, while not fully compensating for their defect. The magnitude of the serum effect was close to that induced by ST: the LT level in A185 infection in the presence of 10% serum was comparable to that seen in infection of MT-Ter in low serum (compare lanes 3[+] and 2[−] in Fig. 2A and B).
Effects of MT and MT tyrosine mutations in the absence of ST expression.
To examine the specific role of MT and the effect of MT Y→F mutations in the absence of ST signaling, we adopted a complementation strategy in which wild-type or mutant MT was introduced in cells infected with the MTnull/STnull mutant A185. This strategy has a number of advantages. Use of a single viral strain and hence of a single virus stock bypasses unavoidable experimental differences in input levels in infections with many different strains. Furthermore, since MT and/or ST expression was shown to be responsible for the acetylation of virion chromatin (50), the use of a single mutant (A185) eliminates differences in input chromatin structure that may impact gene expression by the parental genomes. Coinfections with MT retroviral vectors and PYV (which to our knowledge had not been tried previously) were very successful. NIH 3T3 cells were first infected with wild-type or mutant MT retroviruses in the presence of serum, followed by infection with PYV MTnull/STnull A185 and withdrawal of serum (to 0.5%) as described in Materials and Methods. The percentage of green fluorescent protein-positive cells was high, suggesting expression of MT in most cells (80 to 100%). Effects on early (LT) and late (VP1) gene expression were determined by Western blotting (Fig. 3). Comparison of LT expression between coinfection with the empty vector and with wild-type MT at 48 hpi demonstrates robust complementation of the A185 defect with wild-type MT, with an ∼5-fold increase in LT level (compare lanes 1 and 2). The level of MT was elevated, since the LT/MT abundance ratio was reversed compared to what is seen in natural infection with wild-type virus (e.g., Fig. 2A and B, lanes 1).
FIG. 3.

Complementation between MT retroviral vectors and the MTnull/STnull A185 mutant virus. NIH 3T3 cells were infected as described in Materials and Methods with retrovirus vectors expressing wild-type or mutant MT or vector control as shown above the lanes (see Table 1 for the mutant naming code). (A and B) Anti-PYV early protein antibody. Cross-reacting cellular bands are marked, as are the LT and MT positions. Results are from 26 h post-retrovirus infection, 6 h post-PYV infection, prior to synthesis of PYV LT (A) or 48 h post-PYV infection (B). (C) Results of blotting with anti-VP1 antibody at 48 hpi.
This assay system and the severity of the effect of the absence of both MT and ST in the A185 mutant (10) provided an ideal situation to examine the role of MT and the contribution of specific tyrosines. Herein, Y250, Y315, and Y322 are referred to as the major (M) tyrosines. As reviewed in the Discussion section, below, these are known to connect MT to the signaling intermediates Shc, phosphatidylinositol 3′ kinase (PI3′-K), and phospholipase Cγ (PLCγ), respectively. Combinations of tyrosine-to-phenylalanine (Y→F) mutations encompassing the three major Y250, Y315, and Y322 tyrosines were generated (see Materials and Methods and Table 1 for mutant construction). Fairly even MT expression was achieved for the various MT mutants, as tested prior to LT synthesis (Fig. 3A) and at 48 hpi (Fig. 3B). These data also demonstrate that no tyrosine MT mutant is particularly unstable, as also tested in a pulse-chase experiment (data not shown). Surprisingly, MT complementation activity was not totally eliminated by mutation of all three major tyrosines, Y3FM (compare lanes 1 and 3 for VP1 or LT). (This is further documented in experiments with genomic Y3FM mutations.)
In view of the result with Y3FM, we considered the possibility that signaling could be mediated by one or more of the remaining C-terminal tyrosines, Y258, Y288, and Y297 (referred to as the minor [m] tyrosines). Although no biochemical functions have been associated so far with them, previous results have shown phosphorylation for at least Y297 (33). In line with the situation for the three major tyrosines, pY297 might provide a phosphotyrosine binding site for a signaling intermediate. Hence, a sextuple mutant (Y6F) was constructed to eliminate contributions from all three minor tyrosines (Table 1). Y6F MT was unable to induce any complementation (compare lanes 1 and 5). The difference in degree of complementation by Y3FM and Y6F MT (lanes 3 and 5) suggests a role for at least one among the minor tyrosines. In contrast, mutating all three minor tyrosines (Y3Fm) did not result in a detectable change compared to wild-type MT (compare lanes 2 and 4). This may reflect the limitation of the assay. A 25% decrease in genome amplification was observed (see “MT and ST effects in genome amplification,” below). In most assays, the effects of mutating Y258, Y287, and Y297 were more pronounced when Y250, Y315, and Y322 were also mutated (comparing Y6F to Y3Fm) than when the latter were wild type (comparing Y3Fm wild type).
To examine the role of each major tyrosine, each was tested one at a time in “add back” quintuple mutants. Each major tyrosine caused an increase in LT expression over that produced by Y6F MT (compare lanes 6, 7, and 8 to lane 5 or 1); similarly, each of the three combinations of two functional major tyrosines showed an increase over single tyrosine-induced complementation (compare lanes 8, 9, and 10 with lanes 6, 7, and 8). The data suggest that each major tyrosine was able to contribute in an additive manner.
The examination of the effect of MT tyrosine mutations on late capsid gene expression was hampered by the high background in VP1 major capsid in A185 infections, presumably due to an excess of empty capsids in the input (i.e., detected prior to initiation of gene expression; see below). However, the lower levels in the empty vector control (Fig. 3C, lane 1) and Y6F MT (lane 5) compared to wild type (lane 2) are indicative of effects on late expression, further demonstrated below. Some difference between Y3FM and Y6F expression on VP1 late gene expression is also visible.
Gene expression defects of MTY→F/ST+ mutants.
Having established a role for the three major tyrosines in complementing the defects of an MTnull/STnull virus, we examined the same issues in the context of viral mutant strains when MT was expressed in cis from the same promoter as LT and ST by alternate splicing of a precursor mRNA. To this end, we introduced combinations of tyrosine-to-phenylalanine (Y→F) mutations encompassing the three major tyrosines, Y250, Y315, and Y322, and three minor tyrosines, Y258, Y288, and Y297, in the A2 genetic background (see Materials and Methods and Table 1). As discussed above, all such mutants express a wild-type ST protein and are thus designated MTY→F/ST+. Comparisons were focused on MTY→F/ST+ mutants relative to wild type (MT+/ST+) on the one hand and to MTnull/ST+ mutants on the other. A representative set of results obtained by Western blotting in early (24 hpi) (Fig. 4A) and late (48 hpi) (Fig. 4B) phases of infection are shown. In the presence of ST, the loss of any single major tyrosine did not lead to a consistent detectable decrease in early gene expression in multiple experiments in NIH 3T3 cells, while the loss of two major tyrosines in combinations involving Y250, especially the Y250/322F combination, resulted in lower gene expression levels (Fig. 4A and B, lanes 9). Surprisingly, the triple mutant Y3FM (Y250/315/322F) showed either no or a smaller defect than Y250/Y322F in most of the NIH 3T3 gene expression tests. This result is in general agreement with findings in early studies that examined the growth of deletion mutants encompassing MT tyrosines (27). The loss of all six C-terminal tyrosines did result in the loss of MT function in gene expression, as the Y6F mutant was found to be close to or equally as defective as the MTnull/ST+ MT-Ter and 1387T mutants in most tests (compare lanes 12 with lanes 2 and 4). As also seen in the complementation experiments described above, Y3Fm did not show a defect in gene expression (data not shown). Not withstanding experimental variations, the relative defects of the various mutants were similar at 24 and 48 hpi, suggesting that most of the effect of MT loss in these mutants was established by 24 hpi. Defects in late gene expression (VP1) showed a good correlation with those seen for early gene expression (Fig. 4A and B), demonstrating effects of MT and ST on both early and late gene expression.
FIG. 4.

Gene expression patterns of viral strains with MT tyrosine mutations. See the legend for Fig. 2 for further information. Lanes 1 to 4 were also shown in Fig. 2. Doses of input virus genomes were verified by Southern blotting analysis (see Fig. 7, below). The exposure of the blot with the 48-hpi samples was shorter than that for the 24-hpi blot. Different arrangements of the samples were chosen to display the 24- and 48-hpi samples. In panel A, alternating the results for samples with and without serum highlights the serum effect on MT migration.
That the defect in Y250/322F in early and late gene expression was of greater magnitude than that seen for Y3FM does not have a simple explanation. Because of its consistency, this finding cannot be solely attributed to experimental variations (see Materials and Methods). This defect was reflected in difficulties in growing Y250/322F viral stocks. It was seen in different stocks from different mutagenesis trials (all confirmed to have the correct MT sequence) and using different mutagenesis strategies, such as changing the order of mutation addition and repairing Y315 in the triple Y3FM mutant. This defect (although less pronounced) was also observed in infections of FR3T3 cells using the same stocks (see below) but not in infection of baby mice (not shown). Although unlikely, it is possible that an additional mutation outside of the MT region was introduced in each mutagenesis process for this mutant. A more likely explanation is that the loss of Y250 and Y322 while retaining Y315 results in an imbalance which leads to cell death, in a cell-specific manner. However, as shown above, this unusual property was not seen when the minor tyrosines were also removed, i.e., in the quintuply mutated MT protein containing only Y315 as a functional tyrosine.
As stated above, serum treatment was most beneficial in complementing the defect of the most deficient mutants, A185, MT-Ter, Y6F, Y250/322F, and Y250/Y315F, while not fully compensating for their defects. In addition, the presence of serum factors resulted in differential MT mobility as demonstrated in Fig. 4A and B, with a faster mobility in the presence of serum factors. The reason behind the intriguing persistent difference in MT migration is unknown. It suggests differences in calf serum factors and MT downstream signaling pathways that affect MT modifications.
In summary, comparisons between these mutant viral strains support the following order for defects in gene expression (from no defect to pronounced defects): WT ≈ Y3Fm, Y1F > Y3FM > Y6F ≥ MT-Ter ≫ A185. These results also determined that the gene expression defect pattern of these mutants is established by 24 hpi, which is close to the “early-to-late” transition.
Timing of appearance of the gene expression defect.
The development of the gene expression defect in the absence of MT and/or ST was further examined. One possible expectation is that the problems of MT- and/or ST-defective mutants become manifest only past the time when these proteins will have been expressed and have exerted their effects in upregulating gene expression in a wild-type infection. To determine this point, a set of wild type and mutants comprised of Y6F, MT-Ter, and A185 were examined from very early times (8 hpi) representing an “immediate-early” phase through the very beginning of the late phase (16 hpi). As can be seen in Fig. 5, LT protein could be detected by 10 hpi in infections with the wild type, while ST and then MT appeared with the previously reported delay, by 12 and 16 hpi, respectively (9). Kinetics studies of the induction of the MT-associated kinase activity place its detection from approximately 14 hpi (data not shown). No delay, or a small 2-h delay, in LT expression was seen with Y6F, A185, and MT-Ter. Furthermore, in contrast to the results at 24 hpi shown in Fig. 2 and 4, no or a minimal defect in LT and ST expression relative to wild type was observed up to 16 hpi for MT-Ter. At that time, Y6F showed only a relatively very small reduction in expression of all three early proteins compared to findings at 24 and 48 hpi. In the case of A185, a defect in LT expression became apparent from about 12 hpi; however, even at 16 hpi, the ratio of wild-type to A185 LT levels was considerably less than that seen at 24 hpi and 48 hpi. This places the onset of MT- and ST-dependent activation of viral gene expression between 16 and 24 hpi. By 16 hpi, the late phase had started, as deduced from the presence new VP1 in wild-type, MT-Ter, and Y6F infections. At a higher serum concentration, the A185 defect in early expression was partially relieved (not shown).
FIG. 5.

“Immediate-early” gene expression pattern of mutants prior to MT and ST protein expression in the presence or absence of serum factors. Cells were infected with wild-type, MT-Ter, Y6F, and A185 strains as described in the legend to Fig. 2. Early proteins produced during the early phase of the infections are shown. Given the low levels of viral proteins at these early times, a long exposure time was required, increasing the intensity of the cross-reacting cellular bands. The LT, MT, and ST bands are marked (*). Results after reprobing the same gel for the late proteins (VP1) are shown.
In contrast, in the case of late gene expression, which is initiated after the establishment of MT and ST signaling pathways, reduction in VP1 expression was immediately obvious in the case of MT-Ter. As noted above, the high level of input VP1 protein in A185 infections masks the onset of late gene expression in this case.
Effects of MT and/or ST mutations on viral transcription patterns.
MTnull/STnull, MTnull/ST+, and the most-defective MTY→F/ST+ mutant (Y6F) were chosen for a comparative analysis of their transcription patterns. As described previously (9) the abundance of transcripts is too low for detection by Northern blotting until immediately prior to or simultaneously with the onset of late gene expression. Thus, a kinetic analysis of early and late transcript accumulation was followed between 16 and 24 hpi. This analysis was carried out in the same experiment shown in Fig. 5, in which early proteins were analyzed at earlier times. Based upon our previous studies carried out under similar conditions (9), the 16- to 24-hpi period spans the “early to late transition,” with the onset of detectability of the early (16 hpi) and late (18 hpi) transcripts by Northern blot analysis, a very large increase in the abundance of both classes of mRNAs, and the onset of viral DNA replication. We chose Northern blot analysis of total RNA, which reveals the presence of giant transcripts. The data are shown in Fig. 6. In the case of early transcripts (Fig. 6A), wild-type transcripts were barely detectable at 16 hpi and their abundance increased substantially between 16 and 24 hpi. As described previously (9), most of the RNA is spliced and bands corresponding to the LT (∼18S) and MT plus ST (∼19S) transcripts (which differ by 14 nt) were detected. By 24 hpi, giant early transcripts were observed (the top of the gel was cut). These results recapitulate previously described patterns, as do those for the A185 mutant, demonstrating a severe defect in early transcription (10). From 18 hpi on, Y6F early transcripts were produced in substantially lower abundance than wild type and only slightly exceeded the level produced by A185. Additionally, no giant transcripts were seen by 24 hpi. As was shown in Fig. 2 and 4, by 24 hpi the Y6F defect in early viral gene expression was evident at the protein level. Perhaps due to the twofold dosage of ST function, MT-Ter early transcripts levels were higher than those seen for Y6F. In the case of the late transcripts (Fig. 6B), these were detected from 18 hpi in wild-type infection, with the inclusion of giant species by 21 hpi. Their very large increase in abundance, as well as their size heterogeneity, has been described previously (1, 9). The extensive deficit of late transcription of the A185 mutant recapitulates previous findings (10). The abundance of the late transcripts in mutant-infected cells followed that seen for the early transcripts. In this case, by 24 hpi the Y6F late transcript levels were clearly higher than A185 transcripts. For both early and late transcripts, the gradation in relative transcript levels was as follows: WT > MT-Ter > Y6F > A185.
FIG. 6.

Transcription patterns. Cells were infected in 0.5% serum with wild-type, MT-Ter, Y6F, and A185 strains as described in the legend to Fig. 5. Samples were taken at the times shown (16 to 24 hpi). Total RNA was extracted and electrophoresed as described in Materials and Methods. The ethidium bromide staining of the gels indicates equivalent loading of 28S and 18S rRNAs in sharp bands and the absence of degradation (not shown). However, the presence of rRNAs results in bulging distortions. The blots were hybridized with digoxigenin-substituted strand-specific RNA probes. (A) The early transcript-specific probe (nt 399 to 1101) detects all early RNAs. (B) The late transcript-specific probe (nt 3918 to 2928) detects all late RNAs. Early transcripts are displayed by sampling time, while late transcripts are displayed by virus strain. The positions of MT and ST (**) and LT (*) transcripts are shown at 18 and 21 hpi. From 21 hpi (wild type) or 24 hpi (mutants), giant late RNAs migrating above the 28S RNA were seen (arrow). The early blot was cut close to the 28S band.
The data demonstrate the capacity of ST and MT in mediating upregulation of transcription. They highlight a temporal progression in the severity of the transcriptional defect in the absence of MT and MT plus ST. Quantitative reverse transcription-PCR analysis of transcripts at early times (8 to 16 hpi) confirmed the finding of no or only minimal defects in transcription at early times in infection, in contrast to the large defects seen at later times (data not shown). This pattern parallels that seen for proteins in Fig. 5, as discussed above.
That there is a small delay (as previously documented [10]) in ST- and MT-mediated upregulation of late compared to early gene expression is likely due to the genome amplification requirement for late gene expression. Thus, the MT- plus ST-dependent upregulation of early gene expression leads to an increase in LT concentration, leading in turn to initiation of genome amplification in cells that are in S phase and, with a delay, initiation of late gene expression by dilution of a presumed late repressor (5, 40).
MT and ST effects in genome amplification.
The genome amplification potential of the same set of mutants whose gene expression patterns were defined in Fig. 4 was examined by Southern blotting in the same experiment. Samples were taken simultaneously of the protein samples, namely, at 24 and 48 hpi. The data for 48 hpi are shown in Fig. 7 along with the input samples, and the quantitation of mutant and wild-type amplification for both 24 and 48 hpi is given in Table 2. Genome amplification defects were detected, and overall mutant-specific loss in gene amplification paralleled their loss in gene expression. The presence of serum factors led to a small relief of the replication defect. The previously described profound defect of A185 is apparent here as well (57-fold) (10). The much smaller defects of MTnull and trunc/ST+ mutants (MT-Ter and 1387T) (range, 3.9- to 5-fold decrease) demonstrate the impact of ST expression. In the case of MT tyrosine mutants, very small decreases in genome amplification accompanied the loss of any single major tyrosine (range, 1.5 to 2.6). Larger defects were observed with double mutants containing the Y250F mutation. Yet, as in the case of gene expression, the defect of the Y3FM triple mutant was similar to that of single mutants. The genome level in Y6F infections was in the same range as that observed for MTnull and trunc/ST+ mutants (MT-Ter and 1387T); its defect was clearly greater than Y3FM.
FIG. 7.
Genome amplification patterns of mutant viruses. NIH 3T3 cells were infected under the conditions described in the legend to Fig. 4. Input samples were harvested at 4 hpi, and experimental time points were simultaneous to times for protein samples shown in Fig. 4, namely, at 24 (data not shown) and 48 hpi. DNA extraction (total DNA) and Southern blot analysis are described in Materials and Methods. Visualization of ethidium bromide-stained total DNA was provided a control for equal loading. All blots were hybridized with the same probe. The quantitation of these blots is given in Table 2.
TABLE 2.
Relative genome amplification patterns of MT mutants in NIH 3T3 cellsa
| Virus | Relative amplification
|
|||
|---|---|---|---|---|
| 24 hpi
|
48 hpi
|
|||
| −ser | +ser | −ser | +ser | |
| A2 | 1 | 1 | 1 | 1 |
| Y250F | 0.6 | 0.6 | 0.3 | 0.6 |
| Y315F | 0.4 | 0.6 | 0.4 | 0.6 |
| Y322F | 0.7 | 0.6 | 0.6 | 0.8 |
| Y315/322F | 0.4 | 0.7 | 0.2 | 0.7 |
| Y250/315F | 0.4 | 0.6 | 0.3 | 0.8 |
| Y250/322F | 0.04* | 0.1 | 0.2 | 0.4 |
| Y3FM | 0.4 | 0.6 | 0.5 | 0.7 |
| Y6F | 0.1 | 0.3 | 0.2 | 0.2 |
| MT-ter | 0.1 | 0.4 | 0.2 | 0.6 |
| 1387T | 0.3 | 0.5 | 0.3 | 0.6 |
| A185 | 0.02 | 0.03 | 0.02 | 0.1 |
NIH 3T3 cells were infected with the mutants listed, as described in the legend to Fig. 4, in medium containing 0.5% serum (−ser) or 10% serum (+ser). As shown in Fig. 7, samples were collected at 4 hpi (input), 24 hpi (not shown), and 48 hpi. Quantitation is based on counts in genome size bands as determined by phosphorimager analysis. In each case, the genome amplification was determined as the ratio of output genome level (at 24 or 48 hpi) relative to the level in the input (4 hpi). In the case of the wild type, these values were 46 (24 hpi, without serum), 48 (24 hpi, with serum), 170 (48 hpi, without serum), and 140 (48 hpi, with serum). These values for the wild type were set at 1.0, and the decreases in the mutant relative to wild-type genome yields are shown for the four conditions. *, this sample was underloaded.
As shown in Fig. 8, the genome amplification defect of A185 was also alleviated by retroviral MT expression. In the absence of MT (empty vector lanes 1), a fivefold amplification of the A185 genome levels was detected by 48 hpi. Expression of wild-type MT led to 31-fold amplification, i.e., a 6-fold increase. Y6F MT was inactive in complementation, while Y3FM showed a weak activity. Each of the single major tyrosines was able to induce at least a twofold increase in genome amplification, and pairs of the major tyrosines induced a fourfold increase. Thus, as shown above for large T expression, use of the A185 genome and the absence of ST allowed the detection of the downstream signaling of each major tyrosine. The contributions of the minor tyrosines were seen both in the decrease between Y3FM and Y6F and in the decrease between WT and Y3Fm. In this experiment, complementation by wild-type MT alone in the absence of ST failed to restore amplification of the A185 genome to the levels seen for a wild-type genome.
FIG. 8.

Effects of retroviral MT complementation on the replication of the A185 MTnull/STnull mutant. Retroviral wild-type and mutant MT were coinfected with PYV A185 as described in the legend for Fig. 3. DNA samples were harvested from the same experiment at 48 hpi and analyzed by Southern blotting as described for Fig. 7. Duplicate samples are shown. The bar graph shows the total amplification calculated as the output/input ratio for each retroviral coinfection, with error bars. The relative amplification between coinfection with the empty vector control and the various wild-type and mutant MTs is given on the top of each bar.
Because PYV genome replication levels are dependent upon LT dosage, the amplification defects caused by MT and MT plus ST mutations could result solely from effects on gene expression. This conclusion is somewhat contrary to the early appearance of the replication defect, at a time when the defect in early gene expression is in the early stages. To examine this point further, we used a cell line derived from NIH 3T3 cells (LT-NIH) that stably expresses high LT levels to show that high levels of LT partially restored replication of mutant genomes (Table 3). The same pattern was obtained in testing the effect of retroviral MT expression on the replication of the MTnull/STnull A185 genome. The complementation could still be demonstrated in LT-NIH. As shown in Table 4, a fivefold increase in the yield of A185 genomes was obtained in LT-NIH 3T3 compared to NIH 3T3 cells, and MT expression increased the yield by 5.6-fold. In this case, a large, 50-fold MT-induced complementation effect was observed in NIH 3T3 cells and, surprisingly, a residual activity was detected in Y6F. A minor Y6F activity was made visible by the large difference between the presence or absence of MT. Complementation of the genome amplification defects of Y6F and A185 was also obtained by coinfection with a wild-type virus with a marked identifiable genome (data not shown). These and other experiments (L. Chen and M. M. Fluck, unpublished data) show that the replication defects of MT and ST mutants are the result of a requirement for MT and ST in enhancer-dependent origin firing in addition to the indirect effect on LT expression.
TABLE 3.
Effect of stable LT expression on genome amplification with mutant infectiona
| Virus | Relative amplification ratio
|
||
|---|---|---|---|
| LT-NIH
|
NIH, 48 hpi | ||
| 24 hpi | 48 hpi | ||
| Wild type | 1 | 1 | 1 |
| MT-Ter | 1.3 | 0.8 | 0.6 |
| Y6F | 0.3 | 0.2 | 0.2 |
| A185 | 0.5 | 0.4 | 0.04 |
NIH 3T3 and LT-NIH cells were infected with the mutants listed, under the conditions described in the legend to Fig. 2. Samples were collected at 24 hpi and 48 hpi and analyzed by Southern blotting as described for Fig. 7. Relative amplification ratios (WT/mutant) were computed as described in footnote a of Table 2.
TABLE 4.
Effect of stable LT expression on A185 genome amplification with retroviral MT complementationa
| Retrovirus | Complementation factor
|
|||||||
|---|---|---|---|---|---|---|---|---|
| NIH coinfected with:
|
LT-NIH coinfected with:
|
|||||||
| No | Empty | WT-MT | Y6F-MT | No | Empty | WT MT | Y6F MT | |
| Out/In | 3 | 3 | 147 | 15 | ND | 15 | 84 | 28 |
| Complementation | 1 | 1 | 50 | 5 | 1 | 5.6 | 1.9 | |
NIH 3T3 and LT-NIH cells were coinfected with A185 and the retroviral MT wild type and mutants listed, under the conditions described in the legend for Fig. 3. Samples were collected at 48 hpi and analyzed by Southern blotting as described for Fig. 8. The complementation factor induced by MT expression is shown.
Deficits in amplification were detectable at 24 hpi (Table 2), i.e., relatively early after the onset of viral replication (which becomes detectable between 16 and 18 hpi) and were not noticeably altered by further rounds of replication in comparisons of the 24- and 48-hpi samples. The absence of an exponential increase in the genome amplification defect fit with many other results (Chen and Fluck, unpublished) that suggest that MT and ST affect origin firing and that a switch to a rolling circle-type, reinitiation-less replication mode takes place in late-stage replication.
Maturation analysis of MTY→F/ST+ mutants.
Previous work demonstrated that MT plays a key role in viral maturation (21, 22). Here we examined the capacity of MT mutants Y3FM, Y6F, and MT-Ter as well as MTnull/STnull A185 to produce mature virions. Data on yields of viral genomes and of mature virions (PFU) are summarized in Table 5. A maturation factor, defined as the ratio of plaque-forming virus per viral genome, was computed, and an arbitrary number of 1.0 was chosen for the wild type. As can be seen, for Y3F, Y6F, and MT-Ter this factor was between 20 and 50% of the wild-type maturation capacity. In contrast, in the case of A185, this maturation potency was only 10% that of the wild type. The examination of capsid protein levels (data not shown) does not account for the more pronounced maturation defect of A185. Rather, this likely reflects the previously reported maturation defect, which has been associated with the underphosphorylation of VP1 (22). This defect may result in an increased production of empty capsids (or pentamers), which are entering into the cells, and can be detected long before late proteins are expressed. Interestingly, the present data showing that MTnull/ST+ mutants had a three- to fivefold less severe maturation defect than MTnull/STnull suggest that ST may also carry out this maturation function. This observation fits with previous results obtained with mutant 1387T (MTtrunc/ST+) (23).
TABLE 5.
Maturation potentials of MT+/ST+, MTnull/ST+, and MTnull/STnull mutantsa
| hpi | Assay | Wild type
|
MT-Ter
|
Y3FM
|
Y6F
|
A185
|
||||||||||
|---|---|---|---|---|---|---|---|---|---|---|---|---|---|---|---|---|
| C | M | T | C | M | T | C | M | T | C | M | T | C | M | T | ||
| 48 | Virus yieldb | 100 | 4.3 | 104 | 18 | 1.9 | 20 | 39 | 6.2 | 45 | —* | 4.5 | —* | .5 | .53 | 1.0 |
| Genome amplificationc | 171 | NA | 171 | 91 | NA | 91 | 330 | NA | 330 | 68 | NA | 71 | 15.3 | NA | 15.3 | |
| Maturation ratio | 0.6 | 0.2 | 0.14 | — | 0.08 | |||||||||||
| Normalized maturation ratioe | 1.0 | 0.3 | 0.2 | — | 0.1 | |||||||||||
| 72 | Virus yieldb | 75 | 55 | 130 | 26 | 39 | 64 | 55 | 92 | 137 | 20 | 45 | 65 | 1.8 | 2.3 | 4.1 |
| Genome amplificationc | 344 | NA | 344 | 310 | NA | 310 | 1140 | NA | 1140 | 411 | NA | 411 | 97 | NA | 97 | |
| Maturation ratiod | 0.4 | 0.2 | 0.1 | 0.2 | 0.04 | |||||||||||
| Normalized maturation ratioe | 1.0 | 0.5 | 0.3 | 0.4 | 0.1 | |||||||||||
NIH 3T3 cells were infected with the indicated virus strains and cultured in the presence of 10% serum. Cell monolayers (C) and medium (M) were harvested at 4, 48, and 72 hpi. The total (T) represents the sum of C and M. *, no data due to contaminated plates. NA, not applicable.
Mature live virus yields were quantitated by plaque assays. Numbers shown represent the yield of PFU per infected cell (ratio of the value at 48 or 72 hpi and the input value).
Viral genomes were quantitated by Southern blotting. Numbers shown represent genome amplification (ratio of the value at 48 or 72 hpi and the value at 4 hpi).
The ratio of mature virus to genome yield, reflecting maturation.
Maturation factor normalized so that wild type = 1.0.
Infection of rat cells and transformation.
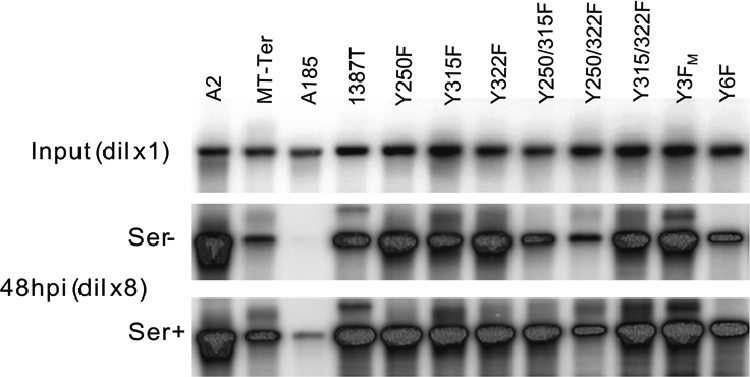
Infections of rat cells (Fischer FR3T3) provided for the test of a second cell line over an extended time course, along with the assessment of the tyrosine mutation effects on cellular phenotypes. Given the semipermissive status of FR3T3 cells for PYV infections (29), effects on the lytic cycle and on cellular transformation can be tracked simultaneously. Gene expression as well as genome replication and maintenance were assayed both at 7 and 14 dpi. Results for 2-week infections are shown in Fig. 9. Variations in input levels quantitated by Southern blotting stayed within a factor 2 (Fig. 9A). Overall, the results appear very similar to those seen for NIH 3T3. Single mutations of the major tyrosines did not have an effect on early gene expression; double mutations (especially Y250 plus Y322) led to a decrease, and the defect of the sextuple mutant was more pronounced than that of the triple mutant Y3FM (Fig. 9A). Similar results were obtained in three independent experiments. Expression of the late VP1 protein showed a similar pattern; however, the relative decrease in the loss of VP1 was more dramatic than that seen in the expression of the early gene products (Fig. 9A). The level of both early and late gene products is expected to be at least partially proportional to the levels of templates. Hence, the genome levels were examined at the same time point; the data are shown in Fig. 9B. As can be seen, viral genomes amplified and persisted at least up to 14 dpi in the infected population. The range of differences between the highest and lowest amplification was less wide than that seen for the same mutants in NIH 3T3. For example, differences in the 100-fold range were seen with the same A185 stock in NIH 3T3 cells compared to a 6- to 10-fold range in FR3T3 cells. This is likely due to the lower overall level of replication in these semipermissive cells. Mutants with the lowest level of genome amplification and/or maintenance, A185, MT-Ter, 1387T, and Y6F, reached a persistence level about twofold higher than the input. Given the original MOI of 10, the persistence level suggests genome levels sufficient for all cells to still be infected at 14 dpi. However, “jackpot” replication (a high level of replication limited to a fraction of the cell population) has been documented in nonpermissive rat cells (29, 71). Thus, some cells may have lost the viral genomes.
FIG. 9.

Gene expression and genome maintenance in semipermissive Fischer rat FR3T3 cells. FR3T3 cells were infected as described in the legend of Fig. 2 with the viral strains indicated on top of the lanes. Infected cells were cultivated in medium supplemented with 5% serum. Protein (A) and DNA (B) samples were collected at 14 dpi and processed as described in the legends for Fig. 2 and 7, respectively. Output DNA samples were diluted twofold compared to input samples.
Cellular transformation was detectable from 8 dpi on and examined at 14 dpi simultaneously to the protein and genome analyses. Infected monolayers were fixed and stained to quantitate the number of transformed foci. Transformed foci were observed in the monolayers infected by the wild type and those infected by Y322F. In the case of Y315F, some weakly staining areas could be distinguished from the background. No distinctly stained area could be observed in the Y250F monolayer. All other monolayers, infected with Y250/315F, Y250/322F, Y315/322F, Y3FM, Y6F, MT-Ter, 1387T, or A185, were indistinguishable from the mock-infected control monolayer (data not shown). Similarly, anchorage-independent transformation was observed for the wild type and to a reduced level with Y322F but was totally absent in infections with all other mutants. Similar results have been described previously for these mutants. Thus, infection of FR3T3 cells is a particularly good system to demonstrate the uncoupling of the role of MT tyrosines in transformation and in the lytic cycle. The most divergent effect is seen in the case of the Y250F mutation. This mutation had no detectable effect on the expression of early and late proteins or the level of genome amplification/maintenance; yet, it is sufficient for a total loss of the transformed phenotype. The uncoupling in the roles of Y250 in lytic cycle versus transformation was also observed in the converse situation. Only the quintuple mutant with active Y250 was able to induce neoplastic transformation (albeit at a reduced level).
DISCUSSION
Our previous investigations of MT and ST lytic functions demonstrated that MTnull/STnull mutants with deletions in the MT and ST coding region have profound defects in both early and late gene expression as well as in DNA replication (10). The primary gene expression defect was manifested by a substantial decrease in the levels of all spliced and unspliced transcripts and, consequently, of their gene products. Such a phenotype is compatible with a defect in transcriptional activation of the early and late promoters. In the present experiments, the effects of ST and MT were tested individually and together. While ST's capacity to stimulate viral DNA replication had been previously documented (3, 42, 47), effects on viral gene expression had not, and MT function had not been examined separately.
ST effects were examined by comparisons of mutant viral strains that express ST only (MTnull/ST+ MT-Ter and 1387T) with the MTnull/STnull A185 strain. ST expression led to an increase in the level of early and late transcripts and gene products as well as in genome levels. Isogenic strains that express both MT and ST (MT+/ST+ wild type) showed a further increase in all three parameters over MTnull/ST+ strains. This indicated a contribution from MT. To study the effect of MT in the absence of ST, a complementation strategy was required. Retroviral MT expression in coinfection with the MTnull/STnull A185 strain resulted in the upregulation of early and late viral gene expression and genome amplification, thus confirming the role of MT. Overall, the results show that the presence of either MT or ST, singly or together, complements the pleiotropic defect of MTnull/STnull mutants.
As summarized in the introduction, cis-acting elements involving at least the AP-1 and PEA3 transcription factor binding sites coordinately regulate viral early and late gene expression and DNA replication. This suggests that the effects of MT and ST are exerted, at least in part, at the level of AP-1 and PEA3/ets activation and that the absence of MT and ST results in a defect in primary transcription. Knowledge of MT and ST signaling pathways support this hypothesis. MT- and ST-dependent activation of ERK1 (and other mitogen-activated protein [MAP] kinases) provides a linkage to the activation of AP-1 and PEA3/ets factors, since the activation of both AP-1 partners c-fos and c-jun family and PEA3/ets members is dependent upon MAP kinases (13, 36, 52, 64). This linkage is better understood in the case of MT signaling. Most MT-dependent functions characterized to date have been linked with its capacity to bind to c-src family tyrosine kinases (11) (Fig. 1). The association leads to constitutive c-src activation and to the phosphorylation of MT tyrosines located in the MT unique C terminus. Biochemical downstream signaling pathways for Y250, Y315, and Y322 have also been characterized, as sketched in Fig. 1 (reviewed in references 16, 26, 34, and 35). pY250 serves as a binding site for the adapter Shc protein, connecting to the activation of the Ras → Raf → MEK plus ERK pathway (6, 17). The phosphotyrosine motif at Y315 provides a binding site for the 85-kDa subunit of PI3′K, resulting in PI3′K activation (12, 69). ERK1 phosphorylation, sustained activation, and nuclear translocation implicate a role for both Y315 and Y250 (60). Cross talk between the Shc and PI3′K pathways may be responsible for this double requirement (48). As for pY322, it binds PLCγ1 (56), presumably leading to protein kinase C activation and hence protein kinase C → Raf-1 → MEK activation (37).
The MT carboxy-terminal tyrosines were examined for their role in the regulation of PYV lytic functions. The tyrosine contributions were difficult to observe in the presence of ST. This may explain why early studies with deletion mutants involving Y315 and Y322 did not detect gene expression defects (27, 53). In contrast, in the complementation assay, each of Y250, Y315, and Y322 could contribute alone to early and late gene viral gene expression and genome amplification, and the signals from each tyrosine were additive. Effects of MT and each MT tyrosine as well as ST always coordinately affected early and late viral gene expression and genome amplification. These results are the first to demonstrate a role for MT tyrosines in viral gene expression and suggest that each tyrosine signals to the PYV enhancer. However, the requirement for Y250 and Y315 in the MT-dependent upregulation of a cellular gene controlled by AP-1 and PEA3, such as urokinase plasminogen activator, has been previously demonstrated (4, 60). These gene induction functions of Y250, Y315, and Y322 are congruent with their known signaling pathways. The functional role of MT tyrosines has been extensively studied previously in relation to neoplastic transformation. These studies revealed a major role for Y250 and lesser or minor roles for Y315 and Y322, respectively (8, 18, 41, 49). While it is likely that the activation of cellular genes controlled by AP-1 and PEA3/ets plays a role in transformation (14), it is interesting that the relative requirement for Y250, Y315, and Y322 in the lytic cycle is very different from that seen in transformation.
Similar to the situation with growth factors, the effect of MT signaling on AP-1 and PEA3 sites is likely to be very complex, involving phosphorylation of c-fos, c-jun, and PEA3/ets/elk proteins by MAP and JNK kinases and transcriptional activation of the c-fos and c-jun (and perhaps PEA3/ets) promoters and, depending upon the intensity of signaling, the Fra-1 promoter as well. Previous work has shown that MT expression leads to the upregulation of the c-jun and c-fos promoters (51, 61), the activation of the elk member of the PEA3 family required for upregulation of the c-fos promoter (61), and the phosphorylation of the c-jun transactivation domain (on Ser63 and Ser73), which depends upon both Y250 and Y315 (55).
Interestingly, the function of MT in upregulating early and late transcription and DNA replication was not eliminated by the mutation of the three major tyrosines. By two independent methods, we found that the annulment of MT activity requires the additional mutation at least one among the three remaining minor tyrosines. Even in the presence of ST, biologically relevant differences between MTY3FM/ST+ and MTY6F/ST+ were observed in virus growth in two cell lines, as described above, as well as in acute and especially in persistent mouse infections (X. Wang and M. M. Fluck, unpublished data). Differences between Y6F and Y3FM MT were also detected in the MT-associated kinase assay (Wang and Fluck, unpublished). Thus, it is likely that at least one among the three minor tyrosines can provide some function in PYV transcription and DNA replication. At least one of them (Y297) is known to be phosphorylated in the MT-associated kinase assay (30). The mechanism of action of this tyrosine(s) remains to be determined. Interestingly, Y258, Y288, and Y297 are embedded in a conserved context (YPXT/S). These sites may serve as binding sites for a novel signaling intermediate, opening the possibility that each of them can carry out a similar function.
The effect of ST on PYV lytic functions suggests that, similarly to MT, ST also signals to the enhancer. Although ST signaling has been less well studied, the link to AP-1 has been established. In the case of PYV, ST-dependent upregulation of c-fos and c-jun transcripts has been reported (25, 45, 72); in the case of the simian virus 40 ST, stimulation of MAP kinases (including MEK, ERK2, and SAPK) was demonstrated along with increased AP-1 activity (20, 32, 54, 68). For ST it is the interaction with PP2A that is important for these functions. Thus, it appears that both ST and MT can signal to AP-1 and PEA3 factors which are crucial for PYV transcription and replication and that these functions are mediated by different pathways, at least partially PP2A dependent in the case of ST and src dependent in the case of MT. Whether the readouts of these pathways on AP-1 and PEA3/ets genes and proteins are partially overlapping and of similar intensity remains to be determined. MT and ST contributions have a graded effect in viral gene expression and DNA replication, with MT plus ST > ST > neither. Preliminary results suggest that the increased effect of MT plus ST compared to ST alone is not simply the result of dosage effect but perhaps a consequence of differences in signaling by these two proteins.
Our kinetic studies demonstrated that the expression of the defective phenotype generated by the absence of MT or of MT and ST is delayed almost to the early-late switch. We assume that this delay reflects the extent of the full establishment of MT and ST signaling pathways. Kinetic studies of the MT-associated kinase activity support this notion. The effects of MT/ST on early gene expression define them as autogenous regulators—regulating their own synthesis—as well as that of other gene products. Furthermore, the lag between the effect on early and late gene expression is likely a consequence of the dependence of late gene expression on the onset of DNA replication.
The present studies highlight the pleiotropic aspects of both MT and ST lytic roles in upregulating both early and late viral gene expression and DNA replication. All three functions were affected by both MT and ST expression and similarly by each MT mutant or mutant combination. This impact of MT/ST is a reflection of the central role of AP-1 and PEA3/ets in the life cycle of PYV, set by the viral bidirectional transcription strategy and the converging position of the two promoters, and the origin of DNA replication.
Acknowledgments
These studies were supported by NIH funds from the National Cancer Institute (CA29270), the MSU Foundation, and the Pardee Foundation.
REFERENCES
- 1.Acheson, N. H. 1978. Polyoma virus giant RNAs contain tandem repeats of the nucleotide sequence of the entire viral genome. Proc. Natl. Acad. Sci. USA 68:4754-4758. [DOI] [PMC free article] [PubMed] [Google Scholar]
- 2.Benjamin, T. L. 1970. Host range mutants of polyoma virus. Proc. Natl. Acad. Sci. USA 67:394-399. [DOI] [PMC free article] [PubMed] [Google Scholar]
- 3.Berger, H., and E. Wintersberger. 1986. Polyomavirus small T antigen enhances replication of viral genomes in 3T6 mouse fibroblasts. J. Virol. 60:768-770. [DOI] [PMC free article] [PubMed] [Google Scholar]
- 4.Besser, D., M. Urich, M. Sakaue, A. Messerschmitt, K. Ballmer-Hofer, and Y. Nagamine. 1995. Urokinase-type plasminogen activator gene regulation by polyomavirus middle-T antigen. Oncogene 11:2383-2391. [PubMed] [Google Scholar]
- 5.Cahill, K. B., A. J. Roome, and G. C. Carmichael. 1990. Replication-dependent transactivation of the polyomavirus late promoter. J. Virol. 64:992-1101. [DOI] [PMC free article] [PubMed] [Google Scholar]
- 6.Campbell, K. S., E. Ogris, B. Burke, W. Su, K. R. Auger, B. J. Druker, B. S. Schaffhausen, T. M. Roberts, and D. C. Pallas. 1994. Polyoma middle tumor antigen interacts with SHC protein via the NPTY (Asn-Pro-Thr-Tyr) motif in middle tumor antigen. Proc. Natl. Acad. Sci. USA 91:6344-6348. [DOI] [PMC free article] [PubMed] [Google Scholar]
- 7.Carmichael, G. G., B. S. Schaffhausen, D. I. Dorsky, D. B. Oliver, and T. L. Benjamin. 1982. Carboxy terminus of polyoma middle-sized tumor antigen is required for attachment to membranes, associated protein kinase activities, and cell transformation. Proc. Natl. Acad. Sci. USA 79:3579-3583. [DOI] [PMC free article] [PubMed] [Google Scholar]
- 8.Carmichael, G., B. S. Schaffhausen, G. Mandel, T. J. Liang, and T. L. Benjamin. 1984. Transformation by polyomavirus is drastically reduced by substitution of phenylalanine for tyrosine at residue 315 of middle-sized tumor antigen. Proc. Natl. Acad. Sci. USA 81:679-683. [DOI] [PMC free article] [PubMed] [Google Scholar]
- 9.Chen, L., and M. M. Fluck. 2001. Kinetic analysis of the steps of the polyomavirus lytic cycle. J. Virol. 75:8368-8379. [DOI] [PMC free article] [PubMed] [Google Scholar]
- 10.Chen, L., and M. M. Fluck. 2001. Role of middle T-small T in the lytic cycle of polyomavirus: control of the early-to-late transcriptional switch and viral DNA replication. J. Virol. 75:8380-8389. [DOI] [PMC free article] [PubMed] [Google Scholar]
- 11.Courtneidge, S. A., and A. E. Smith. 1983. Polyomavirus transforming protein associates with the product of the c-src cellular gene. Nature 303:4345-4349. [DOI] [PubMed] [Google Scholar]
- 12.Courtneidge, S. A., and A. Heber. 1987. An 81 kd protein complexed with middle T antigen and pp60c-src: a possible phosphatidylinositol kinase. Cell 50:1031-1036. [DOI] [PubMed] [Google Scholar]
- 13.Davis, R. J. 1999. Signal transduction by the c-Jun N-terminal kinase. Biochem. Soc. Symp. 64:1-12. [DOI] [PubMed] [Google Scholar]
- 14.Denhardt, D. T. 1996. Oncogene-initiated aberrant signaling engenders the metastatic phenotype: synergistic transcription factor interactions are targets for cancer therapy. Crit. Rev. Oncog. 7:261-291. [DOI] [PubMed] [Google Scholar]
- 15.De Villiers, J., W. Schaffner, C. Tyndall, S. Lupton, and R. Kamen. 1984. Polyoma virus DNA replication requires an enhancer. Nature 312:242-246. [DOI] [PubMed] [Google Scholar]
- 16.Dilworth, S. M. 1995. Polyoma virus middle T antigen: meddler or mimic? Trends Microbiol. 3:31-35. [DOI] [PubMed] [Google Scholar]
- 17.Dilworth, S. M., C. E. Brewster, M. D. Jones, L. Lanfrancone, G. Pelicci, and P. G. Pelicci. 1994. Transformation by polyoma middle T-antigen involves the binding and tyrosine phosphorylation of Shc. Nature 367:87-90. [DOI] [PubMed] [Google Scholar]
- 18.Druker, B. J., L. E. Ling, B. Cohen, T. M. Roberts, and B. S. Schaffhausen. 1990. A completely transformation-defective point mutant of polyomavirus middle T antigen which retains full associated phosphatidylinositol kinase activity. J. Virol. 64:4454-4461. [DOI] [PMC free article] [PubMed] [Google Scholar]
- 19.Fried, M., B. E. Griffin, E. Lund, and L. Robberson. 1974. Polyoma DNA: a study of wild type, mutant and defective DNAs. Cold Spring Harbor Symp. Quant. Biol. 39:45-52. [DOI] [PubMed] [Google Scholar]
- 20.Frost, J. A., A. S. Alberts, E. Sontag, K. Guan, M. C. Mumby, and J. R. Feramisco. 1994. Simian virus 40 small t antigen cooperates with mitogen-activated kinases to stimulate AP-1 activity. Mol. Cell. Biol. 94:6244-6252. [DOI] [PMC free article] [PubMed] [Google Scholar]
- 21.Garcea, R. L., and T. L. Benjamin. 1983. Host range transforming gene of polyoma virus plays a role in virus assembly. Proc. Natl. Acad. Sci. USA 80:3613-3617. [DOI] [PMC free article] [PubMed] [Google Scholar]
- 22.Garcea, R. L., K. Ballmer-Hofer, and T. L. Benjamin. 1985. Virion assembly of polyomavirus hr-t mutants: underphosphorylation of the major capsid proteins VP1 before viral DNA encapsidation. J. Virol. 54:311-316. [DOI] [PMC free article] [PubMed] [Google Scholar]
- 23.Garcea, R. L., D. A. Talmadge, A. Haratz, R. Freund, and T. L. Benjamin. 1989. Separation of host range from transformation functions of the hr-t gene of polyoma virus. Virology 168:312-319. [DOI] [PubMed] [Google Scholar]
- 24.Giraudo, E., M. Arese, C. Toniatti, M. Strasly, L. Primo, A. Mantovani, G. Ciliberto, and F. Bussolini. 1996. IL-6 is an in vitro and in vivo autocrine growth factor for middle T antigen-transformed endothelial cells. J. Immunol. 157:2618-2623. [PubMed] [Google Scholar]
- 25.Glenn, G. M., and W. Eckhart. 1990. Transcriptional regulation of early-response genes during polyomavirus infection. J. Virol. 64:2193-2201. [DOI] [PMC free article] [PubMed] [Google Scholar]
- 26.Gottlieb, K. A., and L. P. Villareal. 2001. The natural biology of polyomavirus middle T-antigen. Microbiol. Mol. Biol. Rev. 65:288-318. [DOI] [PMC free article] [PubMed] [Google Scholar]
- 27.Griffin, B. E., and C. Maddock. 1979. New classes of viable deletion mutants in the early region of polyoma virus. J. Virol. 31:645-656. [DOI] [PMC free article] [PubMed] [Google Scholar]
- 28.Grignani, F., T. Kinsella, A. Mencarelli, M. Valtieri, D. Riganelli, F. Grignani, L. Lanfrancone, C. Peschle, G. P. Nolan, and P. G. Pelicci. 1998. High-efficiency gene transfer and selection of human hematopoietic progenitor cells with a hybrid EBV/retroviral vector expressing the green fluorescence protein. Cancer Res. 58:14-19. [PubMed] [Google Scholar]
- 29.Hacker, D. L., and M. M. Fluck. 1989. Viral DNA synthesis in nonpermissive rat F-111 cells and its role in neoplastic transformation by polyomavirus. Mol. Cell. Biol. 9:648-658. [DOI] [PMC free article] [PubMed] [Google Scholar]
- 30.Harvey, R., B. A. Oostra, G. J. Beelsham, P. Gillett, and A. E. Smith. 1984. An antibody to a synthetic peptide recognizes polyomavirus middle-T antigen and reveals multiple in vivo tyrosine phosphorylation sites. Mol. Cell. Biol. 4:1334-1342. [DOI] [PMC free article] [PubMed] [Google Scholar]
- 31.Hellstrom, I., K. E. Hellstrom, and H. O. Sjogren. 1962. Further studies on superinfection of polyoma-induced mouse tumors with polyoma virus in vitro. Virology 16:282-300. [DOI] [PubMed] [Google Scholar]
- 32.Howe, A. K., S. Gaillard, J. S. Bennett, and K. Rundell. 1998. Cell cycle progression in monkey cells expressing simian virus 40 small T antigen from adenovirus vectors. J. Virol. 72:9637-9644. [DOI] [PMC free article] [PubMed] [Google Scholar]
- 33.Hunter, T., M. A. Hutchinson, and W. Eckhart. 1984. Polyoma middle-sized T antigen can be phosphorylated on tyrosine at multiple sites in vitro. EMBO J. 3:73-79. [DOI] [PMC free article] [PubMed] [Google Scholar]
- 34.Ichaso, N., and S. M. Dilworth. 2001. Cell transformation by the middle T-antigen of polyoma virus. Oncogene 20:7908-7916. [DOI] [PubMed] [Google Scholar]
- 35.Kaplan, D. R., D. C. Pallas, W. Morgan, B. Schaffhausen, and T. M. Roberts. 1989. Mechanisms of transformation by polyoma virus middle T antigen. Biochim. Biophys. Acta 948:345-364. [DOI] [PubMed] [Google Scholar]
- 36.Karin, M. 1996. The regulation of AP-1 activity by mitogen-activated protein kinases. Philos. Trans. R. Soc. Lond. B 351:127-134. [DOI] [PubMed] [Google Scholar]
- 37.Kolch, W., G. Heidecker, G. Kochs, R. Hummel, H. Vahidi, H. Mischak., G. Finkenzeller, G. Marmé, and U. R. Rapp. 1993. Protein kinase Cα activates RAF-1 by direct phosphorylation. Nature 364:249-252. [DOI] [PubMed] [Google Scholar]
- 38.Lania, L., M. Griffiths, B. Cooke, Y. Ito, and M. Fried. 1979. Untransformed rat cells containing free and integrated DNA of a polyoma nontransforming (Hr-t) mutant. Cell 18:793-802. [DOI] [PubMed] [Google Scholar]
- 39.Li, D., K. Dower, Y. Ma, Y. Tian, and T. L. Benjamin. 2001. A tumor host range selection procedure identifies p150(sal2) as a target of polyoma virus large T antigen. Proc. Natl. Acad. Sci. USA 98:14619-14624. [DOI] [PMC free article] [PubMed] [Google Scholar]
- 40.Liu, Z., and G. G. Carmichael. 1993. Polyoma virus early-late switch: regulation of late RNA accumulation by DNA replication. Proc. Natl. Acad. Sci. USA 90:8494-8498. [DOI] [PMC free article] [PubMed] [Google Scholar]
- 41.Markland, W., B. A. Oostra, R. Harvey, A. F. Markham, W. H. Colledge, and A. E. Smith. 1986. Site-directed mutagenesis of polyoma middle-T antigen sequences encoding tyrosine 315 and tyrosine 250. J. Virol. 59:384-391. [DOI] [PMC free article] [PubMed] [Google Scholar]
- 42.Martens, I., S. A. Nilsson, S. Linder, and G. Magnusson. 1989. Mutational analysis of polyomavirus small-T-antigen functions in productive infection and in transformation. J. Virol. 63:2126-2133. [DOI] [PMC free article] [PubMed] [Google Scholar]
- 43.Martin, M. E., J. Piette, M. Yaniv, W. J. Tang, and W. R. Folk. 1988. Activation of the polyomavirus enhancer by murine activator protein 1 (AP1) homolog and two contiguous proteins. Proc. Natl. Acad. Sci. USA 85:5839-5843. [DOI] [PMC free article] [PubMed] [Google Scholar]
- 44.Mueller, C. R., W. J. Muller, and J. A. Hassell. 1988. The polyomavirus enhancer comprises multiple functional elements. J. Virol. 62:1667-1678. [DOI] [PMC free article] [PubMed] [Google Scholar]
- 45.Mullane, K. P., M. Ratnofsky, X. Cullere, and B. Schaffhausen. 1998. Signaling from polyomavirus middle T and small T defines different roles for protein phosphatase 2A. Mol. Cell. Biol. 18:7556-7564. [DOI] [PMC free article] [PubMed] [Google Scholar]
- 46.Muller, W. J., D. Dufort, and J. Hassell. 1988. Multiple subelements within the polyomavirus enhancer function synergistically to activate DNA replication. Mol. Cell. Biol. 8:5000-5015. [DOI] [PMC free article] [PubMed] [Google Scholar]
- 47.Nilsson, S. V., and G. Magnusson. 1983. T-antigen expression by polyoma mutants with modified RNA splicing. EMBO J. 2:2095-2101. [DOI] [PMC free article] [PubMed] [Google Scholar]
- 48.Ong, S. H., S. Dilworth, I. Hauck-Schmalenberger, T. Pawson, and F. Kiefer. 2001. ShcA and Grb2 mediate polyoma middle T antigen-induced endothelial transformation and Gab1 tyrosine phosphorylation. EMBO J. 20:6327-6336. [DOI] [PMC free article] [PubMed] [Google Scholar]
- 49.Oostra, B. A., R. Harvey, B. K. Ely, A. F. Markham, and A. E. Smith. 1983. Transforming activity of polyoma virus middle T antigen probed by site-directed mutagenesis. Nature 304:456-459. [DOI] [PubMed] [Google Scholar]
- 50.Schaffhausen, B., and T. L. Benjamin. 1976. Deficiency in histone acetylation in nontransforming host range mutants of polyoma virus. Proc. Natl. Acad. Sci. USA 73:1092-1096. [DOI] [PMC free article] [PubMed] [Google Scholar]
- 51.Schonthal, A., S. Srinivas, and W. Eckhart. 1992. Induction of c-jun protooncogene expression and transcription factor AP-1 activity by the polyoma virus middle-sized tumor antigen. Proc. Natl. Acad. Sci. USA 89:4972-4976. [DOI] [PMC free article] [PubMed] [Google Scholar]
- 52.Sharrocks, A. D., A. L. Brown, Y. Ling, and P. R. Yates. 1997. The ETS-domain transcription factor family. Int. J. Biochem. Cell. Biol. 29:1371-1387. [DOI] [PubMed] [Google Scholar]
- 53.Smolar, N., and B. E. Griffin. 1981. DNA sequences of polyoma virus early deletion mutants. J. Virol. 38:958-967. [DOI] [PMC free article] [PubMed] [Google Scholar]
- 54.Sontag, E., S. Fedorov, C. Kamibayashi, D. Robbins, M. Cobb, and M. Mumby. 1993. The interaction of SV40 small tumor antigen with protein phosphatase 2A stimulates the map kinase pathway and induces cell proliferation. Cell 75:887-997. [DOI] [PubMed] [Google Scholar]
- 55.Srinivas, S., A. Schonthal, and W. Eckhart. 1994. Polyomavirus middle-sized tumor antigen modulates c-Jun phosphorylation and transcriptional activity. Proc. Natl. Acad. Sci. USA 91:10064-10068. [DOI] [PMC free article] [PubMed] [Google Scholar]
- 56.Su, W., W. Liu, B. S. Schaffhausen, and T. M. Roberts. 1995. Association of polyomavirus middle tumor antigen with phospholipase C-γ1. J. Biol. Chem. 270:12331-12334. [DOI] [PubMed] [Google Scholar]
- 57.Tang, W. J., S. L. Berger, S. J. Triezenberg, and W. R. Folk. 1987. Nucleotides in the polyomavirus enhancers that control viral transcription and DNA replication. Mol. Cell. Biol. 7:1681-1690. [DOI] [PMC free article] [PubMed] [Google Scholar]
- 58.Turler, H., and C. Salomon. 1985. Small and middle T antigens contribute to lytic and abortive polyomavirus infection. J. Virol. 53:579-586. [DOI] [PMC free article] [PubMed] [Google Scholar]
- 59.Tyndall, C., G. La Mantia, C. M. Thacker, J. Favaloro, and R. Kamen. 1981. A region of the polyomavirus genome between the replication origin and late protein coding sequences is required in cis for both early gene expression and viral DNA replication. Nucleic Acids Res. 9:6231-6250. [DOI] [PMC free article] [PubMed] [Google Scholar]
- 60.Urich, M., M. Y. el Shemerly, D. Besser, Y. Nagamine, and K. Ballmer-Hofer. 1995. Activation and nuclear translocation of mitogen-activated protein kinases by polyomavirus middle-T or serum depend on phosphatidylinositol 3-kinase. J. Biol. Chem. 270:29286-29292. [DOI] [PubMed] [Google Scholar]
- 61.Urich, M., M. Senften, P. E. Shaw, and K. Ballmer-Hofer. 1997. A role for the small GTPase Rac in polyomavirus middle-T antigen-mediated activation of the serum response element and in cell transformation. Oncogene 14:1235-1241. [DOI] [PubMed] [Google Scholar]
- 62.Veldman, G. M., S. Lupton, and R. Kamen. 1985. Polyomavirus enhancer contains multiple redundant sequence elements that activate both DNA replication and gene expression. Mol. Cell. Biol. 5:649-658. [DOI] [PMC free article] [PubMed] [Google Scholar]
- 63.Vogt, M., and R. Dulbecco. 1960. Virus-cell interaction with a tumor-producing virus. Proc. Natl. Acad. Sci. USA 46:365-370. [DOI] [PMC free article] [PubMed] [Google Scholar]
- 64.Wasylyk, B., J. Hagman, and A. Gutierrez-Hartmann. 1998. Ets transcription factors: nuclear effectors of the Ras-MAP-kinase signaling pathway. Trends Biochem. Sci. 23:213-216. [DOI] [PubMed] [Google Scholar]
- 65.Wasylyk, C., J. L. Imler, and B. Wasylyk. 1988. Transforming but not immortalizing oncogenes activate the transcription factor PEA1. EMBO J. 7:2475-2483. [DOI] [PMC free article] [PubMed] [Google Scholar]
- 66.Wasylyk, C., P. Flores, A. Gutman, and B. Wasylyk. 1989. PEA3 is a nuclear target for transcription activation by non-nuclear oncogenes. EMBO J. 8:3371-3378. [DOI] [PMC free article] [PubMed] [Google Scholar]
- 67.Wasylyk, B., C. Wasylyk, P. Flores, A. Begue, D. Leprince, and D. Stehelin. 1990. The c-ets proto-oncogenes encode transcription factors that cooperate with c-fos and c-jun for transcriptional activation. Nature (London) 315:191-193. [DOI] [PubMed] [Google Scholar]
- 68.Watanabe, G., A. Howe, R. J. Lee, C. Albanese, I. W. Shu, A. N. Karnezis, L. Zon, J. Kyriakis, K. Rundell, and R. G. Pestell. 1996. Induction of cyclin D1 by simian virus 40 small tumor antigen. Proc. Natl. Acad. Sci. USA 93:12861-12866. [DOI] [PMC free article] [PubMed] [Google Scholar]
- 69.Whitman, M., D. R. Kaplan, B. S. Schaffhausen, L. Cantley, and T. M. Roberts. 1985. Association of phosphatidylinositol kinase activity with polyoma middle-T competent for transformation. Nature 315:239-242. [DOI] [PubMed] [Google Scholar]
- 70.Yoo, W., M. E. Martin, and W. Folk. 1991. PEA1 and PEA3 enhancer elements are primary components of the polyomavirus late transcription initiator element. J. Virol. 65:5391-5400. [DOI] [PMC free article] [PubMed] [Google Scholar]
- 71.Zouzias, D., I. Prasad, and C. Basilico. 1977. State of the viral DNA in rat cells transformed by polyoma virus. II. Identification of the cells containing nonintegrated viral DNA and the effect of viral mutations. J. Virol. 24:142-150. [DOI] [PMC free article] [PubMed] [Google Scholar]
- 72.Zullo, J., C. D. Stiles, and R. L. Garcea. 1987. Regulation of c-myc and c-fos mRNA levels by polyomavirus: distinct roles for the capsid protein VP1 and the viral early proteins. Proc. Natl. Acad. Sci. USA 84:1210-1214. [DOI] [PMC free article] [PubMed] [Google Scholar]