Abstract
The human recombinant α1a-adrenoceptor (AR) has been stably expressed in Chinese hamster ovary cells. Four stable clones, aH4, aH5, aH6 and aH7, expressing 30, 370, 940 and 2900 fmol AR mg−1 protein, respectively, have been employed to characterize this AR subtype using radioligand binding and microphysiometry to measure extracellular acidification rates.
Noradrenaline (NA) gave concentration-dependent responses in microphysiometry with increasing extracellular acidification rates. The potency of NA increased as the receptor density increased; pEC50 values of NA for the clones aH4, aH5, aH6 and aH7 were 6.9, 7.5, 7.8 and 8.1, respectively. This increase of potency according to receptor density indicates the presence of spare receptor for NA. Methoxamine, phenylephrine, oxymetazoline and clonidine also gave concentration-dependent responses with various intrinsic activities.
Antagonists shifted concentration-response curves for NA rightward in a concentration-dependent manner. Schild analysis revealed that the affinity profile of this AR subtype to antagonists in the clone aH7 had a typical pattern for the α1a-AR; high affinity for prazosin and WB 4101, and low affinity for BMY7378 (pA2=9.5, 9.8 and 7.3, respectively). This profile is similar in the case of the clone aH4. These affinities were in good agreement with those obtained in binding experiments.
These results have demonstrated that (1) classical receptor theory can be applied in microphysiometry, and (2) microphysiometry is a useful tool to investigate the pharmacological characterization of α1a-AR.
Keywords: α1-Adrenoceptor, microphysiometer, partial agonist, spare receptor
Introduction
The microphysiometer is a semiconductor-based system which can detect small changes of pH in extracellular fluid accurately (McConnell et al., 1992; Owicki et al., 1990). The extracellular acidification rate (EAR) reflects both the metabolic state of cells through excretion of acidic metabolites such as lactic acid and carbon dioxide and the homeostasis of intracellular pH through the regulation of proton transport across the cytoplasmic membrane (McConnell et al., 1992). Since energy metabolism and pH homeostasis are involved in functional cellular responses triggered by receptor activation, this novel technique provides a new potential method to investigate the functional consequence of activation of varieties of receptors. One of the major advantages of this system is a real-time monitoring of the response of living cells which can be either a primary cell culture from tissues (Ong et al., 1996; Raley et al., 1992; Trafton et al., 1996) or cloned cell lines which express a pure target receptor by molecular biological manipulation. The usefulness of this system has been already reported for several receptors including the β-adrenoceptor (AR) (Owicki et al., 1990), however the study of α1-AR in this system has not been reported.
In this report, we have attempted to apply microphysiometry to pharmacological investigation of α1-AR and have employed the human α1a-AR as an example. We also have aimed to investigate the functional pharmacological characteristics of the α1a-AR in which the affinities for some antagonists are now controversial (Ford et al., 1997). We have shown here that microphysiometry is a useful system to investigate the pharmacological characterization of α1a-AR and that the human α1a-AR shows a typical profile of affinities for antagonists as an α1H-AR, which is defined to have high affinity to prazosin (Flavahan & Vanhoutte, 1986; Muramatsu et al., 1990), in this system.
Methods
Cloning of the human α1a-AR gene
The human α1a-AR cDNA was isolated from a lambda library of human prostate cDNAs (Clontech, lambda gt11) by plaque hybridization using a NcoI fragment of the bovine α1a-AR cDNA (Schwinn et al., 1990) as a probe. An approximately 1500 bp cDNA insert which included the whole coding region of the human α1a-AR was constructed in an expression vector, pCR3 (Invitrogen).
Cell culture and transfection
Chinese hamster ovary (CHO) cells (dhfr−) were grown in alpha Minimum Essential Medium supplemented with 10% foetal bovine serum. The transfection was done using Lipofectamine (Gibco BRL) and the transfected cells were selected and maintained in media containing 500 μg ml−1 G418. Clonal cell lines were obtained by screening of well-isolated G418-resistant colonies for [3H]-prazosin binding.
Radioligand binding assays
The harvested cells were suspended in ice-cold assay buffer (Tris-HCl 50 mM, EDTA 1 mM, pH 7.4), sonicated and centrifuged at 3000×g for 10 min. The supernatant was then centrifuged at 80,000×g for 30 min, and resulting pellet was resuspended in assay buffer and used for binding experiments.
Cell membranes (5–500 μg protein) were incubated in 1 ml volume with various concentrations of [3H]-prazosin for 45 min at 30°C. In competition binding experiments, membranes were incubated with 200 pM [3H]-prazosin and unlabelled drugs for 45 min at 30°C. Nonspecific binding was defined as binding in the presence of 10 mM WB 4101. Reactions were terminated by rapid filtration onto Whatman GF/C filters presoaked in 0.3% polyethyleneimine for 15 min. The filters were then washed four times with 4 ml of ice-cold 50 mM Tris-HCl (pH 7.4) and dried. The filter-bound radioactivity was determined by liquid scintillation counting. Experiments were conducted in duplicate (n=3–4). Binding affinities of drugs were expressed as negative logarithm of the equilibrium dissociation constant (pKi). Protein concentrations were quantified by the method of Bradford using bovine serum albumin as a standard (Bradford, 1976).
Measurement of extracellular acidification rates (EARs)
Cells were seeded into the microphysiometer cups at 200,000 cells per cup, 18–24 h prior to the experiment. On the day of the experiment, a spacer and capsule insert were placed into each cup and the assembled cups were loaded into the microphysiometer chambers in which temperature was kept at 37°C. Low buffering bicarbonate-free RPMI 1640 medium was used as running media in the microphysiometer (Molecular Devices Corp.). Figure 1A shows the raw data of microphysiometer recording which reflect extracellular pH; when pump is perfusing the medium in the chamber the pH remains constant and while the pump is off the pH decreases according to the acid excretion from the cells in the chamber. The EARs were measured in each 90 s pump cycle; flow on at 100 μl min−1 for 60 s, flow off for 30 s and the rates were recorded between 68 s and 88 s in the 90 s cycle, where pH reduction (measured as Δ in microvolts) is almost linear (Figure 1A). Since the basal EAR was reduced markedly in the first few hours (representative trace shown in Figure 1B), we started experiments after the reduction was within 10% in the preceding 21 min. An agonist was added at 21 min intervals for three pump cycles to get responses. Ten μM NA was first added to get a standard response to normalize those for agonists. In antagonist studies, responses to NA were recorded first without antagonist, then the cells were perfused with the media containing antagonists 21 min prior to and throughout the second concentration-response to NA.
Figure 1.
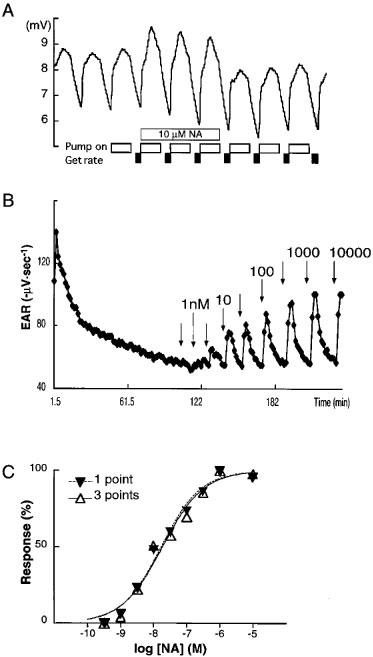
Measurement of EAR in microphysiometry. This is a representative result of experiments in which the clone aH7 was stimulated with NA. (A) Raw data in microphysiometry were shown. An open box indicates the phase of pump on and a closed box indicates the phase of measuring EAR as described under Methods. Cells were stimulated with 10 μM NA as indicated. (B) Cells were stimulated with increasing doses of NA (0.3 nM to 10 μM) and EARs were monitored as described under Methods. Arrows indicate the addition of NA. (C) Concentration-response curves were compared between the highest recording of three stimulation cycles (1 point) and the sum of all recordings in the three cycles (3 points).
EC50 values were calculated, using the curve-fitting program GraphPad PRISM. Concentration-ratio (CR) was calculated by dividing the EC50 value in the presence of antagonist by the EC50 value obtained prior to antagonist administration in the same cup. In control cells (no antagonist throughout recordings), concentration responses always showed almost unity between the first and the second recordings (data not shown). Schild plots were constructed by plotting the log [CR-1] against the log [antagonist], and pA2 values were determined from the intercept (Arunlakshana & Schild, 1959). Data were represented as mean±s.e.mean.
Materials
The following drugs were used: prazosin HCl, (−)-noradrenaline HCl (NA), methoxamine HCl, phenylephrine HCl and oxymetazoline HCl were from Sigma (St. Louis, U.S.A.), WB 4101 (2-(2,6-dimethoxyphenoxyethyl)aminomethyl-1,4-benzodioxane HCl), 5-methyl urapidil and BMY 7378 (8-[2-[4-(2 -methoxyphenyl)-1-piperazinyl]ethyl]-8-azaspiro[4,5]decane-7,9-dione 2HCl) were from Research Biochemicals Inc. (Natick, U.S.A.), RS 17053 (N-[2-(2-cyclopropylmethoxyphenoxy)ethyl]-5-chloro-α, α-dimethyl-1H-indole-3-ethanamine HCl) was from Kissei Pharmaceutical Co. Ltd. (Matsumoto, Japan), tamsulosin HCl (YM 617) was from Yamanouchi Pharmaceutical Co. Ltd. (Tsukuba, Japan), clonidine HCl was from Boehringer Ingelheim Japan (Kawanishi, Japan), [3H]-prazosin (77.2 Ci mmol−1) was from NEN (Boston, U.S.A.).
Results
The binding affinities (pKi) of chemicals tested in the clones aH4 and aH7 are summarized in Tables 1 and 2. These data are in good agreement with those reported previously (Graham et al., 1996; Suzuki et al., 1997) as a typical profile of the human α1a-AR.
Table 1.
Affinity estimates from radioligand binding experiments and potency estimates from microphysiometry analyses in the clones aH4 and aH7

We selected four clones (aH4, aH5, aH6 and aH7) which stably expressed the human α1a-AR at various densities (30±8, 370±70, 940±40 and 2900±570 fmol AR mg−1 protein, respectively) with similar affinity for NA (pKi=5.8±0.1, 5.6±0.1, 5.6±0.1 and 5.8±0.1, respectively) for microphysiometry. In all four clones, basal EARs for the density 200,000 cells per cup were between 40 and 80 μV.s−1, and the basal and NA-stimulated EARs were proportional to the cell density from 30,000 to 1,000,000 cells per cup (data not shown).
Representative responses to NA in the clone aH7 are shown in Figure 1. Since the peak response was always within three cycles of stimulation of any agonist tested in all four clones (data not shown), we employed three cycles for the recording. Because either the highest recording or sum of the all recordings during the three cycles gave similar concentration-response curves as shown in Figure 1C, we used the highest one for the construction of concentration-response curves hereafter. NA caused concentration-dependent increases of EAR in all four clones. Maximum increases of EARs were 0.39±0.02, 0.71±0.07, 0.75±0.04 and 0.65±0.02 fold over the baselines for the clones aH4, aH5, aH6 and aH7, respectively. As shown in Figure 2, the potency of NA to elicit EAR responses in these clones increased as the receptor density increased; pEC50 values were 6.9±0.1, 7.5±0.2, 7.8±0.1 and 8.1±0.1, and Hill slopes were 1.2±0.2, 0.8±0.3, 1.4±0.4 and 0.8±0.1 in aH4, aH5, aH6 and aH7, respectively (Table 1). Although the slopes did not significantly deviate from unity in computing, some of the response curves in the clones appear to be biphasic, especially in the clone aH7. Since this kind of skewed response of the clone aH7 was also seen in the responses to other agonists as described below, and since this was not observed in the clone aH4 which expressed less AR, comparable to natural tissues, we speculated that one of the reasons for the apparently biphasic response is overexpression of AR. This point is further discussed in Discussion section.
Figure 2.
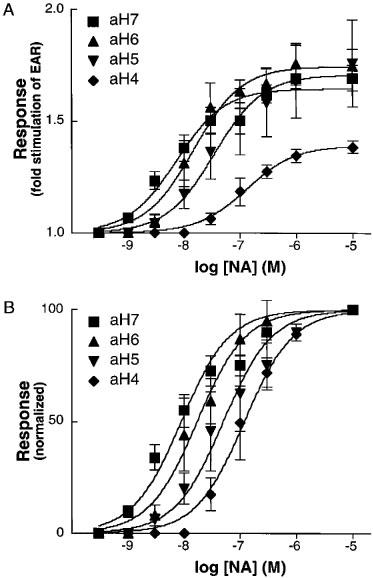
Concentration responses and receptor density. The increases of EARs were plotted against log [NA] as a ratio of EARs before and after stimulation (A), or as a percentage of the increase of EAR at 10 μM NA (B). Four clones (aH4, aH5, aH6 and aH7) were analysed based on 3–4 independent experiments as described under Methods.
Using the clones aH4 and aH7, we tested four agonists, methoxamine, phenylephrine, oxymetazoline and clonidine, in microphysiometry. As shown in Figure 3, all four agonists evoked concentration-dependent increase in EARs. Maximum increases of EARs as percentages of those at 10 μM NA stimulation in the clone aH4 and aH7, respectively, were 109±5 and 95±2% for methoxamine, 105±3 and 100±3% for phenylephrine, 88±4 and 81±3% for oxymetazoline, and 63±5 and 64±2% for clonidine. The latter two drugs showed significantly lower intrinsic activity than the former two which had similar intrinsic activity to NA. This suggests that the latter two are partial agonists. In the case of the clone aH7, Hill slopes were significantly lower than unity for methoxamine and phenylephrine (Figure 3 and Table 1).
Figure 3.
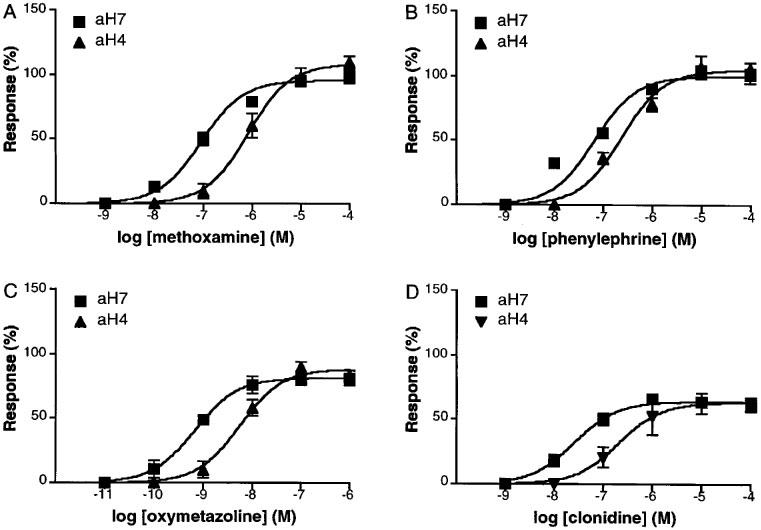
Concentration responses of α1a-AR to methoxamine (A), phenylephrine (B), oxymetazoline (C), and clonidine (D) in microphysiometry. Two clones (aH4 and aH7) were analysed based on 3–5 independent experiments. The responses were shown as a percentage of the increase of EAR at 10 μM NA in each clone.
The affinity and potency of these agonists against the clones aH4 and aH7 are shown in the Table 1. Comparing these potency values of the human α1a-AR with the affinity obtained in binding experiments, there were also spare receptors for these agonists. Interestingly, however, the amount of spare receptor varied among these drugs. The response/occupancy relationship of the agonists tested was depicted in Figure 4. In the case of NA, the clone aH4 which expressed the least amount of AR still showed significant spare receptor, in contrast the clone aH4 had little spare receptor for oxymetazoline.
Figure 4.
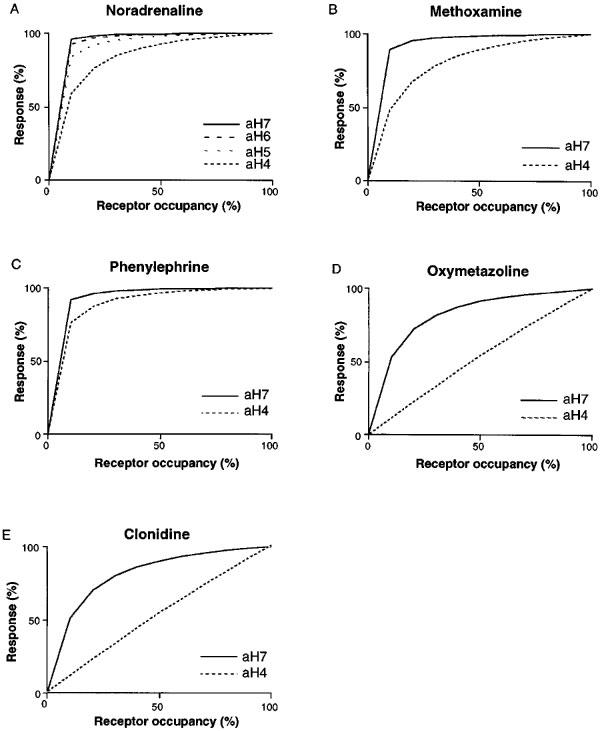
Relationship between receptor occupancy and response in: NA (A) methoxamine (B), phenylephrine (C), oxymetazoline (D), and clonidine (E) stimulation. Receptor occupancy for the agonists was calculated from Ki values obtained in binding experiments and the response at the corresponding agonist concentration was estimated from the concentration-response curves. The maximum response was taken as 100% in each clone.
The effect of AR antagonists on EAR response to NA was analysed. The mean data of the results is shown in Figure 5, in which prazosin shifted concentration-response curves for NA in the clone aH7 rightward in a concentration-dependent manner. Schild analysis revealed that the slope was close to unity for all antagonists tested (Table 2). These affinities for the antagonists were similar in the clones and were in good accordance with those obtained in binding experiments (Table 2). In the clone aH7, the concentration-response curve to NA also exhibited apparently biphasic pattern in the presence of prazosin (Figure 5A), although computer analysis did not always reveal a significant deviation from unity.
Figure 5.
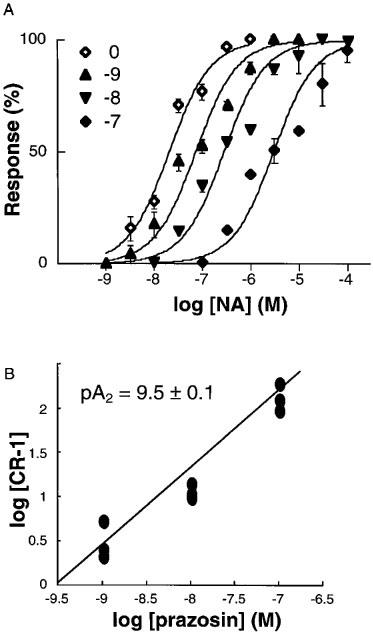
Schild regression analysis for prazosin in the clone aH7. The results of prazosin antagonism of NA-stimulated EAR increase (A) was shown based on three independent experiments. CRs were obtained and the Schild plot was constructed (B) as described under Methods.
Table 2.
Affinity estimates from radioligand binding experiments and from microphysiometry analyses in the clones aH4 aH7

Discussion
Classically, the functional study of α1-ARs has been carried out measuring contractions of smooth muscle strips in a Magnus chamber. Although it has been an established methodology, many factors affect the outcome; removal of drugs by uptake or degradation (Burt et al., 1995) and secondary reactions derived from cells other than smooth muscle cells (Furchgott & Zawadzki, 1980) may be able to influence the results. One of the major drawbacks is the difficulty to get a sample that expresses a pure target subtype of ARs; sometimes distinct receptors which can be activated by the same agonist coexist, leading to a complexity in the analysis (Muramatsu et al., 1998; Van-der-Graaf et al., 1996).
Recently, α1-AR functions have been evaluated in clonal cell lines which express a certain type of α1-ARs by molecular biological manipulations, measuring second-messengers such as inositol trisphosphate (IP3) and/or Ca2+ (Minneman et al., 1994; Theroux, et al., 1996). However, one receptor does not always couple to only one second messenger system but often relays signals through more than two systems (Kenakin, 1996) among which affinity to some chemical may be different. In microphysiometry the response is evaluated as the change of the cellular ability to acidify the microenvironment. Thus, the response detected in this system is not dependent on a single signalling pathway but is the integrated response as the cellular function. In addition, the response can be measured in the same sample repeatedly, giving more reliable data.
On the other hand, microphysiometry has limitations, too. For example, reductions of basal EAR are marked in the beginning of perfusion (Figure 1B) and it takes a long time to get stable basal EARs, sometimes more than 4 h while the responsiveness of the cells are lost in the chamber because the environment is relatively unsuitable for the cells. The accumulation of agonist or antagonist in the chamber is also a possible limitation. One of the biggest limitations is a time course in EAR recording. The raw data are in fact a real time recording as shown in Figure 1A, but the recording of EAR is not. We tried to investigate detailed time course of EAR responses in the preliminary experiments. However, poor reproducibility and high variability hampered the analysis. We employed a protocol which has three cycle recordings every 1.5 min in this study but we think this needs further investigation in the future.
Intracellular pH is strictly controlled in a narrow range and various molecules are known to be involved in this regulation, including sodium/proton exchanger, proton channels and pumps (McConnell et al., 1992). Although it is not clear how and by what intracellular pH is regulated in the CHO clones used in this study, it is known that sodium/proton exchanger, which exists in CHO cells (Rotin & Grinstein, 1989), participates in proton excretion following α1-AR stimulation via Ca2+ recruitment and/or protein kinase C activation (Orlowski & Grinstein, 1997; Wakabayashi et al., 1997). This antiporter constitute a family with several isoforms which have different kinetic property in the modulation of their function (Orlowski & Grinstein, 1997; Wakabayashi et al., 1997). This versatility of sodium/proton exchanger family may cause complex response in microphysiometry. As seen in Figures 2, 3 and 5A, the response curves sometimes show biphasic pattern. One possible explanation is that an engineered cell system may affect cellular responses, such as promiscuous coupling of the receptor to intracellular signalling systems (Horie et al., 1995) and/or constitutive activation of the receptor (MacEwan et al., 1995) especially when the receptor is overexpressed. Actually, apparently biphasic response is the more obvious, when the clones express the larger amount of AR (Figures 2, 3 and 5A). Thus, promiscuous coupling to multiple pathways of proton excretion may lead to complex response in microphysiometer. Another possible explanation of this apparently biphasic response is a mechanism of pH homeostasis of the cell which may counteract receptor activation, suppressing net proton excretion to affect the total cellular response in microphysiometer particularly at high receptor density and/or agonist concentration. Keeping these points in mind, further evaluation should be done for microphysiometry.
In this study, we compared the apparent affinity of several agonists to α1a-AR clonally expressed in CHO cells with varying receptor density. Although the binding affinity did not change significantly, the potency of NA increased as the receptor density increased, revealing that there is increased receptor reserve with increasing AR density (Figures 2, 3 and 4 and Figure 1). The agonists were able to be classified into full and partial agonists based on the maximum response; methoxamine and phenylephrine showed comparable maximum responses with NA but oxymetazoline and clonidine exhibited lower intrinsic activity than NA (Figure 3). These characteristics are basically similar to those reported previously (Graham et al., 1996; Minneman et al., 1994). However, in our observation relative Emax of partial agonists did not change as their potency values increased. This is contrary to what would be expected that increase in the maximum response seen with a partial agonist relative to that with a full agonist should occur prior to a leftward shift in the concentration-response curve as receptor density increases. The reason is not clear, however, Perez et al. (1996) reported similar operational peculiarity of imidazoline agonist. It is possible that the imidazoline agonists display slower kinetics than the phenethylamines and that apparent low intrinsic activity merely reflects inadequate time for equilibration and expression of efficacy. Another explanation may be kinetic proofreading which hypothesizes multiple steps for receptor to complete to emit major signals to induce full cellular response (McKeithan, 1995). In this model, partial agonists that have higher dissociation rate can hardly form the final conformation of receptor to generate signal. These need further investigation in future.
We also analysed the inhibitory behaviour of several antagonists, showing the rightward shift of the concentration-response curve to NA which was analysed in Schild plot (Figure 5 and Table 2). The affinities of antagonists to the human α1a-AR showed a good agreement with those obtained in binding experiments. However, it has been recently reported that some antagonists, including prazosin, WB 4101, RS 17053 and 5-methyl urapidil, exhibit ten times lower affinities in IP3 formation than in binding experiments to the human α1a-AR (Ford et al., 1997), proposing that in functional experiments the α1a-AR displays the pharmacological profile as the α1L-AR, which is defined to have low affinity to prazosin (Flavahan & Vanhoutte, 1986; Muramatsu et al., 1990). This discrepancy may arise from the differences between assay systems used or derive from the distinct signalling in increasing EAR. Further investigation is required to clarify these points and to establish the identity of α1L-AR.
In conclusion, microphysiometry reveals a concentration-dependent increase of EAR in CHO cells which stably express the human α1a-AR and the EAR can be assessed by classical pharmacological analyses. Microphysiometry is a useful tool to investigate the pharmacology of α1-AR and the human α1a-AR shows a high affinity to prazosin comparable with that obtained in binding experiments, showing a typical profile as α1H-AR.
Acknowledgments
The authors would like to thank Ms N. Aoki for secretarial assistance and Ms N. Saito for technical assistance. This work is supported in part by grant from the Smoking Research Foundation of Japan and by Grant-in-Aid for Scientific Research (09273105, 09470023 and 10670135) from the Ministry of Education, Science, Sports and Culture of Japan.
Abbreviations
- AR
adrenoceptor
- CHO
Chinese hamster ovary
- CR
concentration-ratio
- EAR
extracellular acidification rate
- IP3
inositol trisphosphate
- NA
noradrenaline
References
- ARUNLAKSHANA O., SCHILD H.O. Some quantitative uses of drug antagonists. Br. J. Pharmacol. 1959;14:48–58. doi: 10.1111/j.1476-5381.1959.tb00928.x. [DOI] [PMC free article] [PubMed] [Google Scholar]
- BRADFORD M.M. A rapid and sensitive method for the quantitation of microgram quantities of protein utilizing the principle of protein-dye binding. Anal. Biochem. 1976;72:248–254. doi: 10.1016/0003-2697(76)90527-3. [DOI] [PubMed] [Google Scholar]
- BURT R.P., CHAPPLE C.R., MARSHAL I. Evidence for a functional alpha1a-adrenoceptor mediating contraction of the rat epididymal vas deferens and an alpha1B-adrenoceptor mediating contraction of the rat spleen. Br. J. Pharmacol. 1995;115:467–475. doi: 10.1111/j.1476-5381.1995.tb16356.x. [DOI] [PMC free article] [PubMed] [Google Scholar]
- FLAVAHAN N.A., VANHOUTTE P.M. Alpha-adrenoceptor subclassification in vascular smooth muscle. Trends in Pharmacological Sciences. 1986;7:347–349. [Google Scholar]
- FORD A.P., DANIELS D.V., CHANG D.J., GEVER J.R., JASPER J.R., LESNICK J.D., CLARKE D.E. Pharmacological pleiotropism of the human recombinant alpha1a-adrenoceptor: implications for alpha1-adrenoceptor classification. Br. J. Pharmacol. 1997;121:1127–1135. doi: 10.1038/sj.bjp.0701207. [DOI] [PMC free article] [PubMed] [Google Scholar]
- FURCHGOTT R.F., ZAWADZKI J.V. The obligatory role of endothelial cells in the relaxation of arterial smooth muscle by acetylcholine. Nature. 1980;288:373–376. doi: 10.1038/288373a0. [DOI] [PubMed] [Google Scholar]
- GRAHAM R.M., PEREZ D.M., HWA J., PIASCIK M.T. Alpha 1-adrenergic receptor subtypes. Molecular structure, function, and signaling. Circ. Res. 1996;78:737–749. doi: 10.1161/01.res.78.5.737. [DOI] [PubMed] [Google Scholar]
- HORIE K. , ITOH H., TSUJIMOTO G. Hamster alpha 1B-adrenergic receptor directly activates Gs in the transfected Chinese hamster ovary cells. Mol. Pharmacol. 1995;48:392–400. [PubMed] [Google Scholar]
- KENAKIN T. The classification of seven transmembrane receptors in recombinant expression systems. Pharmacol. Rev. 1996;48:413–463. [PubMed] [Google Scholar]
- MACEWAN D.J. , KIM G.D., MILLIGAN G. Analysis of the role of receptor number in defining the intrinsic activity and potency of partial agonists in neuroblastoma x glioma hybrid NG108-15 cells transfected to express differing levels of the human beta 2-adrenoceptor. Mol. Pharmacol. 1995;48:316–325. [PubMed] [Google Scholar]
- MCCONNELL H.M., OWICKI J.C., PARCE J.W., MILLER D.L., BAXTER G.T., WADA H.G., PITCHFORD S. The cytosensor microphysiometer: biological applications of silicon technology. Science. 1992;257:1906–1912. doi: 10.1126/science.1329199. [DOI] [PubMed] [Google Scholar]
- MCKEITHAN T.W. Kinetic proofreading in T-cell receptor signal transduction. Proc. Natl. Acad. Sci. U.S.A. 1995;92:5042–5046. doi: 10.1073/pnas.92.11.5042. [DOI] [PMC free article] [PubMed] [Google Scholar]
- MINNEMAN K.P., THEROUX T.L., HOLLINGER S., HAN C., ESBENSHADE T.A. Selectivity of agonists for cloned alpha 1-adrenergic receptor subtypes. Mol. Pharmacol. 1994;46:929–936. [PubMed] [Google Scholar]
- MURAMATSU I., MURATA S., ISAKA M., PIAO H.-L., ZHU J., SUZUKI F., MIYAMOTO S., OSHITA M., WATANABE Y., TANIGUCHI T. Alpha1-adrenoceptor subtypes and two receptor systems in vascular tissues. Life Sciences. 1998;62:1461–1465. doi: 10.1016/s0024-3205(98)00090-3. [DOI] [PubMed] [Google Scholar]
- MURAMATSU I., OHMURA T., KIGOSHI S., HASHIMOTO S., OSHITA M. Pharmacological subclassification of alpha 1-adrenoceptors in vascular smooth muscle. Br. J. Pharmacol. 1990;99:197–201. doi: 10.1111/j.1476-5381.1990.tb14678.x. [DOI] [PMC free article] [PubMed] [Google Scholar]
- ONG O.C., DOP C.V., FUNG B. Real-time monitoring of reduced beta-adrenergic response in fibroblasts from patients with pseudohypoparathyroidism. Anal Biochem. 1996;238:76–81. doi: 10.1006/abio.1996.0254. [DOI] [PubMed] [Google Scholar]
- ORLOWSKI J., GRINSTEIN S. Na+/H+ exchangers of mammalian cells. J. Biol. Chem. 1997;272:22373–22376. doi: 10.1074/jbc.272.36.22373. [DOI] [PubMed] [Google Scholar]
- OWICKI J.C., PARCE J.W., KERCSO K.M., SIGAL G.B., MUIR V.C., VENTER J.C., FRASER C.M., MCCONNELL H.M. Continuous monitoring of receptor-mediated changes in the metabolic rates of living cells. Proc. Natl. Acad. Sci. U.S.A. 1990;87:4007–4011. doi: 10.1073/pnas.87.10.4007. [DOI] [PMC free article] [PubMed] [Google Scholar]
- PEREZ D.M., HWA J., GAIVIN R., MATHUR M., BROWN F., GRAHAM R.M. Constitutive activation of a single effector pathway: evidence for multiple activation states of a G protein-coupled receptor. Mol. Pharmacol. 1996;49:112–122. [PubMed] [Google Scholar]
- RALEY S.K., MILLER K.R., OWICKI J.C., SAPOLSKY R.M. Effects of excitotoxin exposure on metabolic rate of primary hippocampal cultures: application of silicon microphysiometry to neurobiology. J. Neurosci. 1992;12:773–780. doi: 10.1523/JNEUROSCI.12-03-00773.1992. [DOI] [PMC free article] [PubMed] [Google Scholar]
- ROTIN D., GRINSTEIN S. Impaired cell volume regulation in Na(+)-H+ exchange-deficient mutants. Am. J. Physiol. 1989;257:c1158–c1165. doi: 10.1152/ajpcell.1989.257.6.C1158. [DOI] [PubMed] [Google Scholar]
- SCHWINN D.A., LOMASNEY J.W., LORENZ W., SZKLUT P.J., FREMEAU R.J., YANG F.T., CARON M.G., LEFKOWITZ R.J., COTECCHIA S. Molecular cloning and expression of the cDNA for a novel alpha 1-adrenergic receptor subtype. J. Biol. Chem. 1990;265:8183–8189. [PubMed] [Google Scholar]
- SUZUKI F., MIYAMOTO S., TAKITA M., OSHITA M., WATANABE Y., KAKIZUKA A., NARUMIYA S., TANIGUCHI T., MURAMATSU I. Cloning, functional expression and tissue distribution of rabbit alpha1d-adrenoceptor. Biochim. Biophys. Acta. 1997;1323:6–11. doi: 10.1016/s0005-2736(96)00229-5. [DOI] [PubMed] [Google Scholar]
- THEROUX T.L., ESBENSHADE T.A., PEAVY R.D., MINNEMAN K.P. Coupling efficiencies of human alpha 1-adrenergic receptor subtypes: titration of receptor density and responsiveness with inducible and repressible expression vectors. Mol. Pharmacol. 1996;50:1376–1387. [PubMed] [Google Scholar]
- TRAFTON J., TOMBAUGH G., YANG S., SAPOLSKY R. Salutary and deleterious effects of acidity on an indirect measure of metabolic rate and ATP concentrations in CNS cultures. Brain Res. 1996;731:122–131. doi: 10.1016/0006-8993(96)00488-x. [DOI] [PubMed] [Google Scholar]
- VAN-DER-GRAAF P.H., SHANKLEY N.P., BLACK J.W. Analysis of the activity of alpha 1-adrenoceptor antagonists in rat aorta. Br. J. Pharmacol. 1996;118:299–310. doi: 10.1111/j.1476-5381.1996.tb15403.x. [DOI] [PMC free article] [PubMed] [Google Scholar]
- WAKABAYASHI S., SHIGEKAWA M., POUYSSEGUR J. Molecular physiology of vertebrate Na+/H+ exchangers. Physiol Rev. 1997;77:51–74. doi: 10.1152/physrev.1997.77.1.51. [DOI] [PubMed] [Google Scholar]


