Abstract
Here we report proof-of-principle for a microsphere-based genotyping assay that detects single nucleotide polymorphisms (SNPs) directly from human genomic DNA samples. This assay is based on a structure-specific cleavage reaction that achieves single base discrimination with a 5′-nuclease which recognizes a tripartite substrate formed upon hybridization of target DNA with probe and upstream oligonucleotides. The assay is simple with two easy steps: a cleavage reaction, which generates fluorescent signal on microsphere surfaces, followed by flow cytometry analysis of the microspheres. Genomic DNA samples were genotyped for the SNP in the Apolipoprotein E gene at amino acid position 158. The assay successfully scored wild type, heterozygous and homozygous mutants. To our knowledge, this is the first report of a solid-support assay for detection of SNPs directly from genomic DNA without PCR amplification of the target.
INTRODUCTION
Single nucleotide polymorphisms (SNPs) are the most abundant form of genetic variation and occur once every 100–300 bases (1). Genotyping these biallelic markers offers great potential for identification of disease-causing genes, definition of drug targets and establishment of markers for individualized medicines (2). A recent review of SNP-genotyping methods (3) included hybridization-based approaches (4), allele-specific polymerase chain reaction (PCR) (5), primer extension (6), oligonucleotide ligation (7) and enzyme-based methods (8,9).
A number of these solution-phase SNP-genotyping methodologies have been combined with a microsphere-capture step in what has become known as ‘suspension array technology’ (10). Mini sequencing, single base chain extension (SBCE), allele-specific primer extension (ASPE) and the oligonucleotide ligation assay (OLA) have all been incorporated into microsphere-based flow-cytometry SNP-detection assays. For each of these methodologies, the starting material is PCR-amplified genomic DNA. In mini sequencing (11), SBCE (12) and ASPE (13), address-tagged oligonucleotides are hybridized to PCR-amplified genomic DNA targets and then extended by DNA polymerase. In OLA, address-tagged capture oligonucleotides and reporter probes are hybridized to PCR-amplified genomic DNA target and then ligated (14). In all cases, the reaction products are hybridized to microsphere-immobilized oligonucleotides complementary to the address tags, and the fluorescently coded microspheres are analyzed by flow cytometry.
Invasive cleavage reactions offer a simple and specific method for genotyping SNPs without prior PCR amplification of the genomic DNA target (15). This reaction is based on cleavage of a unique secondary structure formed by hybridization of a DNA target sequence to upstream and probe oligonucleotides that overlap at one base. The unpaired region at the 5′ end of the probe forms a flap that is a substrate for cleavage by structure-specific 5′ endonucleases (16). Invasive cleavage assays have been shown to produce consistent signals with a wide variety of SNPs. Using PCR products as templates, Mein et al. (17) genotyped 384 individuals for 37 SNPs with the Invader® assay. Ozaki et al. (18) utilized the Invader® assay to genotype 187 SNPs for a large-scale, case-control association study of susceptibility to myocardial infarction. Using a multiplexed PCR Invader® assay, Ohnishi et al. (19) successfully assayed 300 different SNPs.
Previously we reported attaching the probe and upstream oligonucleotides to polystyrene microspheres and thereby performing the invasive cleavage reaction on a solid support (20). We further improved the microsphere-based invasive cleavage assay by adapting it for flow cytometry based analysis in a low reaction volume (21).
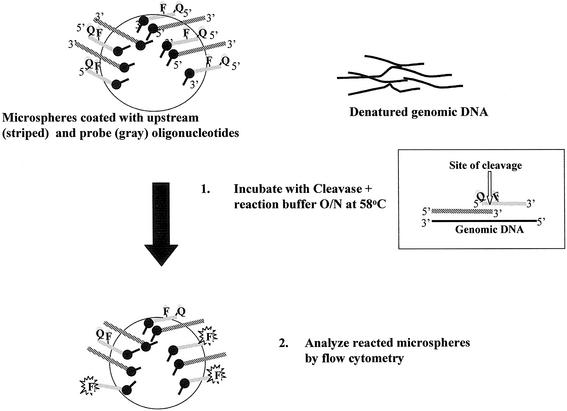
In the current study we demonstrate that flow cytometry analysis of a microsphere-based invasive cleavage assay can be applied to genotype SNPs from human genomic DNA without any prior amplification. This assay format is extremely simple, with a single isothermal incubation step followed by flow cytometry analysis (Fig. 1). The high precision of flow cytometry analysis, the ease of preparing a suspension array and the possibility for reading large numbers of replicates are all factors that make the microsphere-based invasive cleavage reaction an attractive new possibility for SNP-genotyping methodology.
Figure 1.
Steps in the microsphere-based invasive cleavage assay. Gray lines represent probe oligonucleotides, which are labeled with fluorescein (F) and a dabcyl quencher moiety (Q). Striped lines represent upstream oligonucleotides. Both types of oligonucleotide are tethered to the microsphere surface by a long linker, represented in the figure by a black lollipop shape. Genomic DNA hybridizes to the probe and upstream oligonucleotides to form a tripartite substrate, as shown in the inset box. When the probe is complementary to the genomic DNA at the position of the SNP the enzyme cleaves the probe, releasing the quencher. In the figure, fluorescence of fluorescein molecules on cleaved probes is represented by an F highlighted by a starburst.
We have successfully designed invasive cleavage solid-support assays for genotyping SNPs at amino acid position 158 in Apolipoprotein E (ApoE) and at amino acid position 506 in Factor V (data not shown). However, we have chosen the SNP in the gene encoding ApoE as the model system to assess feasibility for direct genotyping from human genomic DNA samples. ApoE is a plasma protein involved in lipid transport and lipoprotein metabolism. Genetic variation in the codon for amino acid 158, a single base change of C to T resulting in substitution of cysteine for the amino acid arginine, has been implicated in coronary artery disease (22) and type III hyperlipoproteinemia (23). The most common ApoE 158 genotype is wild type Arg-Arg, whereas heterozygous Arg-Cys and homozygous mutant Cys-Cys variants are represented in 14 and 0.9% of the population, respectively (23,24).
MATERIALS AND METHODS
Materials
Streptavidin-coated 3.18-µm-diameter polystyrene microspheres and 3-µm Rainbow Calibration Particles for flow cytometry were the kind gifts of Dr Jeff Wang (Spherotech, Libertyville, IL). Cleavase X enzyme, dilution buffer and reaction buffer were prepared and quality controlled at Third Wave Technologies (Madison, IL) as described previously (25). d-biotin was purchased from Pierce Chemicals (Rockford, IL), and other reagents were purchased from Sigma (St Louis, MO). Disposable borosilicate glass cuvettes of 6 × 50 mm for fluorometry analyses and 12 × 75 mm polystyrene tubes for flow cytometry analyses were from Fisher Scientific (Itasca, IL).
Model system
For the current study, the model system is the SNP in the ApoE gene at amino acid position 158. Alleles contain either the cgc triplet coding for arginine or the alternative codon tgc, which codes for cysteine. The ApoE 158 upstream and probe oligonucleotides, described previously (20), are biotinylated and contain linkers with 10 hexaethylene glycol spacers. Microspheres coated with Arg probe and upstream oligonucleotides are called ‘Arg microspheres’ and those coated with Cys probe and upstream oligonucleotides are termed ‘Cys microspheres’. The same upstream oligonucleotide is utilized for both types of microspheres.
For most experiments, the probe coated onto the microspheres contained a fluorescein and a dabcyl quencher moiety. Enzyme cleavage of the probe releases the quencher. For the determinations of oligonucleotide density and fluorescence linearity described below, particle-coating solutions contained cleaved probe, which we have termed ‘fluorescent probe’. These oligonucleotides retain the fluorescein label but lack the quencher.
Coating of microspheres with oligonucleotides
Polystyrene microspheres were coated with a 1:1 ratio of upstream and probe oligonucleotides as described previously (20). Briefly, 3.18-µm-diameter polystyrene microspheres were washed with phosphate-buffered saline, 0.1% Tween 20 (PBST) four times, sonicated for 30 s with a probe sonicator (Fisher Scientific) and then coated with 1 µM upstream and probe oligonucleotides in PBST by incubating in a rotary shaker. Based on previous studies in our laboratory that demonstrated 48-h incubation was appropriate for saturation of the microsphere surface with biotinylated oligonucleotides (26), the coating reaction was incubated for 48 h at room temperature on a rotary platform. The microspheres were centrifuged, washed with PBST and blocked for 10 min with 10 µM d-biotin. The microspheres were again washed four times in PBST, resuspended in 10 mM MOPS, 0.5% Tween-20, 0.5% NP-40 and stored at 4°C. A typical coating reaction contained 2.7 × 10⁷ microspheres in a 200 µl volume of 0.5 µM upstream oligonucleotide and 0.5 µM probe. Preparations of oligonucleotide-coated microspheres are stable at 4°C for at least 1 year (data not shown).
Human genomic DNA samples
Human genomic DNA samples were prepared from whole blood by an automated Gentra Systems procedure and genotyped for the ApoE SNP by a solution-phase invasive cleavage assay. All DNA samples were repurified manually with the Puregene DNA isolation kit (Gentra Systems, Minneapolis, MN) and dissolved in distilled water. Prior to reaction set-up, DNA samples were denatured for 20 min in a boiling water bath and then snap-chilled on ice. The amount and purity of each DNA sample was estimated from absorbance of the denatured DNA at 260 and 280 nm (Pharmacia LKB Ultrospec III).
Selecting concentration of genomic DNA for assay
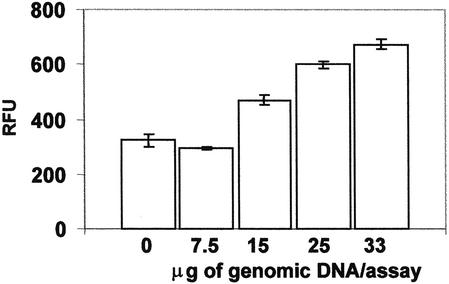
To investigate the amount of genomic DNA required for performing the invasive cleavage assay on microspheres, we tested various concentrations of genomic DNA on Arg microspheres using Arg-Arg homozygous genomic DNA in the assay protocol described below. With increasing concentrations of DNA there was a linear increase in the relative fluorescence signal (Fig. 2). With 7.5 µg of genomic DNA the fluorescence signal was not distinguishable from that of control microspheres, but with 15 µg of genomic DNA the signal was clearly significant. With 25 µg of genomic DNA, the signal was double the background signal of control microspheres. To allow enough DNA for adequate signal from heterozygous samples, we ran the assay with 25–35 µg genomic DNA per reaction.
Figure 2.
Concentration of genomic DNA. Various concentrations of Arg-Arg homozygous genomic DNA were assayed by microsphere-based invasive cleavage with 1250 Arg microspheres per reaction. The control reaction contained no genomic DNA.
Assay set-up
Assays were performed overnight in a 10 µl volume in a Perkin-Elmer 2400 thermal cycler. We investigated different incubation periods with various concentrations of Cleavase enzyme and found that overnight incubation (∼16 h) with a Cleavase concentration of 1 ng/µl was optimal for the assay (data not shown). Unless otherwise specified, each reaction contained assay buffer (10 mM MOPS, pH 7.5), 125 mM MgCl2, 0.1% Tween-20, 10 µg/ml tRNA, 1 ng/µl Cleavase X enzyme and 1250 Cys or Arg microspheres. Finally, denatured genomic DNA was added to the tubes. Reactions with synthetic DNA targets at 250 fM were included in each thermocycler run as positive and negative controls. In addition, microspheres alone (no target DNA) with and without enzyme addition were included in each run as negative controls. After incubation overnight at 58°C, the 10 µl reaction was transferred into 200 µl 0.2 M carbonate buffer (pH 9.4) in a 12 × 75 mm polystyrene tube. To disrupt aggregates, microspheres were sonicated for 30 min in a Sonic water bath (FS9, Fisher Scientific) and then vortexed briefly prior to flow-cytometry measurements. We have compared samples before and after sonication and verified that sonication does not alter the microsphere fluorescence intensities measured for single microspheres within that sample’s population of microspheres (data not shown).
Flow cytometry measurements of microsphere fluorescence
Flow-cytometry measurements were performed on a FACScan (Becton-Dickinson Immunocytometry Systems, SanJose, CA) equipped with a 15-mW argon-ion air-cooled laser emitting 488-nm light. Data for fluorescence, forward scatter and side scatter were acquired through CELLQuest Version 3.3 software. Rainbow Calibration Particles (Spherotech) were run on the flow cytometer, and the instrument’s gain was adjusted to ∼825 V so that peak 4 of these calibration particles read ∼1000 fluorescence units. The data were collected on a logarithmic scale. The threshold on the fluorescence channel was set just below the fluorescence of unreacted microspheres. This helped to eliminate background fluorescence associated with genomic DNA samples without losing information about any of the microspheres. For each assay, at least 500 out of 1250 microspheres in a 200 µl reaction volume were counted.
Flow cytometry data were analyzed on Microsoft Windows with Windows Multiple Document Interface Flow Cytometry Systems (WinMDI) software, version 2.8. The software is available at http://facs.scripps.edu. Samples containing control microspheres were utilized to set gates on forward scatter and/or side scatter so that fluorescence intensities were measured only from single microspheres and not from doublets or other aggregates. Generally, ∼90% of the microspheres were gated. Median fluorescence units were determined for each sample’s gated microspheres. Relative fluorescence units (RFU) reported in the text are normalized values calculated with reference to peak 4 of the Rainbow Calibration Particles adjusted to 1000 fluorescence units.
For data analysis, threshold values for assays with each type of microsphere were based on signals from control reactions where Cys or Arg microspheres were incubated with all reaction components except genomic DNA. For Arg microspheres, the mean for eight control reactions was 353 ± 6 RFU, while the mean for six control reactions with Cys microspheres was 287 ± 7 RFU. Threshold values were therefore arbitrarily set at 400 RFU for reactions with Arg microspheres and at 300 RFU for reactions with Cys microspheres. Each assay was repeated three times, and the number of gated single microspheres was >90%. The coefficient of variation of the counted population was <2%. The fluorescence of unlabeled microspheres with no probe attached was essentially zero (data not shown).
Oligonucleotide density on microspheres
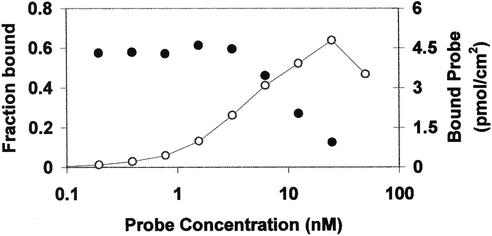
To determine the number of oligonucleotides on a saturated microsphere, we coated microspheres with 1:1 ratios of various concentrations of upstream oligonucleotide and fluorescent probe. A series of tubes containing 400 µl equimolar fluorescent probe and upstream oligonucleotide with each of the two oligonucleotides at concentrations from 50 to 0.1 nM were prepared by diluting into PBST. From these tubes, 200 µl of each coating solution was coated onto 5.66 × 10⁵ streptavidin microspheres by incubating overnight at room temperature on a rotary platform. Microspheres were pelleted by centrifugation and the supernatant of each sample was recovered. Fluorescence signals from 200 µl recovered supernatant and from 200 µl remaining from the original coating solution were measured by fluorometry. From the measured fluorescence signals of the coating solutions before and after coating, we calculated the amount of microsphere-bound fluorescent probe. The fraction bound at each coating concentration is shown in Figure 3. Multiplying the fraction bound by the concentration of fluorescent probe oligonucleotide in the coating solution yields the maximum amount of probe that can bind to the microspheres, which is ∼5 pmol/cm2. As the coating solution contained an equal number of upstream oligonucleotides, the total occupancy of the microspheres is 10 pmol/cm2. This corresponds to 2 million oligonucleotides per microsphere or 60 000 per µm2.
Figure 3.
Binding of fluorescent probe to microspheres. Fraction of fluorescent probe bound to microspheres (closed circles) and concentration of microsphere-bound fluorescent probe (open circles) plotted against the concentration of fluorescent probe in the original coating solution.
Linearity of fluorescence
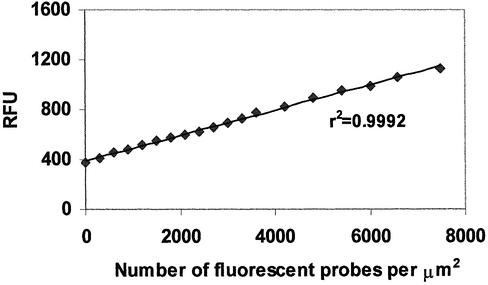
To verify that microsphere fluorescence increases linearly with the number of cleaved probes, we prepared a set of microspheres with known concentrations of fluorescent probe, quenched probe (containing both fluorescein and dabcyl quencher) and upstream oligonucleotide. Ratios of the three oligonucleotides were chosen to simulate from 0 to 25% cleavage of the probes on the microsphere surface. In 200 µl volume coating reactions, 5.66 × 10⁵ streptavidin microspheres were mixed with various concentrations of the three oligonucleotides and incubated overnight at room temperature on a rotary platform. Coated microspheres were centrifuged, resuspended in 500 µl of 0.2 M carbonate buffer, and analyzed by flow cytometry. A minimum of 10 000 microspheres were counted per sample. Microsphere-sized objects were gated on forward scatter, and median fluorescence values for each sample’s microspheres were determined and then normalized to the fluorescence of the calibration particles. As we had determined the number of oligonucleotides that can bind per µm2 at the given coating concentration, we were able to calculate the number of unquenched probes bound per µm2. When the relative fluorescence of each sample was plotted against the number of fluorescent probe molecules on the microsphere surface, as shown in Figure 4, the plot was linear, with a correlation coefficient of 0.9992.
Figure 4.
Dependence of microsphere fluorescence on number of microsphere-bound fluorescent probes. Microspheres prepared with known ratios of fluorescent probe, quenched probe and upstream oligonucleotides were analyzed by flow cytometry. Microsphere fluorescence signal was plotted against the number of microsphere-bound fluorescent probe oligonucleotides.
RESULTS
Genomic DNA samples isolated from 32 individuals were analyzed for ApoE 158 genotype with the microsphere-based invasive cleavage assay to demonstrate feasibility for SNP analysis directly from genomic DNA. Previously genotyped with the commercially available solution phase Invader® assay, the 32 samples included wild type, heterozygous and homozygous mutant genetic variants of ApoE 158.
All genomic DNA samples were tested with both Arg and Cys microspheres, in which probe cleavage occurs with ApoE 158 DNA containing, respectively, the cgc triplet coding for arginine or the tgc triplet encoding cysteine. For each genomic DNA sample, assay data were recorded as ordered pairs representing signals from reactions with Arg microspheres and Cys microspheres, respectively, with both reactions being from the same thermocycler run. For the 32 DNA samples, 30 samples were assayed in triplicate, while two samples were tested in replicate assays, yielding a total of 188 pairs of data. Each signal reported represents the median fluorescence of ∼500 microspheres.
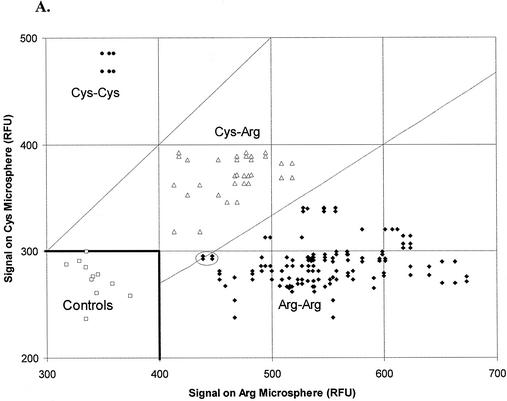
Figure 5A plots ordered pairs for all tests of the 32 genomic DNA samples with the microsphere-based ApoE 158 invasive cleavage assay. In the figure, the relative fluorescence signal obtained from reaction with Arg microspheres is plotted along the x-axis, and a corresponding relative fluorescence signal obtained from reaction with Cys microspheres is plotted along the y-axis. Lines through the origin with slopes of 1 (upper line) and 0.67 (lower line) divide the plotted data into three groups representing Cys-Cys homozygotes (upper left-hand corner), Cys-Arg heterozygotes (central region) and Arg-Arg homozygotes (lower right-hand corner). Signals from control reactions with Arg and Cys microspheres cluster in the lower left-hand corner.
Figure 5.
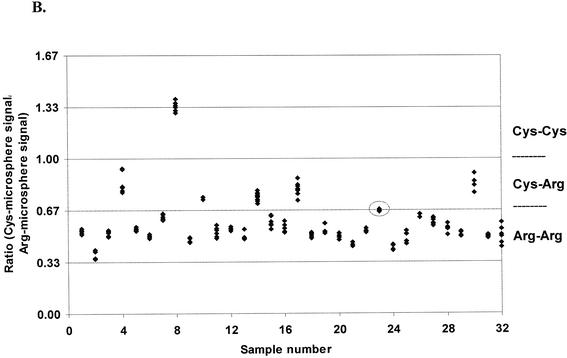
Assay signals obtained from human genomic DNA samples. (A) Genomic DNA samples were assayed by the ApoE 158 microsphere-based invasive cleavage assay using Arg or Cys microspheres, and the fluorescence signal from Arg microspheres was plotted against the signal from Cys microspheres. Signals from sample 23 that are too close to call with confidence are shown circled. (B) Assay results recorded in (A) are presented as ratios of Cys signal to Arg signal for the 32 genomic DNA samples tested.
In Figure 5B, data from the same ordered pairs are plotted by sample number as ratios, where the Cys-microsphere signal is the ratio’s numerator and the Arg-microsphere signal is the denominator. Samples with ratios >1.0 are designated as Cys-Cys homozygotes; samples with ratios between 1.0 and 0.67 are Cys-Arg heterozygotes; and samples with ratios of ≤0.67 are Arg-Arg homozygotes.
Tests with two genomic DNA samples (samples 2 and 10) yielded ordered pairs where neither of the two signals exceeded its corresponding threshold value. At the other extreme, anomalously high values (>1300 RFU) for both signals occurred with one DNA sample (sample 3). In both cases these values were discarded and the DNA samples were retested. For another genomic DNA sample (sample 6), tests yielded disparate values for replicates within the same thermocycler run. The discrepant ordered pairs were discarded and that genomic DNA sample was retested after repurification of the DNA by the Gentra Purification system, as described in Materials and Methods. Results of the repeated test unambiguously confirmed that sample 6 was Arg-Arg homozygous. Data from the anomalous low-value, high-value and discrepant-value ordered pairs mentioned above are not plotted in Figure 5.
Of the 32 genomic DNA samples tested for ApoE 158 genotype, one sample was from a Cys-Cys homozygote; five samples were from Cys-Arg heterozygotes; and 26 were from Arg-Arg homozygotes. Circled data (Fig. 5) represent ordered pairs from tests of genomic DNA sample 23. This DNA sample yielded signal ratios extremely close to those expected for heterozygous samples. These four ordered pairs (2% of the 188 pairs tested) were therefore too close to call with confidence. However, the signal on Arg microspheres was 13 standard deviations above the control reactions, and was thereby categorized as Arg homozygous.
Thus, since 30 out of 32 samples were genotyped unambiguously in the first attempt, the microsphere-based assay demonstrates a concordance rate of 94% with the solution phase assay.
DISCUSSION
In the current study we demonstrated feasibility for a microsphere-based invasive cleavage assay for genotyping SNPs directly from human genomic DNA samples. To our knowledge this is the first report of genotyping SNPs on a solid support directly from genomic DNA without prior target amplification. Most SNP genotyping assays developed so far require PCR amplification of the genomic DNA (3). While PCR contributes considerably towards the specificity of the assay, there is a huge risk of carry-over contamination. In addition, PCR assays require specific primers and separate pre- and post-reaction areas.
The major drawback of the current format for the microsphere-based invasive cleavage assay is that it requires at least 25 µg of genomic DNA per assay. This corresponds to ∼1 pM of target in a 10 µl reaction volume, whereas the solution-phase invasive cleavage assay detects single base changes using 70 ng (2.8 fM) of genomic DNA (27). An alternate form of a solid-support invasive cleavage assay utilized thiol-modified probe and upstream oligonucleotides immobilized on thin gold films. That format required ∼50 pM target (28,29). The improved sensitivity of the current format of the microsphere-based invasive cleavage assay compared to the gold-film solid-support platform is most likely because of improved presentation and reaction kinetics of immobilized oligonucleotides on the microsphere surface. However, for practical applications assay sensitivity will need to be improved so that 10 fM or less of target genomic DNA can be detected.
In a clinical setting the 2% no-call rate of the current study could pose a serious problem and result in time-consuming and costly repetitions. In a multi-site study genotyping Factor V mutations, Ledford et al. (27) demonstrated 99.5% accuracy with the solution phase Invader® assay and suggested several modifications to further improve assay accuracy. Similar modifications may be appropriate to improve accuracy for the microsphere-based assay.
The signal to background ratio of 2 in the current solid-support format is much lower compared to the invasive cleavage assay in solution-phase. However, we believe the current assay is highly robust since the signal intensities of positive microspheres were statistically significantly higher than those of control microspheres (Mann–Whitney U test, p < 0.001).
The broad clustering of data shown in Figure 5A may be because of differences in DNA concentration, the presence of small impurities or the intrinsic variability of human genomic DNA samples. Based on ratios of optical density at 260 and 280 nm, DNA samples were free of protein contaminants, but there may have been non-protein contaminants or other variables that affected assay results.
Another minor drawback of the assay is the overnight incubation. Using synthetic DNA targets, we investigated different incubation periods with various concentrations of enzyme. Data from those experiments showed that, although 3 h is sufficient to detect cleavage of the probe, overnight incubation with a very low enzyme concentration maximizes signal and minimizes background (data not shown).
From our experiments to determine the density of oligonucleotides on the microsphere surface, we estimated ∼60 000 oligonucleotides per µm2. When the two oligonucleotides are coated at a 1:1 ratio, the average linear distance between probe and upstream oligonucleotides is ∼31 Å. This distance appears to be appropriate for formation of the tripartite structure required for cleavage. The long ethylene glycol linker between the terminal biotin moiety and the oligonucleotide sequence may facilitate hybridization of the oligonucleotides to the genomic DNA target.
However, with the 31 Å inter-oligonucleotide spacing on the solid support, there may be fluorescence quenching of adjacent probe oligonucleotides. Lu et al. described a simple mathematical model that relates fluorescence signal to the progress of a fluorescence resonance energy transfer (FRET)-based solid-support invasive cleavage reaction (29). At low target concentrations, fluorescence of the cleaved probes is substantially suppressed by intermolecular quenching. Thus, probably a high threshold concentration of target is required to cleave enough probe molecules to overcome the intermolecular quenching effect. Because of this limitation, we are currently investigating solid-support assay formats that are not FRET-based.
Utilizing a solid-support invasive cleavage assay for high throughput applications that simultaneously genotype several SNPs will require multiplexing capabilities. The use of address-tagged microspheres as array elements for multiplexed analysis of DNA sequences has already been demonstrated by various groups that hybridized post-reaction products to microspheres (11,12,14,30). Commercial availability of encoded bead systems (31,32,33) opens up possibilities for developing a highly multiplexed assay system. The number of assay steps and the technical expertise required for performing each step are important factors for high- throughput and clinical applications. The solid-support invasive cleavage assay with genomic DNA contains few steps, and all reactions are performed directly on the microspheres. Optimized versions of this assay may therefore offer ease-of-use advantages and be amenable to automation.
In conclusion, we have demonstrated proof-of-concept for a solid-support invasive cleavage assay for directly genotyping human genomic DNA samples. The eventual goal of this work is to genotype large numbers of SNPs in a single assay. Accomplishing this goal will require demonstrating increased detection sensitivity, improved assay accuracy and successful multiplexing.
Acknowledgments
ACKNOWLEDGEMENTS
We thank Dr Jeff Wang of Spherotech Inc. for donating polystyrene microspheres, Professor William Miller and his laboratory members for allowing us to use the FACScan and Professor Shu Liu for use of his thermal cycler.
REFERENCES
- 1.Sachidanandam R., Weissman,D., Schmidt,S.C., Kakol,J.M., Stein,L.D., Marth,G., Sherry,S., Mullikin,J.C., Mortimore,B.J., Willey,D.L. et al. (2001) A map of human genome sequence variation containing 1.42 million single nucleotide polymorphisms. Nature, 409, 928–933. [DOI] [PubMed] [Google Scholar]
- 2.Carlson C.S., Newman,T.L. and Nickerson,D.A. (2001) SNPing in the human genome. Curr. Opin. Chem. Biol., 5, 78–85. [DOI] [PubMed] [Google Scholar]
- 3.Syvanen A.C. (2001) Accessing genetic variation: genotyping single nucleotide polymorphisms. Nature Rev. Genet., 2, 930–942. [DOI] [PubMed] [Google Scholar]
- 4.Mhlanga M.M. and Malmberg,L. (2001) Using molecular beacons to detect single-nucleotide polymorphisms with real-time PCR. Methods, 25, 463–471. [DOI] [PubMed] [Google Scholar]
- 5.Beaudet L., Bedard,J., Breton,B., Mercuri,R.J. and Budarf,M.L. (2001) Homogeneous assays for single-nucleotide polymorphism typing using AlphaScreen. Genome Res., 11, 600–608. [DOI] [PMC free article] [PubMed] [Google Scholar]
- 6.Alderborn A., Kristofferson,A. and Hammerling,U. (2000) Determination of single-nucleotide polymorphisms by real-time pyrophosphate DNA sequencing. Genome Res., 10, 1249–1258. [DOI] [PMC free article] [PubMed] [Google Scholar]
- 7.Tobe V.O., Taylor,S.L. and Nickerson,D.A. (1996) Single-well genotyping of diallelic sequence variations by a two-color ELISA-based oligonucleotide ligation assay. Nucleic Acids Res., 24, 3728–3732. [DOI] [PMC free article] [PubMed] [Google Scholar]
- 8.Lyamichev V., Mast,A.L., Hall,J.G., Prudent,J.R., Kaiser,M.W., Takova,T., Kwiatkowski,R.W., Sander,T.J., de Arruda,M., Arco,D.A. et al. (1999) Polymorphism identification and quantitative detection of genomic DNA by invasive cleavage of oligonucleotide probes. Nat. Biotechnol., 17, 292–296. [DOI] [PubMed] [Google Scholar]
- 9.Faruqi A.F., Hosono,S., Driscoll,M.D., Dean,F.B., Alsmadi,O., Bandaru,R., Kumar,G., Grimwade,B., Zong,Q., Sun,Z. et al. (2001) High-throughput genotyping of single nucleotide polymorphisms with rolling circle amplification. BMC Genomics, 2, 4. [DOI] [PMC free article] [PubMed] [Google Scholar]
- 10.Nolan J.P. and Sklar,L.A. (2002) Suspension array technology: evolution of the flat-array paradigm. Trends Biotechnol., 20, 9–12. [DOI] [PubMed] [Google Scholar]
- 11.Cai H., White,P.S., Torney,D., Deshpande,A., Wang,Z., Keller,R.A., Marrone,B. and Nolan,J.P. (2000) Flow cytometry-based minisequencing: a new platform for high-throughput single-nucleotide polymorphism scoring. Genomics, 66, 135–143. [DOI] [PubMed] [Google Scholar]
- 12.Chen J., Iannone,M.A., Li,M.S., Taylor,J.D., Rivers,P., Nelsen,A.J., Slentz-Kesler,K.A., Roses,A. and Weiner,M.P. (2000) A microsphere-based assay for multiplexed single nucleotide polymorphism analysis using single base chain extension. Genome Res., 10, 549–557. [DOI] [PMC free article] [PubMed] [Google Scholar]
- 13.Ye F., Li,M.S., Taylor,J.D., Nguyen,Q., Colton,H.M., Casey,W.M., Wagner,M., Weiner,M.P. and Chen,J. (2001) Fluorescent microsphere-based readout technology for multiplexed human single nucleotide polymorphism analysis and bacterial identification. Hum. Mutat., 17, 305–316. [DOI] [PubMed] [Google Scholar]
- 14.Iannone M.A., Taylor,J.D., Chen,J., Li,M.S., Rivers,P., Slentz-Kesler,K.A. and Weiner,M.P. (2000) Multiplexed single nucleotide polymorphism genotyping by oligonucleotide ligation and flow cytometry. Cytometry, 39, 131–140. [PubMed] [Google Scholar]
- 15.Fors L., Lieder,K.W., Vavra,S.H. and Kwiatkowski,R.W. (2000) Large-scale SNP scoring from unamplified genomic DNA. Pharmacogenomics, 1, 219–229. [DOI] [PubMed] [Google Scholar]
- 16.Lyamichev V.I., Kaiser,M.W., Lyamicheva,N.E., Vologodskii,A.V., Hall,J.G., Ma,W.P., Allawi,H.T. and Neri,B.P. (2000) Experimental and theoretical analysis of the invasive signal amplification reaction. Biochemistry, 39, 9523–9532. [DOI] [PubMed] [Google Scholar]
- 17.Mein A., Barratt,B.J., Dunn,M.G., Siegmund,T., Smith,A.N., Esposito,L., Nutland,S., Stevens,H.E., Wilson,A.J., Philips,M.S. et al. (2000) Evaluation of single nucleotide polymorphism typing with Invader on PCR amplicons and its automation. Genome Res., 10, 330–343. [DOI] [PMC free article] [PubMed] [Google Scholar]
- 18.Ozaki K., Ohnishi,Y., Iida,A., Sekine,A., Yamada,R., Tsunoda,T., Sato,H., Sato,H., Hori,M., Nakamura,Y. and Tanaka,T. (2002) Functional SNPs in the lymphotoxin-α gene that are associated with susceptibility to myocardial infarction. Nature Genet., 32, 650–654. [DOI] [PubMed] [Google Scholar]
- 19.Ohnishi Y., Tanaka,T., Ozaki,K., Yamada,R., Suzuki,H. and Nakamura,Y. (2001) A high-throughput SNP typing system for genome-wide association studies. J. Hum. Genet., 46, 471–477. [DOI] [PubMed] [Google Scholar]
- 20.Wilkins Stevens P., Hall,J.G., Lyamichev,V., Neri,B.P., Lu,M., Wang,L., Smith,L.M. and Kelso,D.M. (2001) Analysis of single nucleotide polymorphisms with solid phase invasive cleavage reactions. Nucleic Acids Res., 29, e77. [DOI] [PMC free article] [PubMed] [Google Scholar]
- 21.Wilkins Stevens P., Rao,K.V.N., Hall,J.G., Lyamichev,V., Neri,B.P. and Kelso,D.M. (2003) Improved sensitivity for solid-support invasive cleavage reactions with flow cytometry analysis. Biotechniques, 34, 198–203. [DOI] [PubMed] [Google Scholar]
- 22.Luc G., Bard,J.M., Arveiler,D., Evans,A., Cambou,J.P., Bingham,A., Amouyel,P., Schaffer,P., Ruidavets,J.B., Cambien,F. et al. (1994) Impact of apolipoprotein E polymorphism on lipoproteins and risk of myocardial infarction. The ECTIM Study. Arterioscler. Thromb., 14, 1412–1419. [DOI] [PubMed] [Google Scholar]
- 23.de Beer F., Stalenhoef,A.F., Hoogerbrugge,N., Kastelein,J.J., Gevers Leuven,J.A., van Duijn,C.M., Havekes,L.M. and Smelt,A.H. (2002) Expression of type III hyperlipoproteinemia in apolipoprotein E2 (Arg158→Cys) homozygotes is associated with hyperinsulinemia. Arterioscler. Thromb. Vasc. Biol., 22, 294–299. [DOI] [PubMed] [Google Scholar]
- 24.Nickerson D.A., Taylor,S.L., Fullerton,S.M., Weiss,K.M., Clark,A.G., Stengard,J.H., Salomaa,V., Boerwinkle,E. and Sing,C.F. (2000) Sequence diversity and large-scale typing of SNPs in the human apolipoprotein E gene. Genome Res., 10, 1532–1545. [DOI] [PMC free article] [PubMed] [Google Scholar]
- 25.Hall J.G., Eis,P.S., Law,S.M., Reynaldo,L.P., Prudent,J.R., Marshall,D.J., Allawi,H.T., Mast,A.L., Dahlberg,J.E., Kwiatkowski,R.W. et al. (2000) Sensitive detection of DNA polymorphisms by the serial invasive signal amplification reaction. Proc. Natl Acad. Sci. USA, 97, 8272–8277. [DOI] [PMC free article] [PubMed] [Google Scholar]
- 26.Henry M.R., Wilkins Stevens,P., Sun,J. and Kelso,D.M. (1999) Real-time measurements of DNA hybridization on microparticles with fluorescence resonance energy transfer. Anal. Biochem., 276, 204–214. [DOI] [PubMed] [Google Scholar]
- 27.Ledford M., Friedman,K.D., Hessner,M.J., Moehlenkamp,C., Williams,T.M. and Larson,R.S. (2000) A multi-site study for detection of the factor V (Leiden) mutation from genomic DNA using a homogeneous invader microtiter plate fluorescence resonance energy transfer (FRET) assay. J. Mol. Diagn., 2, 97–104. [DOI] [PMC free article] [PubMed] [Google Scholar]
- 28.Lu M., Shortreed,M., Hall,J., Wang,L., Berggren,T., Wilkins Stevens,P., Kelso,D., Lyamichev,V., Neri,B. and Smith,L. (2002) A surface invasive cleavage assay for highly parallel SNP analysis. Hum. Mutat., 19, 416–422. [DOI] [PubMed] [Google Scholar]
- 29.Lu M., Hall,J., Shortreed,M., Wang,L., Berggren,W., Wilkins Stevens,P., Kelso,D., Lyamichev,V., Neri,B., Skinner,J. and Smith,L. (2002) Structure-specific DNA cleavage on surfaces. J. Am. Chem. Soc., 124, 7924–7931. [DOI] [PubMed] [Google Scholar]
- 30.Spiro A., Lowe,M. and Brown,D. (2000) A bead-based method for multiplexed identification and quantitation of DNA sequences using flow cytometry. Appl. Environ. Microbiol., 66, 4258–4265. [DOI] [PMC free article] [PubMed] [Google Scholar]
- 31.Fulton R., McDade,R., Smith,P., Kienker,L. and Kettman,J.J. (1997) Advanced multiplexed analysis with the FlowMetrix System. Clin. Chem., 43, 1749–1756. [PubMed] [Google Scholar]
- 32.Vignali D.A. (2000) Multiplexed particle-based flow cytometric assays. J. Immunol. Methods, 243, 243–255. [DOI] [PubMed] [Google Scholar]
- 33.Han M., Gao,X., Su,J.Z. and Nie,S. (2001) Quantum-dot-tagged microbeads for multiplexed optical coding of biomolecules. Nat. Biotechnol., 19, 631–635. [DOI] [PubMed] [Google Scholar]


