

Abstract
The aim of this study was to establish the utility of a fluorometric imaging plate reader (FLIPR) assay to assess human adenosine A2B receptor function by characterizing its receptor pharmacology and comparing this profile to that obtained using a microphysiometer.
FLIPR was used, in conjunction with a Ca2+-sensitive dye (Fluo-3-AM), to measure rapid rises in intracellular calcium in a Chinese Hamster Ovary (CHO-K1) cell line stably transfected with both the human A2B receptor and a promiscuous Gα16 protein. Microphysiometry was used to measure rapid changes in the rate of extracellular acidification in a Human Embryonic Kidney (HEK-293) cell line also stably transfected with human A2B receptor.
Activation of A2B receptors by various ligands caused a concentration-dependent increase in both the intracellular calcium concentration and the extracellular acidification rate in the cells tested, with a similar rank order of potency for agonists: NECA>N6-Benzyl NECA>adenosine⩾R-PIA>CPA>S-PIA>CHA>CGS 21680. No comparable effects were observed in the non-transfected control cell lines.
The rank order of potency of the agonists examined was the same in all studies, whereas absolute potency and efficacy varied. Thus, all compounds exhibited greater potency in FLIPR than the microphysiometer and the efficacies obtained with CHO-K1+Gα16+A2B cell line and FLIPR were greater than those obtained with HEK-293+A2B cell line in the microphysiometer.
ZM-241385 was the most potent of a range of adenosine antagonists tested with a pA2 of 8.0 in both the FLIPR and microphysiometer assays.
In conclusion, the profile of the responses to both A2B receptor agonists and antagonists in FLIPR were similar to those obtained by the microphysiometer, although both potency and efficacy values were higher in the FLIPR assay. With this caveat in mind, this study shows that FLIPR coupled with a cell line transfected with both the human A2B receptor and a promiscuous Gα16 protein provides a useful, high throughput method for the assessment of A2B receptor function.
Keywords: Adenosine, receptors, A2B, microphysiometry, fluorescence, receptor coupling
Introduction
The endogenous nucleoside adenosine mediates its action on cells through at least four G-protein-coupled receptor subtypes, which have been classified as A1, A2A, A2B and A3 (Linden & Jacobson, 1998; Ralevic & Burnstock, 1998). Adenosine A2B receptors have been implicated in neurosecretion, intestinal function, asthma and inflammation (Feoktistov et al., 1998b). Elucidation of the pharmacology of A2B receptors has lagged behind that of the A1 and A2A subtypes, largely because of the absence of A2B receptor-specific ligands. The assessment of A2B receptor pharmacology has also relied largely on the measurement of cyclic AMP accumulation or adenylate cyclase activity (Martin, 1992; Brackett & Daly, 1994; Peakman & Hill, 1994; Klotz et al., 1998; Feoktistov & Biaggioni, 1997; 1998).
FLIPR is increasingly being used to assess the functional response of G protein-coupled receptors (Porter et al., 1999; Wood et al., 1999; Jerman et al., 2000), particularly when the receptor of interest is co-expressed with the promiscuous G-protein Gα16 to couple the receptor responses to phospholipase C (Milligan et al., 1996). The present study represents the first assessment of human A2B receptor function using a calcium-sensitive dye (Fluo-3-AM) coupled with a fluorometric imaging plate reader (FLIPR). The pharmacological characteristics of the A2B receptor have been defined and compared with those obtained by microphysiometry, a method that uses small alterations in pH as a signal of changes in cellular metabolism induced by a variety of ligand-receptor interactions, including G-protein linked receptors (Owicki et al., 1990; McConnell et al., 1992; Coldwell et al., 1999). A preliminary report of this work has previously been published (Randall et al., 2000).
Methods
Materials
All compounds were obtained from Sigma-RBI (Poole, U.K.) or Tocris (Bristol, U.K.). Fluo-3-AM and pluronic acid were purchased from TefLabs and Molecular Probes (U.S.A.), respectively. Cytosensor capsule kits and modified RPMI 1640 medium buffer were purchased from Molecular Devices (U.K.). All culture reagents were purchased from Sigma-RBI (Poole, U.K.) or Gibco (Paisley, U.K.). Cell culture plasticware was purchased from Falcon or Corning Costar.
Cell culture
Human Embryonic Kidney (HEK-293) cells were transfected with the human A2B receptor (accession number: GB: M97759) which was cloned and inserted into pCDNA3.1, as described previously (Porter et al., 1999). CHO-K1 cells were transfected by electroporation using the same expression vector. Electroporation was performed using 10 million CHO cells suspended in 0.8 ml PBS in the presence of linearized cDNA using a capacitance of 25 μF and a voltage of 0.75 kV. The cells were placed on ice for 5 min before and after electroporation. Twenty-four hours following transfection, positive clones were selected using 0.8 mg ml−1 G418. CHO-K1 cells had previously been stably transfected with the Gα16 protein and were also under selection for 0.5 mg ml−1 zeocin. Single clones were isolated by limiting dilution, and screening for receptor expression and functional coupling was performed in FLIPR. The cells were grown in Dulbecco's Modified Eagles medium (DMEM) containing 10% heat inactivated foetal bovine serum (FBS), 1% penicillin–streptomycin, 1% L-glutamate, 1% essential amino acids and 0.01% sodium pyruvate (for cells transfected with the A2B receptor) at 37°C in a 10% CO2 incubator at 95% humidity.
FLIPR
On the afternoon before assay, cells were plated at a density of 30,000 cells/well into black 96-well plates with clear bottoms to allow cell inspection and fluorescence measurements from the bottom of each well. The density of cells was sufficient to yield a confluent monolayer the next day. Hanks balanced salt solution, without phenol red, containing 20 mM HEPES and 2.5 mM probenecid was prepared fresh on the day of assay, and used as the assay buffer. DMSO was used to aid solubilization of poorly soluble compounds. Dilutions were made using a Beckman Biomek 2000 laboratory automation workstation, in assay buffer. The final concentration of DMSO exposed to the cells never exceeded 0.3%, which had no effect alone (data not shown). The dye-loading buffer consisted of a final concentration of 4 μM Fluo-3-AM (dissolved in DMSO and pluronic acid) in serum-free cell culture maintenance medium containing 20 mM HEPES and 2.5 mM probenecid. The cells were dye-loaded for approximately 60 min at 37°C in a 5% CO2 incubator at 95% humidity by removing the existing maintenance media and adding 100 μl of the dye-loading buffer to each well. Once dye-loaded, the cells were washed thoroughly on a Denley cell washer with the assay buffer to remove any unincorporated dye. Exactly 100 μl assay buffer was left in each well.
Assay conditions were as described previously by Porter et al., 1999. Briefly, each 96-well plate containing dye-loaded cells was placed into the FLIPR drawer and the laser intensity set to a suitable level (to obtain basal values of approximately 10,000 fluorescence units). Agonist additions were made 10 s into the fluorescent measurements. For antagonist studies, cells were pre-incubated for 10 min prior to experiments. The maximum fluorescent signal obtained was recorded and normalized to a positive control of 10 μM NECA, performed in quadruplicate on every plate.
Each 96-well plate contained four wells dedicated to the positive control (10 μM NECA) and four wells as a negative control (assay buffer alone). For pharmacological characterization, all data were normalized to the positive control wells, which were expressed as 100% signal. Each agonist concentration-response curve was constructed using a four parameter logistic equation from GraphPad Prism software as follows: Y=Bottom+(Top−Bottom)/1+10(LogEC50-X)nH. The efficacy of the compound was determined from the maximal value. The concentration of agonist that produced a half-maximal response is represented by the EC50 value, the logarithm of which yielded the pEC50 value. The pA2 values of antagonists were determined by Schild plot analysis (Arunkalakshana & Schild, 1959).
Microphysiometry
Cells were seeded into 12 mm transwell inserts (microphysiometer capsule kit; Molecular Devices) at 300,000 cells per cup in growth medium (as described above). The cells were incubated overnight at 37°C in a 10% CO2 incubator at 95% humidity. All compounds were made up to 10 mM in 20% DMSO to aid solubilization. Further dilutions were made in the microphysiometer with modified RPMI 1640 medium (Molecular Devices). The final concentration of DMSO exposed to the cells never exceeded 0.2%, which had no effect alone (data not shown). The assay conditions were a variant of a procedure described by Coldwell et al., 1999. The cups containing cells were loaded into the sensor chambers of the microphysiometer and the chambers perfused with microphysiometer modified RPMI 1640 medium (Molecular Devices) at a flow rate of 100 μl min−1 and a temperature of 37°C for 50 min. Each pump cycle lasted 120 s. The pump was on for the first 80 s and the acidification rate determined between 88 and 118 s, using the Cytosoft programme (Molecular Devices).
In agonist experiments, increasing concentrations (at log unit intervals) of receptor agonist were perfused over the cells for 2 min at 40 min intervals to allow for receptor recovery. In antagonist studies, the cells were perfused for 20 min with buffer containing the antagonist prior to agonist addition. Each agonist concentration-response curve was constructed using a four parameter logistic equation from GraphPad Prism software as described above. The efficacy of the compound was determined from the peak value, which is the maximum value of the Y plateau. The concentration of agonist that produced a half-maximal response is represented by the EC50 value. For antagonist studies, the apparent pA2 was calculated as follows: pA2=Log [Antagonist]−Log (Dose Ratio−1).
Results
Effect of compounds on extracellular acidification rates of HEK-293 cells transfected with the A2B receptor
A minor signal to NECA was obtained from non-transfected HEK-293 cells that underwent an identical assay protocol. The HEK-293 cell line has been found to contain an endogenous A2B receptor but no other adenosine receptors (Cooper et al., 1997; Schachter et al., 1997; Gao et al., 1999). However, the response obtained was much lower than that in the A2B transfected cell line (data not shown).
Initial studies showed that responses to NECA in HEK-293 cells transfected with A2B receptors were constant and the potency of NECA (EC50: 0.89±0.30 μM) did not alter with time during the collection period, which is indicative of a lack of receptor desensitization (data not shown). A typical example of the time-course of the response of HEK-293+A2B cells to NECA is shown in Figure 1A. On exposure to NECA, the acidification rates rose to maximal level within 2 min and then gradually declined back to basal values over a period of 10 min. Changes in acidification rates were determined by calculating the difference between the maximum effect after agonist addition and the average of the three measurements taken immediately before exposure to agonist.
Figure 1.

(A) Time-course of the effect of NECA on the acidification rate of HEK-293+A2B cells, measured using the microphysiometer. (B) Time-course of calcium signal following 10 μM NECA addition (after 10 s) on CHO-K1+Gα16+A2B cells, measured using FLIPR.
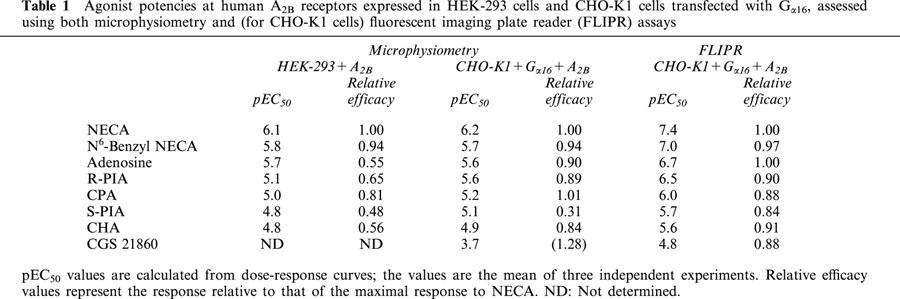
Agonist concentration-response curves to NECA are shown in Figure 2A. In the presence of adenosine or its analogues, a concentration-dependent elevation of the acidification rate was observed, with a rank order of EC50 values of NECA>N6-Benzyl-NECA>Adenosine>R-PIA>CPA⩾S-PIA>CHA>CGS 21680. This rank order of potency is consistent with the A2B receptor. The EC50 for the most potent analogue, NECA, was 0.89±0.30 μM (Table 1). The A2A selective agonist, CGS 21680 (Lupica et al., 1990) failed to stimulate any change in basal acidification rates up to a concentration of 1 mM. The low activity of CGS 21680 is characteristic of that reported for A2B receptors (Lupica et al., 1990). All of the adenosine analogues had a maximal response lower than that of NECA (Figure 2A, Table 1). Higher concentrations of these compounds could not be tested due to their poor solubility. The results obtained using the HEK-293+A2B cell line were subject to large variations between independent trials. This is probably attributable to the small size of responses obtained leading to a low signal-to-noise ratio. For this reason, the results obtained were verified using an alternative cell line in both the microphysiometer and FLIPR assays.
Figure 2.

Agonist concentration-response curves using: (A) HEK-293+A2B cell line in the microphysiometer, (B) CHO-K1+Gα16+A2B cell line in the microphysiometer, (C) CHO-K1+Gα16+A2B cell line in FLIPR and (D) HEK-293+A2B cell line in FLIPR. Data points represent the maximum response obtained at each concentration and are representative from a single experiment performed in duplicate that was repeated four times (FLIPR) or two times (microphysiometry).
Table 1.
Agonist potencies at human A2B receptors expressed in HEK-293 cells and CHO-K1 cells transfected with Gα16, assessed using both microphysiometry and (for CHO-K1 cells) fluorescent imaging plate reader (FLIPR) assays
Effect of compounds on extracellular acidification rates of CHO-K1+Gα16+A2B cells
No signal to NECA was obtained from the parental CHO-K1+Gα16 cell line that underwent an identical assay protocol. CHO-K1 cells have been found not to express any of the adenosine receptor subtypes (Alexander et al., 1996). The responses obtained using the CHO-K1+Gα16+A2B cell line in the microphysiometer displayed greater efficacy than those obtained using the HEK-293+A2B cell line (Figure 2 and Table 1). The responses were also less variable in the CHO-K1+Gα16+A2B cells, probably because of the greater magnitude of response. The rank order of potency (NECA>N6-Benzyl-NECA>Adenosine>R-PIA>CPA>CHA>S-PIA>CHA) was the same in each cell line (Table 1). A measurable response was obtained testing CGS 21680 on the CHO-K1+Gα16+A2B cell line at concentrations greater than 10 μM (Figure 2B). ZM 241385 (100 nM) produced a parallel rightward shift in the concentration response curve to NECA with a calculated pA2 of 8.0 with no decrease in the maximal response, indicative of competitive antagonism (Figure 3A).
Figure 3.

(A) Effect of 100 nM ZM-241385 on the concentration-response curve for NECA in the microphysiometer. (B) Effect of different concentrations of ZM-241385 on the concentration-response curve for NECA in FLIPR.
Effects of compounds on intracellular calcium concentrations of CHO-K1+Gα16+A2B cells
No signal to NECA was obtained from non-receptor-transfected CHO-K1 and Gα16 protein transfected CHO-K1 cells that underwent an identical assay protocol (data not shown). Following the addition of agonist to the Gα16 and A2B receptor-transfected cells however, a rapid rise in intracellular calcium was obtained, typified at higher concentrations by a rapid initial peak (maximal approximately 15 s after addition) followed by a gradual decline towards baseline values (Figure 1B). The peak of this rapidly obtained maximum rise in intracellular calcium concentration over basal levels was measured and expressed as a percentage of that obtained by 10 μM NECA. The relative efficacy of all compounds was expressed as a fraction of that obtained by 10 μM NECA.
In the presence of adenosine and its analogues, a concentration-dependent increase in [Ca2+]i in CHO-K1+Gα16+A2B cells, with a rank order of potency of NECA>N6-benzyl-NECA>Adenosine>R-PIA>CPA>S-PIA>CHA>CGS 21680, was observed (Figure 2C, Table 1). The EC50 value for NECA was 30 nM (Table 1), which is 20 fold higher than the EC50 value obtained using the microphysiometer. CGS 21680 had the lowest potency of the compounds and did not reach a plateau at the highest concentration tested (10 μM), unlike all the other compounds assessed (Figure 2C). Similar to the results obtained using this cell line in the microphysiometer, N6-benzyl NECA exhibited a relatively high potency (EC50: 0.09±0.01 μM) for the A2B receptor, much greater than the endogenous ligand, adenosine (EC50: 0.20±0.02 μM), and R-PIA exhibited a potency (EC50: 0.31±0.04 μM) that was very close to that of adenosine.
Responses to increasing concentrations of NECA were competitively inhibited in the presence of a range of adenosine receptor antagonists, with the rank order of apparent pA2 values: ZM-241385>Alloxazine>Theophylline (Table 2). For Schild analysis concentrations of antagonists were evaluated using 3–10 fold the pA2 values reported, and increasing in half-log increments (see Figures 2 and 3). As observed using the microphysiometer on the same cell line, the reported A2A antagonist, ZM-241385, at a concentration of 100 nM, caused a 10 fold decrease in the potency of NECA (from EC50=0.02±0.00 μM to EC50=1.19±0.01 μM) (Figure 3B).
Table 2.
Apparent pA2 values for antagonists at transfected human A2B adenosine receptors expressed in the CHO-K1+Gα16+A2B cell line, using the FLIPR assay

Effect of compounds on intracellular calcium concentrations of HEK-293+A2B cells
As an additional control, the HEK-293+A2B cell line was examined using FLIPR. NECA and adenosine both caused a concentration-dependent increase in [Ca2+]i (Figure 2D), with EC50 values of 1.11±0.24 μM and 6.22±0.96 μM, respectively, comparable to those obtained using HEK-293 cells in the microphysiometer (0.89±0.30 μM and 2.19±2.17 μM, respectively). No signal was obtained from non-transfected HEK-293 cells that underwent an identical assay protocol.
Comparison of agonist potencies obtained using the different techniques
Linear regression analysis of the agonist potencies obtained using the HEK-293+A2B cell line in the microphysiometer and the CHO-K1+Gα16+A2B cell line in FLIPR, showed a high degree of correlation (Figure 4A, slope=0.73, r2=0.93, P=0.0004). A similar comparison using the CHO-K1+Gα16+A2B cell line in both assays, also showed a good correlation (Figure 4B, slope=0.87, r2=0.92, P=0.0006).
Figure 4.

(A) Comparison of agonist potencies obtained using the HEK-293+A2B cell line in the microphysiometer and the CHO-K1+Gα16+A2B cell line in FLIPR. (B) Comparison of agonist potencies obtained using CHO-K1+Gα16+A2B in the microphysiometer and in FLIPR. The dashed lines show the 95% confidence intervals.
Discussion
This study pharmacologically characterized the human A2B receptor in two different assay systems: FLIPR and microphysiometry. Ligand potencies in the FLIPR assay were approximately one order of magnitude greater than those obtained using microphysiometry. This is probably attributable to the amplification of the response signal via the coupling of the A2B receptor to phospholipase C by Gα16. Many of the agonists tested (especially the weaker A1 and A2A receptor agonists) exhibited the properties of partial agonists when tested using the HEK-293+A2B cell line but acted as full agonists when tested using the CHO-K1+Gα16+A2B cell line. This difference is most probably due to the enhanced probability of receptor coupling with the transfected promiscuous Gα16 protein (which was present in high concentrations) and the amplification of the signal by Ca2+ mobilization on receptor activation, leading to increased probability of functional responses being detected in the CHO-K1+Gα16+A2B cell line. It has previously been reported that different G-protein expression patterns can affect pharmacological responses at GPCRs (Yang et al., 1999). The substantial increase in the potency and efficacy of the agonist responses obtained in FLIPR with the CHO cell line contrasts with the results for the same agonists obtained with the same cell line in the microphysiometer (see Table 1) suggesting that these differences are due to detection methodology rather than, for example, receptor reserve. Interestingly, the results from the microphysiometer agree well with other studies which utilized cAMP measurements (Klotz et al.,1998; Feoktistov & Biaggioni, 1998) implying that the endogenous G-protein coupling of the A2B receptor is weak. This is reflected by the low activity of this receptor subtype in situ in comparison to the other adenosine receptor subtypes (Feoktistov & Biaggioni, 1997). Taken together, these results suggest that Gα16 is a useful tool for evaluating the pharmacology of A2B receptors, especially given its amenability to high throughput pharmacological testing by the use of screening tools such as FLIPR.
Characterization of the transfected A2B receptor in both the HEK-293 and the CHO-K1+Gα16 cell lines using microphysiometry and the CHO-K1+Gα16 cell line using FLIPR, produced a rank order of agonist potencies that correlated well between the two techniques (Table 1). NECA was the most potent agonist with the greatest efficacy, as shown previously (Cooper et al., 1997; Brackett & Daly, 1994; Alexander et al., 1996; Feoktistov & Biaggioni, 1998). Similarly, the close correlation of the rank order of A2B receptor agonist potencies in both the FLIPR and microphysiometry assays is in good agreement with previous studies using a variety of different cell preparations (Feoktistov & Biaggioni, 1993; 1998; Klotz et al., 1998; Mirabet et al., 1997; Alexander et al., 1996; Martin, 1992). However, although the rank order was consistent, there were some differences in the relative potencies of some of the agonists tested. For example, we found that the proposed A3-receptor selective agonist, N6-Benzyl NECA generally exhibited the same efficacy as NECA, whereas Feoktistov & Biaggioni (1998) reported it to be a poor A2B receptor agonist. Similarly, we found the A1-receptor selective agonist, R-PIA to have a similar potency to adenosine for the A2B receptor, which suggests a greater potency than that reported in previous studies (Klotz et al., 1998).
Antagonist studies were difficult to perform by microphysiometry since only small responses were obtained using the HEK-293+A2B cell line. A larger response was obtained with the CHO-K1+Gα16+A2B cell line probably due to the overexpression of the Gα16 protein. The pA2 value obtained for the antagonist ZM-241385 in the FLIPR assay (8.1) was very similar to that obtained in the microphysiometer assay (8.0) and at least two orders of magnitude greater than that for theophylline and alloxazine. ZM-241385 was originally described as a potent and selective adenosine A2A receptor antagonist (Poucher et al., 1995). The present data, together with that of others (Linden et al., 1999; Ji et al., 2001), indicate that this compound is also a potent adenosine A2B receptor antagonist.
The responses obtained in the microphysiometer with native HEK-293 cells confirm previous observations (Cooper et al., 1997) and the absence of an effect in the FLIPR assay suggests that the endogenous receptor does not cause a rise in intracellular calcium concentration. By contrast, the HEK-293+A2B cell line produced a strong calcium signal, without the coupling to a promiscuous G-protein, which suggests that with sufficient receptor expression there is alternative coupling of the A2B receptor to phospholipase C, possibly via the βγ subunits (Camps et al., 1992; Clapham & Neer, 1993). The exact intracellular signal transduction pathways and the specific responses mediated by the A2B receptor are still not fully defined. Recent studies suggest that, in addition to stimulation of adenylate cyclase in HMC-1 cells, A2B receptors also activate phospholipase C, resulting in mobilization of intracellular calcium and generation of diacyglycerol, which then activates protein kinase C (Feoktistov & Biaggioni, 1996).
The ability of extracellular adenosine to modulate mast cell function has long been recognized (Marquardt et al., 1978; Church et al., 1986; Peachell et al., 1988; Auchampach et al., 1997). Indeed, activation of mast cells by adenosine has been implicated in the pathophysiology of asthma (Feoktistov & Biaggioni, 1997; Feoktistov et al., 1998a,b). The A2B receptor has also been implicated in the proliferation of cardiac fibroblasts and participates in cardiac hypertrophy/remodelling associated with hypertension and myocardial infarction (Dubey et al., 1997; 1998). The potential role of A2B receptors in the pathogenesis of human disease raises the possibility that A2B receptors could become a useful target for future drug development (Feoktistov & Biaggioni, 1997). Progress in the study of A2B receptors will be greatly advanced by the introduction of specific pharmacological probes for this receptor subtype. Even though adenosine analogues generally have poor agonist potency and selectivity for the A2B receptor (Feoktistov & Biaggioni, 1997), this is not the case for adenosine antagonists (e.g. enprofylline; Feoktistov et al., 1998a). Potent and selective A2B receptor antagonists may thus provide a fresh approach to the treatment of diseases such as asthma and cardiac fibrosis.
In summary, the present study has validated the use of FLIPR to assess the function of A2B receptors when transfected into a cell line and coupled to phospholipase C via co-transfected Gα16 protein. There are two important caveats, however: (1) potency values were 10 fold higher in FLIPR than those determined by microphysiometry and (2) partial agonist activity was not commonly observed. These discrepancies may be attributable to the amplification of the response signal. Nonetheless, the fact that the rank order of agonist potencies correlated very well between the FLIPR and microphysiometry, coupled with the fact that FLIPR provides a high throughput method to assess receptor function, suggests that FLIPR provides a very useful tool for the assessment of A2B receptor function.
Acknowledgments
H. Patel was the recipient of an Intercalated BSc Studentship from the British Pharmacological Society.
Abbreviations
- A2B
adenosine 2B
- FLIPR
fluorometric imaging plate reader
- IP3
inositol triphosphate
- PLC
phospholipase C
- RT–PCR
reverse-transcriptase polymerase chain reaction
References
- ALEXANDER S., COOPER J., SHINE J., HILL S. Characterisation of the human brain putative A2B adenosine receptor expressed in Chinese hamster ovary (CHO.A2B4) cells. Br. J. Pharmacol. 1996;119:1286–1290. doi: 10.1111/j.1476-5381.1996.tb16035.x. [DOI] [PMC free article] [PubMed] [Google Scholar]
- ARUNKALAKSHANA O., SCHILD H. Some quantitative use of drug antagonists. Br. J. Pharmacol. Chemother. 1959;14:48–58. doi: 10.1111/j.1476-5381.1959.tb00928.x. [DOI] [PMC free article] [PubMed] [Google Scholar]
- AUCHAMPACH J., XIAOWEI J., WAN T., CAUGHEY G., LINDEN J. Canine mast cell adenosine receptors: cloning and expression of the A3 receptor and evidence that degranulation is mediated by the A2B receptor. Mol. Pharmacol. 1997;52:846–860. doi: 10.1124/mol.52.5.846. [DOI] [PubMed] [Google Scholar]
- BRACKETT L., DALY J. Functional characterisation of the A2B adenosine receptor in NIH 3T3 fibroblasts. Biochem. Pharmacol. 1994;47:801–814. doi: 10.1016/0006-2952(94)90480-4. [DOI] [PubMed] [Google Scholar]
- CAMPS M., CAROZZI A., SCHNABEL P., SCHEER A., PARKER P.J., GIERSCHIK P. Isoenzyme selective stimulation of phosholipase C β2 by G protein βγ subunits. Nature. 1992;360:684–686. doi: 10.1038/360684a0. [DOI] [PubMed] [Google Scholar]
- CHURCH M., HUGHES P., VARDEY C. Studies on the receptor mediating cyclic AMP-independent enhancement by adenosine by IgE-dependent mediator release from rat mast cells. Br. J. Pharmacol. 1986;87:233–242. doi: 10.1111/j.1476-5381.1986.tb10176.x. [DOI] [PMC free article] [PubMed] [Google Scholar]
- CLAPHAM D.E., NEER E.J. New roles for G protein βγ dimers in transmembrane signalling. Nature. 1993;365:403–406. doi: 10.1038/365403a0. [DOI] [PubMed] [Google Scholar]
- COLDWELL M., BOYFIELD I., BROWN A., STEMP G., MIDDLEMISS D. Pharmacological characterisation of extracellular acidification rate responses in human D2(log), D3 and D4.4 receptors expressed in Chinese hamster ovary cells. Br. J. Pharamacol. 1999;127:1135–1144. doi: 10.1038/sj.bjp.0702657. [DOI] [PMC free article] [PubMed] [Google Scholar]
- COOPER J., HILL S., ALEXANDER S. An endogenous A2B-adenosine receptor coupled to cyclic AMP generation in human embryonic kidney (HEK-293) cells. Br. J. Pharmacol. 1997;122:546–550. doi: 10.1038/sj.bjp.0701401. [DOI] [PMC free article] [PubMed] [Google Scholar]
- DUBEY R., GILLESPIE D., DELBERT G., JACKSON E. Adenosine inhibits collagen and protein synthesis in cardiac fibroblasts: role of A2B receptors. Hypertension. 1998;31:943–948. doi: 10.1161/01.hyp.31.4.943. [DOI] [PubMed] [Google Scholar]
- DUBEY R., GILLESPIE D., MI M., JACKSON E. Exogenous and endogenous adenosine inhibits fetal calf serum-induced growth of rat cardiac fibroblasts role of A sub 2B receptors. Circulation. 1997;96:2656–2666. doi: 10.1161/01.cir.96.8.2656. [DOI] [PubMed] [Google Scholar]
- FEOKTISTOV I., BIAGGIONI I. Characterisation of adenosine receptors in human erthroleukemia cells: further evidence for heterogeneity of adenosine A2 receptors. Mol. Pharmacol. 1993;43:909–914. [PubMed] [Google Scholar]
- FEOKTISTOV I., BIAGGIONI I. Role of adenosine in asthma. Drug. Dev. Res. 1996;39:333–336. doi: 10.1002/(SICI)1098-2299(199611/12)39:3/4<333::AID-DDR14>3.0.CO;2-2. [DOI] [PubMed] [Google Scholar]
- FEOKTISTOV I., BIAGGIONI I. Adenosine A2B receptors. Pharmacol. Rev. 1997;49:381–402. [PubMed] [Google Scholar]
- FEOKTISTOV I., BIAGGIONI I. Pharmacological characterisation of adenosine A2B receptors. Biochem. Pharmacol. 1998;55:627–633. doi: 10.1016/s0006-2952(97)00512-1. [DOI] [PubMed] [Google Scholar]
- FEOKTISTOV I., POLOSA R., HOLGATE S., BIAGGIONI I. Adenosine A2B receptors: a novel therapeutic target in asthma. TIPS. 1998a;19:148–153. doi: 10.1016/s0165-6147(98)01179-1. [DOI] [PubMed] [Google Scholar]
- FEOKTISTOV I., WELLS J., BIAGGIONI I. Adenosine A2B receptors as therapeutic targets. Drug Dev. Res. 1998b;45:198–206. [Google Scholar]
- GAO Z., CHEN T., WEBER M., LINDEN J. A2B adenosine and P2Y2 receptors stimulate mitogen-activated protein kinase in human embryonic kidney-293 cells cross-talk between cyclic AMP and protein kinase c pathways. J. Biol. Chem. 1999;274:5972–5980. doi: 10.1074/jbc.274.9.5972. [DOI] [PubMed] [Google Scholar]
- JERMAN J., BROUGH S., PRINJHA R., HARRIES M., DAVIS J., SMART D. Characterization using FLIPR of rat vanilloid receptor (rVR1) pharmacology. Br. J. Pharmacol. 2000;130:916–922. doi: 10.1038/sj.bjp.0703390. [DOI] [PMC free article] [PubMed] [Google Scholar]
- JI X., KIM Y., AHERN D., LINDEN J., JACOBSON K. [3H]MRS 1754, a selective antagonist radioligand for A2B adenosine receptors. Biochem. Pharmacol. 2001;61:657–663. doi: 10.1016/s0006-2952(01)00531-7. [DOI] [PMC free article] [PubMed] [Google Scholar]
- KLOTZ K., HESSLING J., HEGLER J., OWMAN C., KULL B., FREDHOLM B., LOHSE M. Comparative pharmacology of human adenosine receptor subtypes-characterisation of stably transfected receptors in CHO cells. Naunyn-Schmiedoberg's Arch. Pharmacol. 1998;357:1–9. doi: 10.1007/pl00005131. [DOI] [PubMed] [Google Scholar]
- LINDEN J., JACOBSON K. Molecular biology and pharmacology of recombinant adenosine receptors. Dev. Cardiovasc. Med. 1998;209:1–20. [Google Scholar]
- LINDEN J., TAMI T., FIGLER H., JIN X., ROBERVA A. Characterisation of human A2B adenosine receptors: radioligand binding, western blotting and coupling to Gq in human embryonic kidney 293 cells and HMC-1 mast cells. Mol. Pharmacol. 1999;56:705–713. [PubMed] [Google Scholar]
- LUPICA C., CASS W., ZAHNISER N., DUNWIDDIE T. Effects of the selective adenosine A2 receptor agonist CGS21680 on in vitro electrophysiology, cAMP formation and dopamine release in rat hippocampus and striatum. J. Pharmacol. Exp. Ther. 1990;252:1134–1141. [PubMed] [Google Scholar]
- MARQUARDT D., PARKER C., SULLIVAN T. Potentiation of mast cell mediator release by adenosine. J. Immunol. 1978;120:871–878. [PubMed] [Google Scholar]
- MARTIN P. Relative agonist potencies of C2-substituted analogues of adenosine: Evidence for adenosine A2B receptors in the guinea pig aorta. Eur. J. Pharmacol. 1992;216:235–242. doi: 10.1016/0014-2999(92)90365-b. [DOI] [PubMed] [Google Scholar]
- MCCONNELL H., OWIKI J., PARCE J., MILLER D., BAXTER H., WADA H., PITCHFORD S. The CM: biological applications of silicon technology. Science. 1992;257:1906–1912. doi: 10.1126/science.1329199. [DOI] [PubMed] [Google Scholar]
- MILLIGAN G., MARSHALL F., REES S. G16 as a universal G protein adapter: implications for agonist screening strategies. Trends Pharmacol. Sci. 1996;17:235–237. doi: 10.1016/0165-6147(96)10026-2. [DOI] [PubMed] [Google Scholar]
- MIRABET M., MALLOL J., LLUIS C., FRANCO R. Calcium mobilisation in Jurkat cells via A2B adenosine receptors. Br. J. Pharmacol. 1997;122:1075–1082. doi: 10.1038/sj.bjp.0701495. [DOI] [PMC free article] [PubMed] [Google Scholar]
- OWICKI J., PARCE J., KERCSO K., SIGAL G., MUIR V., VENTER J., FRASER C., MCCONNELL H. Continuous monitoring of receptor-mediated changes in metabolic rates of living cells. Proc. Natl. Acad. Sci. U.S.A, 1990;87:4007–4011. doi: 10.1073/pnas.87.10.4007. [DOI] [PMC free article] [PubMed] [Google Scholar]
- PEACHELL P., COLUMBO M., KAGEY-SOBOTKA A., LICHTENSTEIN L., MARONE G. Adenosine potentiates mediator release from human lung mast cells. Am. Rev. Respir. Dis. 1988;138:1143–1151. doi: 10.1164/ajrccm/138.5.1143. [DOI] [PubMed] [Google Scholar]
- PEAKMAN M., HILL S. Adenosine A2B-receptor-mediated cyclic AMP accumulation in primary rat astrocytes. Br. J. Pharmacol. 1994;111:191–198. doi: 10.1111/j.1476-5381.1994.tb14043.x. [DOI] [PMC free article] [PubMed] [Google Scholar]
- PORTER R., BENWELL K., LAMB H., MALCOLM C., ALLEN N., REVELL D., ADAMS D., SHEARDOWN M. Functional characterisation of agonists at recombinant human 5-HT2A, 5-HT2B and 5-HT2C receptors in CHO-K1 cells. Br. J. Pharmacol. 1999;128:13–20. doi: 10.1038/sj.bjp.0702751. [DOI] [PMC free article] [PubMed] [Google Scholar]
- POUCHER S., KEDDIE J., SINGH P., STOGGALL S., CAULKETT P., JONES G., COLLIS M. The in vitro pharmacology of ZM-241385, a potent, non-xanthine, A2A selective adenosine receptor antagonist. Br. J. Pharmacol. 1995;115:1096–1102. doi: 10.1111/j.1476-5381.1995.tb15923.x. [DOI] [PMC free article] [PubMed] [Google Scholar]
- RALEVIC V., BURNSTOCK G. Receptors for purines and pyrimidines. Pharamcol. Rev. 1998;50:415–492. [PubMed] [Google Scholar]
- RANDALL V., PATEL H., QUINN M., LAMB H., REVELL D., BENWELL K., CROUCHER M., PALMER A., SHEARDOWN M., PORTER R. Pharmacological characterisation of human Adenosine A2B receptors co-expressed with Gα16 in CHO-K1 cells. Br. J. Pharm. 2000;131:185P. [Google Scholar]
- SCHACHTER J., SROMEK S., NICHOLAS R., HARDEN T. HEK-293 Human Embryonic Kidney cells endogenously express the P2Y1 and P2Y2 receptors. Neuropharmacol. 1997;36:1181–1187. doi: 10.1016/s0028-3908(97)00138-x. [DOI] [PubMed] [Google Scholar]
- WOOD M., MURKITT K., GAGER T., RANSON J., SANGER G. Pharmacological characterisation of the human P2X4 receptor using the FLIPR. Pharmacol. Rev. Commun. 1999;10:341–347. [Google Scholar]
- YANG Q., LANIER S. Influence of G protein type on agonist efficacy. Mol. Pharmacol. 1999;56:651–656. doi: 10.1124/mol.56.3.651. [DOI] [PubMed] [Google Scholar]