Abstract
Nitric oxide (NO) signal transduction occurs through guanylyl cyclase-coupled receptors, which exist in both cytosolic and membranous locations. It has recently been reported from experiments using heart tissue that the membrane-associated receptor has enhanced sensitivity to NO. Owing to its potential importance, we tested this finding using a method of applying NO in known, constant concentrations. The results showed that the concentration–response curves for receptor activation in cytosolic and membrane preparations of two different tissues (cerebellum and platelets) were indistinguishable. In all cases, half-maximal activation required about 1 nM NO and the curves had Hill coefficients of close to 1. The differential sensitivity reported for the heart is attributed to NO being scavenged by myoglobin in the cytosol, but not in the membrane fraction.
Keywords: Nitric oxide, guanylyl cyclase, cGMP, heart, cerebellum, platelet, myoglobin
Introduction
Nitric oxide (NO) functions as a signalling molecule in almost all tissues of the body and regulates diverse processes, including blood vessel dilatation, platelet function, and the induction of long-term changes in the strength of central synaptic transmission (Moncada et al., 1991; Garthwaite & Boulton, 1995). The established mechanism for physiological NO signal transduction in these and other processes is through guanylyl cyclase (GC)-linked receptors. The resulting increase in intracellular cGMP can engage multiple downstream targets, including kinases, ion channels, and phosphodiesterases, to elicit various biological effects. The known GC-coupled receptors are αβ-heterodimers of which two isoforms, α1β1 and α2β1, are widely expressed at the mRNA and protein levels (Friebe & Koesling, 2003). So far, the two isoforms have appeared functionally and pharmacologically similar, whether studied in intact cells or in cell lysates (Friebe & Koesling, 2003; Gibb et al., 2003; Griffiths et al., 2003). However, complexity might arise from differences in subcellular location. In this respect, early data showed that NO-evoked GC activity was present in varying amounts in the soluble (cytosolic) and insoluble (particulate) fractions of several tissues (Arnold et al., 1977) and recent evidence indicates that the α1β1 receptor translocates to membranes in response to a Ca2+ signal (Zabel et al., 2002), whereas, in the brain, the α2β1 isoform is targeted to membrane-linked synaptic scaffold proteins (Russwurm et al., 2001).
From a study using heart tissue, an association with membranes was reported to sensitise the receptors to NO (Zabel et al., 2002). If correct, this conclusion might be important because it could provide a device for modulating cellular responsiveness to NO and/or for concentrating NO signal transduction into discrete subcellular domains analogous to those mediating conventional synaptic transmission. The result was based on differences in the concentrations of the NO donor, diethylamine/NO adduct (DEA/NO) needed to evoke GC activity in cytosol and membrane fractions. DEA/NO degrades to release NO with a half-life of 2.1 min (37°C). The amplitude, shape, and duration of the resulting NO concentration profile, however, is dependent on several factors, including pH and the rate of consumption of NO. Without rigorous checks, therefore, a shift in the DEA/NO concentration–response curve is difficult to interpret (Bellamy et al., 2002). Accordingly we have evaluated the veracity of the result using a method for delivering NO in known, fixed concentrations (Griffiths et al., 2003).
Methods
Tissue preparation
Adult female Sprague–Dawley rats (Charles River, Margate, U.K.) were anaesthetised with pentobarbitone (60 mg kg−1, i.p.) as approved by the British Home Office and the local ethics committee. The animals were perfused through the left ventricle with PBS until the returning buffer ran clear. The cerebella and/or hearts were swiftly removed and immersed in ice-cold PBS. Adhering connective tissue and visible vasculature were discarded under a dissecting microscope and the tissues were then cut into 1 mm cubes using a McIlwain tissue chopper, before being frozen on dry ice and homogenised (while frozen) using a stainless-steel mortar and pestle, both precooled in dry ice. The heart tissue was resuspended at 3–4 hearts per 5 ml in ice-cold buffer A, which contained (mM): NaCl (137), MgCl2 (0.5), NaH2PO4 (0.55), KCl (2.7), HEPES (25), glucose (5.6) and a protease inhibitor cocktail (complete mini EDTA-free; Roche, East Sussex, U.K.), pH 7.4. The cerebellar tissue was resuspended (at 3 per 5 ml) in buffer as before (Bellamy et al., 2000), except that the DTT concentration was reduced 10-fold to avoid problems of NO consumption (Bellamy et al., 2002). The preparations were then centrifuged for 5 min at 500 g to remove cellular debris.
To obtain platelets, whole blood was collected from four adult Sprague–Dawley rats into acid citrate dextrose solution (12.5%) and centrifuged at 300 g for 10 min. The platelet-rich plasma was withdrawn and recentrifuged to eliminate residual red and white blood cells. The supernatant was centrifuged for 10 min at 2000 g and the platelet pellet was resuspended in buffer A at a final concentration of 1 mg protein ml−1. The platelets were lysed by addition of an equal volume of ice-cold distilled water containing the protease inhibitor cocktail and 0.2 mM DTT, followed by sonication. The lysate was kept on ice.
Approximately 3 ml of each homogenate was centrifuged for 1 h at 100,000 g at 4°C. The supernatants (cytosols) were removed and kept on ice and the pellets (crude membrane fractions) were resuspended in the corresponding homogenisation buffers to a fifth to a tenth of the original homogenate volume. The protein concentrations were measured using the bicinchoninic acid method; for platelets and cerebellum, these values were measured in samples prepared in parallel but lacking DTT (which interferes with the protein assay).
Measurement of GC activity
The activity of the GC-coupled receptors in the different preparations was measured by exposing them to constant concentrations of NO, using a new method (Griffiths et al., 2003) in which NO release from a NONOate donor, in this case spermine/NO adduct (Alexis Biochemicals, Nottingham, U.K.), is balanced by NO consumption by a chemical scavenger 2-4-carboxyphenyl-4,4,5,5-tetramethylimidazoline-1-oxyl-3-oxide (CPTIO; Alexis Biochemicals). Aliquots of the tissue fractions were diluted 1 : 10 into an assay buffer containing 50 mM Tris-HCl, 3 mM MgCl2, 0.1 mM EGTA, 0.01 mM DTT, 0.05% BSA, 1 mM GTP, 0.2 mg ml−1 creatine kinase, 5 mM creatine phosphate, 1 mM 3-isobutyl-1-methylxanthine, 200 μM CPTIO, 1000 U ml−1 superoxide dismutase, and 300 μM uric acid (pH 7.4 at 37°C). Spermine/NO adduct was added from concentrated stock solutions (in 10 mM NaOH) to achieve varying steady-state NO concentrations (achieved within about 1 s) and, 2 min later, 100 μl of the reaction mix was removed and inactivated by addition to 200 μl of boiling hypotonic buffer (50 mM Tris HCl, 4 mM EDTA). cGMP was measured using radioimmunoassay. Results are given as the mean cGMP levels from ‘n' independent estimations±s.e.m. Each concentration-response curve was fitted to the Hill equation (in the Origin™ version 6.1; Aston Scientific Ltd, Stoke Mandeville, U.K.) to obtain values of the EC50 and Hill coefficient. Averaged data were analysed for significance using the unpaired Student's t-test (two-tailed). To scrutinise the results obtained by Zabel et al. (2002), the GC reaction mixture was changed to the one they used (with 1000 U ml−1 superoxide dismutase as an additional ingredient) and DEA/NO was used as the donor. The methods otherwise were as detailed above, except that the tissue fractions were diluted 1 : 100 into the reaction mixture and aliquots were sampled for cGMP determination at 1 min intervals for a total of 10 min.
NO measurement
NO concentrations were recorded in buffer A (1 ml) supplemented with 1000 U ml−1 superoxide dismutase and incubated in a sealed, stirred vessel (37°C) equipped with an NO electrode (Iso-NO, World Precision Instruments, Stevenage, U.K.).
Results
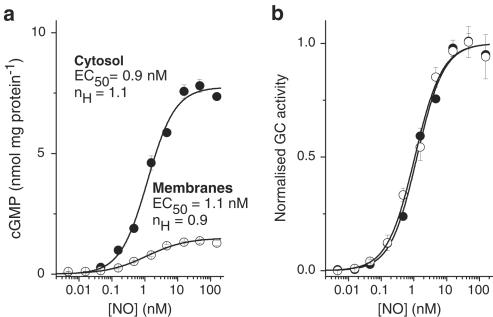
We initially selected tissue from a brain region (the cerebellum) in which the NO-cGMP pathway is highly expressed (Garthwaite & Boulton, 1995). NO elicited GC activity in both cytosolic and membrane fractions of the cerebellum, with the former dominating (Figure 1a). Concentration–response curves were constructed using NO delivered in known, constant concentrations (Griffiths et al., 2003). In both fractions, the threshold NO concentration required to stimulate GC activity was 50–100 pM and the maximum response occurred at about 10 nM (Figure 1a). The concentrations giving half-maximal activity (the EC50 values) were very similar (0.94±0.09 nM in the cytosol and 1.09±0.15 nM in the membranes, n=4; P>0.4), as were the Hill slopes (1.1±0.1 and 0.9±0.1; P>0.2). Accordingly, when normalised, the two curves were superimposable (Figure 1b).
Figure 1.
Comparison of the sensitivity of GC-coupled NO receptors in membrane and cytosol fractions of rat cerebellum. (a) Raw concentration–cGMP response curves for NO in cytosol and membrane fractions; n=3–4. The solid lines fit the data to the Hill equation; nH signifies the Hill coefficient. (b) The same data normalised to the maximal GC activity in each case (derived from the Hill fits). Protein concentrations were 140 μg ml−1 (cytosol) and 290 μg ml−1 (membranes).
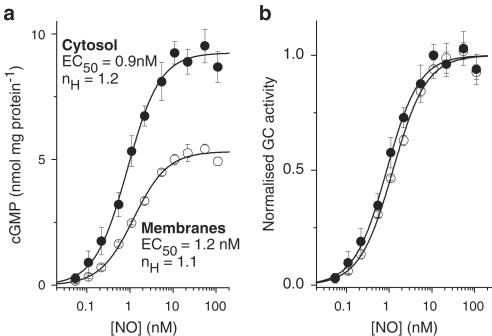
In case the cerebellum behaved unusually, the experiments were repeated using blood platelets, a well-known target for NO (Schwarz et al., 2001). The concentration-response curves for cytosol and membrane fractions were again closely similar (Figure 2a,b). The respective EC50 values (0.90±0.12 nM and 1.23±0.04 nM; n=3–4) were not significantly different from each other (P>0.07), nor from the corresponding values in the cerebellum (P>0.7 and 0.4). The Hill coefficients (1.2±0.2 and 1.1±0.03) were also no different from each other (P>0.6) or from the cerebellar values (P>0.3 and 0.1).
Figure 2.
Comparison of the sensitivity of GC-coupled NO receptors in membrane and cytosol fractions of rat platelets. (a) Raw concentration–cGMP response curves for NO in cytosol and membrane fractions; n=4. The solid lines fit the data to the Hill equation; nH signifies the Hill coefficient. (b) The same data normalised to the maximal GC activity in each case (derived from the Hill fits). Protein concentrations were 13 μg ml−1 (cytosol) and 40 μg ml−1 (membranes).
The experiments leading to the general conclusion that membrane association sensitises the receptors to NO were conducted on the rat heart (Zabel et al., 2002). In view of the above negative findings, we began to investigate the possibility that the phenomenon might be peculiar to this organ. However, it soon became evident that such an undertaking would be compromised. A homogenate of three rat hearts (previously perfused thoroughly in situ to wash out red blood cells) in 5 ml buffer was used to prepare concentrated membrane and cytosol fractions. The membrane fraction was its usual milky-white colour, but the cytosol was bright red-pink due to the presence of myoglobin, a cytosolic protein expressed in sufficient abundance to give the heart its gross colour (Garry et al., 1998). NO reacts very rapidly with myoglobin, forming nitrate and metmyoglobin (Eich et al., 1996); consequently, the presence of significant quantities of myoglobin in the cytosol will reduce the amount of NO available for activating GC-coupled receptors. Hence, more NO would have to be added to match the degree of receptor activation taking place in the absence of myoglobin.
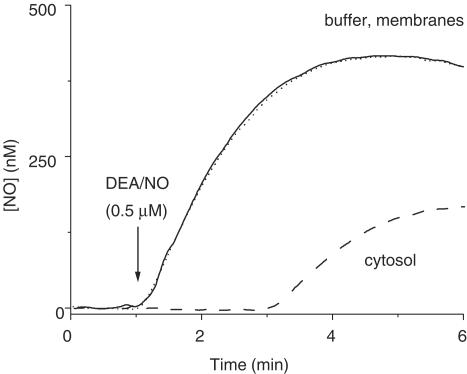
In order to evaluate this simple explanation for the results of Zabel et al. (2002), recordings were first made of the NO concentration profiles following addition of DEA/NO, the donor used to supply NO in the previous experiments. The DEA/NO concentration selected (0.5 μM) was one evoking approximately half-maximal activation of GC-coupled NO receptors in the heart cytosol preparations during a 10 min incubation (Zabel et al., 2002). In buffer, the NO concentration rose to a peak of approximately 400 nM after about 3 min (Figure 3). Unfortunately, the dilution of heart cytosol used in the study of Zabel et al. was not disclosed, but when DEA/NO was added to a 1 : 100 dilution of the cytosol (giving a final protein concentration equivalent to that used for assaying GC activity in the cerebellar cytosol), NO was undetectable for about 2 min. Afterwards, the concentration rose to reach a plateau about three-fold lower than in buffer. On the other hand, when the test was repeated on the membrane fraction (similarly diluted), the NO profile was the same as in the buffer.
Figure 3.
Consumption of NO by heart cytosol. Data are recordings of the NO concentration profiles over time resulting from addition of DEA/NO (0.5 μM; arrow) in buffer alone (solid line), or buffer containing the membrane fraction (dotted line) or the cytosolic fraction (dashed line) from rat heart. The traces are means of two runs and were smoothed by adjacent averaging (10 s bins). Protein concentrations were 130 μg ml−1 (cytosol) and 50 μg ml−1 (membranes).
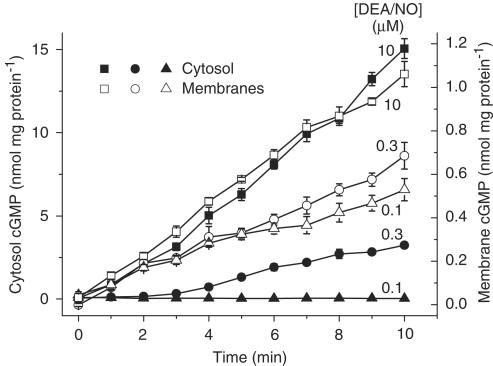
The method of assaying GC activity used by Zabel et al. was then applied to the heart fractions, except that the activity was followed at 1 min intervals for 10 min rather than at only a single time point (10 min). With a maximal DEA/NO concentration (10 μM; Zabel et al., 2002), cGMP accumulated fairly linearly over the 10 min period in both fractions, with the GC activity being more than 10-fold higher in the cytosol than in the membranes (Figure 4). In the membranes, DEA/NO concentrations spanning the EC50 value reported by Zabel et al. (2002), namely 0.1 and 0.3 μM, gave cGMP levels after 10 min that were, respectively, about 50 and 70% of the maximum. In the cytosol, the corresponding levels at this time were lowered to about 0 and 22%. These relative values are all closely similar to those reported by Zabel et al. (although, unfortunately, they did not disclose the absolute values). Inspection of earlier time points at the 0.3 μM concentration, however, showed that, in the membranes, there was near-maximal GC activity over the first 2 min (when the rate of NO release is highest), followed by a decline. In contrast, in the cytosol, there was no measurable GC activity for the same initial period, with a slow rise occurring afterwards. Measurement of the NO concentration under the same conditions gave the same result as before (Figure 3): on addition of DEA/NO (0.3 μM), NO rose immediately in the diluted membranes but was undetectable for about 2 min in the diluted cytosol (results not illustrated).
Figure 4.
DEA/NO-induced cGMP accumulation in heart membranes and cytosol. The data show cGMP levels over time in response to addition of DEA/NO at the indicated concentrations to membranes or cytosol from rat heart; n=4. Protein concentrations were 86 μg ml−1 (cytosol) and 66 μg ml−1 (membranes).
Discussion
From the two different tissues examined in detail, we conclude that there is no discernable alteration in NO sensitivity of membrane-associated versus cytosolic GC-coupled receptors and that previous evidence that the two differ is spurious because, in the tissue examined (heart), the exposures to NO in the two fractions were different.
The concentration of myoglobin in the heart is about 200 μmoles (kg wet weight)−1 (Godecke et al., 1999) from which it can be estimated that the diluted cytosol used in our experiments would contain the protein in the upper 100 nM range. At the concentration of DEA/NO tested in Figure 3 (0.5 μM), NO would be released at an initial rate of about 2.8 nM s−1 (assuming a half-life of 2.1 min and 1 mole of NO released per mole of DEA/NO; Schmidt et al., 1997). To scavenge NO for the period observed (2 min) would require 250 nM myoglobin, a concentration well within the range predicted to be present, even allowing for some of the protein being in its oxidised, unreactive, form (metmyoglobin). A similar period of NO consumption was observed at a lower DEA/NO concentration (0.3 μM) in another experiment (the one whose cGMP results are reported in Figure 4), which is explained by the protein concentration also being lower (see legends to Figures 3 and 4): assuming a proportionate reduction in myoglobin concentration (to 165 nM) it can be calculated that NO released from 0.3 μM DEA/NO would be grounded for 2 min, as was observed. The same myoglobin concentration would consume all NO releasable from 0.1 μM DEA/NO.
The presence of such a powerful NO scavenger means, of course, that the receptor cannot become activated until the scavenger is exhausted, which explains why, in the heart cytosol, there was no GC activity for 2 min following addition of 0.3 μM DEA/NO and no activity at all during a 10 min exposure to 0.1 μM DEA/NO whereas, with no scavenger (in the heart membranes), these same concentrations were sufficient to evoke half-maximal, or greater, net GC activity. Unfortunately, the problem imposed by myoglobin in the heart cytosol would also apply to the other NO delivery method used here for the cerebellum and platelets (NO reacts with myoglobin 1000-fold faster than with CPTIO); a method for removing myoglobin is needed to conduct the experiment meaningfully.
Rather than regulate their sensitivity to NO, the subcellular distribution of the GC-coupled NO receptors may reflect a physical compartmentation of the signal transduction cascade, although the possibility that functional differences exist when the proteins are in their normal cellular environment in vivo cannot be excluded.
Acknowledgments
This work was supported by The Wellcome Trust. We thank Nick Davies for assistance with tissue preparation. VW is a University College London MB PhD student.
Abbreviations
- CPTIO
2-4-carboxyphenyl-4,4,5,5-tetramethylimidazoline-1-oxyl-3-oxide
- DEA/NO
diethylamine/NO adduct
- GC
guanylyl cyclase
References
- ARNOLD W.P., MITTAL C.K., KATSUKI S., MURAD F. Nitric oxide activates guanylate cyclase and increases guanosine 3′:5′-cyclic monophosphate levels in various tissue preparations. Proc. Natl. Acad. Sci. U.S.A. 1977;74:3203–3207. doi: 10.1073/pnas.74.8.3203. [DOI] [PMC free article] [PubMed] [Google Scholar]
- BELLAMY T.C., GRIFFITHS C., GARTHWAITE J. Differential sensitivity of guanylyl cyclase and mitochondrial respiration to nitric oxide measured using clamped concentrations. J. Biol. Chem. 2002;277:31801–31807. doi: 10.1074/jbc.M205936200. [DOI] [PubMed] [Google Scholar]
- BELLAMY T.C., WOOD J., GOODWIN D.A., GARTHWAITE J. Rapid desensitization of the nitric oxide receptor, soluble guanylyl cyclase, underlies diversity of cellular cGMP responses. Proc. Natl. Acad. Sci. U.S.A. 2000;97:2928–2933. doi: 10.1073/pnas.97.6.2928. [DOI] [PMC free article] [PubMed] [Google Scholar]
- EICH R.F., LI T., LEMON D.D., DOHERTY D.H., CURRY S.R., AITKEN J.F., MATHEWS A.J., JOHNSON K.A., SMITH R.D., PHILLIPS G.N., JR, OLSON J.S. Mechanism of NO-induced oxidation of myoglobin and hemoglobin. Biochemistry. 1996;35:6976–6983. doi: 10.1021/bi960442g. [DOI] [PubMed] [Google Scholar]
- FRIEBE A., KOESLING D. Regulation of nitric oxide-sensitive guanylyl cyclase. Circ. Res. 2003;93:96–105. doi: 10.1161/01.RES.0000082524.34487.31. [DOI] [PubMed] [Google Scholar]
- GARRY D.J., ORDWAY G.A., LORENZ J.N., RADFORD N.B., CHIN E.R., GRANGE R.W., BASSEL-DUBY R., WILLIAMS R.S. Mice without myoglobin. Nature. 1998;395:905–908. doi: 10.1038/27681. [DOI] [PubMed] [Google Scholar]
- GARTHWAITE J., BOULTON C.L. Nitric oxide signaling in the central nervous system. Annu. Rev. Physiol. 1995;57:683–706. doi: 10.1146/annurev.ph.57.030195.003343. [DOI] [PubMed] [Google Scholar]
- GIBB B.J., WYKES V., GARTHWAITE J. Properties of NO-activated guanylyl cyclases expressed in cells. Br. J. Pharmacol. 2003;139:1032–1040. doi: 10.1038/sj.bjp.0705318. [DOI] [PMC free article] [PubMed] [Google Scholar]
- GODECKE A., FLOGEL U., ZANGER K., DING Z., HIRCHENHAIN J., DECKING U.K., SCHRADER J. Disruption of myoglobin in mice induces multiple compensatory mechanisms. Proc. Natl. Acad. Sci. U.S.A. 1999;96:10495–10500. doi: 10.1073/pnas.96.18.10495. [DOI] [PMC free article] [PubMed] [Google Scholar]
- GRIFFITHS C., WYKES V., BELLAMY T.C., GARTHWAITE J. A new and simple method for delivering clamped nitric oxide concentrations in the physiological range: application to activation of guanylyl cyclase-coupled nitric oxide receptors. Mol. Pharmacol. 2003;64:1349–1356. doi: 10.1124/mol.64.6.1349. [DOI] [PubMed] [Google Scholar]
- MONCADA S., PALMER R.M., HIGGS E.A. Nitric oxide: physiology, pathophysiology, and pharmacology. Pharmacol. Rev. 1991;43:109–142. [PubMed] [Google Scholar]
- RUSSWURM M., WITTAU N., KOESLING D. Guanylyl cyclase/PSD-95 interaction: targeting of the NO-sensitive alpha2beta1 guanylyl cyclase to synaptic membranes. J. Biol. Chem. 2001;276:44647–44652. doi: 10.1074/jbc.M105587200. [DOI] [PubMed] [Google Scholar]
- SCHMIDT K., DESCH W., KLATT P., KUKOVETZ W.R., MAYER B. Release of nitric oxide from donors with known half-life: a mathematical model for calculating nitric oxide concentrations in aerobic solutions. Naunyn Schmiedebergs Arch. Pharmacol. 1997;355:457–462. doi: 10.1007/pl00004969. [DOI] [PubMed] [Google Scholar]
- SCHWARZ U.R., WALTER U., EIGENTHALER M. Taming platelets with cyclic nucleotides. Biochem. Pharmacol. 2001;62:1153–1161. doi: 10.1016/s0006-2952(01)00760-2. [DOI] [PubMed] [Google Scholar]
- ZABEL U., KLEINSCHNITZ C., OH P., NEDVETSKY P., SMOLENSKI A., MULLER H., KRONICH P., KUGLER P., WALTER U., SCHNITZER J.E., SCHMIDT H.H. Calcium-dependent membrane association sensitizes soluble guanylyl cyclase to nitric oxide. Nat. Cell Biol. 2002;4:307–311. doi: 10.1038/ncb775. [DOI] [PubMed] [Google Scholar]


