

Abstract
We calculate the size distribution of two-dimensional aggregates, for different simple dynamical growth models. The resulting size distributions of these domains, at steady state, are shown to depend strongly on the mode of domain growth. We then compare to the measured size-distribution of focal-adhesion domains. Using our calculation and the measured exponential distribution of focal-adhesion domain lengths can be used to test the validity of recent models proposed to describe the dynamics of these complexes in adhering cells.
INTRODUCTION
Recently there have been several theoretical models that attempt to describe the dynamics of focal adhesion (FA) complexes in cells (1–5). In all of these models, the actin stress fibers exert a force on the proteins that make up the FA domain (plaque). Depending on the model, this applied force is assumed to create either a density or a stress gradient in the FA domain that initiates its growth or shrinkage. By growth and shrinkage, we mean the addition or subtraction of FA proteins, respectively. In the first model (1–3) the density gradients, and the consequent growth/shrinkage, are confined to the ends of the elongated (linear) FA domain, while in the second model (4) this process is spread out over the entire FA area. In the last model (5), the growth/shrinkage is found to be initiated where the (shear) stress is the highest, thus concentrated at the border between actin stress fibers and the FA domain. In this article, we show that different modes of FA growth lead to different size-distributions, at steady state, which can therefore be used to test their validity, by comparing to recent experimental data (6,7).
We will calculate a few simple examples, while the dynamics of realistic models (1–5) are probably more complicated. Note that in reality, the system of FA complexes changes dynamically until, in some cases, a steady-state distribution of FA sizes and forces is reached. We are addressing here this saturated, steady-state regime by starting from a model of the growth dynamics and then solving the resulting Fokker-Planck equation (8). Similar models have arisen in the description of other dynamical systems (9,10).
SIMPLE GROWTH MODELS
We model various kinds of growth of flat (two-dimensional) aggregates that represent the focal adhesion domains (Fig. 1). The first geometry that we consider is a compact circular domain (Fig. 1, a and b). By “compact,” we mean that the density of the plaque proteins is constant and uniform throughout the domain, so that the total number of proteins is linearly related to the FA area.
FIGURE 1.

Schematic growth mechanisms of focal adhesion domains.
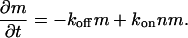
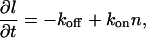
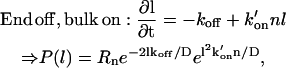
For a circular domain that can grow only at the edges (Fig. 1 a), we have the dynamic equation for the domain area m,
 |
(1) |
where kon and koff are the on- and off-rates, n is the surrounding density of proteins, and r is the radius of the domain, such that m ∝ r2. We assume that the average density 〈n〉 is constant (infinite reservoir). The on-rate kon depends on the average applied force of the stress fibers per plaque protein, and is taken to be constant for a given cell. This is due to the observation that as the size of the FA grows, so does the overall force there (11,12), so that the force per protein (or force density) is roughly a constant. Inserting m ∝ r2 into Eq. 1, we get an equation of motion for the radius r,
 |
(2) |
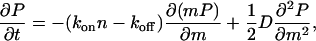
The corresponding Fokker-Plank equation for the probability density function (PDF) is
 |
(3) |
The noise term D accounts for the fluctuations in the values of n, kon, and koff, which result in a spread of growth rates. This noise may be thermal in origin and also due to fluctuations in the force applied by the stress fibers due to fluctuations in the activity of the pulling motors. Both thermal and active noise sources contribute to the value of D. We have assumed that the noise has no temporal or spatial correlations. This is the simplest approximation possible, and is reasonable if there are many noise sources that are incoherent with each other. This means that even if any individual noise source does have some nontrivial correlations, these are lost due to the combined effect of all the noise sources. The noise sources that we think are dominant are: fluctuations in the applied force by the actin stress fiber; fluctuations in the local density of FA proteins; and variability of the underlying substrate. The fluctuations in the force applied by the stress fibers depend on the fluctuations in the number and activity of the myosin motors. If the process of myosin attachment to the actin stress fibers is a random process, its relative noise will decrease with increasing number of motors. We therefore expect that the distribution becomes narrower (wider) when the myosin activity is increased (decreased).
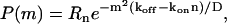
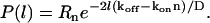
The steady-state PDF we find from Eq. 3 is an exponential in r,
 |
(4) |
where Rn is a normalization constant. Note that n that appears in the expressions for the PDF is the average value 〈n〉. For the PDF to be nonzero and normalizable, we must have koff > konn. This exponential distribution in the radius corresponds to a subexponential distribution for the area m: 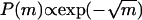 .
.
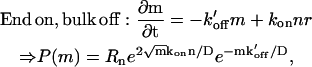
Next, we consider a circular domain that can grow at any point in its interior (Fig. 1 b). In that case, Eq. 1 becomes
 |
(5) |
The corresponding Fokker-Plank equation is
 |
(6) |
and the resulting PDF is now a Gaussian in m,
 |
(7) |
where we have again the condition koff > konn, for normalization.
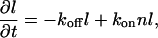
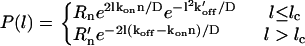
The second geometry that we consider is a compact linear domain of constant width and variable length l. For linear domains that grow/shrink at the two ends only (Fig. 1 c), we have
 |
(8) |
which is similar to Eq. 2, and similarly gives an exponential distribution for the length l,
 |
(9) |
For growth at any point along the linear domain (Fig. 1 d), we have
 |
(10) |
which is similar to Eq. 5, and similarly gives a Gaussian distribution of lengths (similar to Eq. 7): P(l) ∝ exp(−l2).
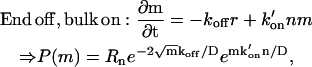
The other possible options for the linear domain are a mix of end/bulk on- and off-rates, and are:
 |
 |
where the last case is clearly divergent for l → ∞.
For the circular domain, we also list the two options:
 |
 |
where again the second case is divergent, and is therefore not physical.
COMPARISON WITH EXPERIMENTS
In the experiments it has been established that the area of a focal adhesion domain is linearly proportional to the force transmitted from the cell to the substrate at that site (11,12). We can therefore use the measured force distribution as a measure of the distribution of FA domain sizes. The distribution of the observed FA forces (Fig. 2, inset, (6)) is shown in Fig. 2, and has a clear exponential tail. A similar exponential distribution of the overall detachment force of a cell to the substrate was observed in Goffin et al. (7) (Fig. 2, inset).
FIGURE 2.

Measured force distribution of individual focal adhesion domains (circles (6)), compared to Eq. 12 (solid line). Inset shows the distribution of detachment forces (circles (7), solid line, Eq. 12).
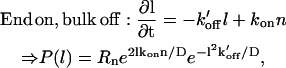
For small focal adhesion domains there is an initial rise and a peak in the distribution (Fig. 2). This may be because for small domains the molecules can come off at any point, i.e., the growing/shrinking ends of the domain have a finite length lc. Within this end part of length lc the proteins can detach anywhere, while they still attach only through the domain edges (the end-on/bulk-off option listed above). When a domain is longer than lc, the proteins continue to detach from the same ends of length lc, while the main part of the FA domain is protected from breakup. This is probably due to the overlying stress fibers that protect the inner part of the FA domain from breaking up (13).
Following the results listed above, this dynamics is therefore described by
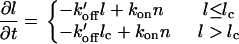 |
(11) |
The resulting PDF is
 |
(12) |
A fit using this expression is shown as the solid line in Fig. 2. The parameters used for this fit are in terms of the forces and not the FA lengths l, since this is the data we have available at this time.
CONCLUSION
From our above analysis we conclude that the exponential distribution, coupled with the clearly linear (highly elongated) shapes of the FA domains (11), supports a model of growth of these domains which is confined to their ends (13) (Eq. 11). By “linear,” we mean that the FA domains grow/shrink in length, while keeping their width roughly constant, so that their area is linear in their length. This assumption seems to apply for long FA (14), but not for small domains, where the width is proportional to the length. This mode of end-growth of the FA domains is also supported by the observation of the dynamics of molecular adsorption in FA (13). The microscopic picture of the growth of FAs that emerges is the following: the stress fibers are attached to and grow from the FA plaque proteins in one direction, leading to a highly directional force. If the plaque proteins can join the FA only from the surrounding membrane, then due to the directionality of the force they may grow only at one of the FA ends (1–3,5). The overlying stress fibers serve to give the directionality of the FA molecules and may also serve as a physical barrier to protein addition/loss from the center of the FA domain. This will result in the “ends on/off” behavior of linear FA domains, as we observed in the previous section.
When the tension force of the actin stress fiber is removed abruptly over the entire area of the FA, by chemical treatment or laser incision (15), the FA proteins disperse by diffusion in all directions. Such a diffusion-induced dispersion of a high density aggregate will result in the observed exponential decay with time of the overall FA area. Furthermore, when a FA already exists there can certainly be proteins that attach/detach from it to the cytoplasm, over its entire area. The dynamics that control the overall size of the FA are nevertheless confined to its ends (for an elongated (linear) domain), as we find from the observed exponential size distribution.
The feedback interaction between the stress fibers and the FA domains determines the arrangement of both with respect to the overall cell contact area (16). This article proposes a deterministic continuum model, whereby the size distribution of the individual FA domains is not treated. Nevertheless, the assumption made in that article that the FA domains grow by aggregation of membrane-bound proteins is in agreement with our result that boundary growth of elongated domains fits the observed size-distribution. It also shows the dominant role of the stress fibers in determining the arrangement of the FA domains in the cell (16), which makes it likely that the stochastic noise we treat comes from fluctuations in these forces.
The dynamics of growth of the FA described by the recently proposed models (6,7,11,13), are more complicated than the simple cases we calculated here. For example, various molecular switches control the rate of growth/shrinkage and change their state continuously throughout the length of the FA domain (14). The growth may also change continuously along the length of the FA due to the stress profile induced by the actin stress fibers (5). The growth/shrinkage may therefore happen at a highly nonuniform rate, and needs to be calculated using detailed simulations (1). The assumption of constant force per unit area of FA may also break down when the cell adheres to a highly flexible substrate (3), and the on/off rates may therefore become size-dependent, i.e., functions of the FA radius r or length l. The steady-state distribution for these cases can be calculated as we did for the simpler models. Our calculation here of dynamics that are constant and confined to the ends, or uniform throughout the domain, represents just the simple limiting cases. Nevertheless, our calculation may indicate that a comparison of the steady-state FA size distribution that results from different theoretical models, with the observed distribution (Fig. 2), can be an additional useful test of the models' validity.
Finding an experimental way to check these conclusions is indeed a challenge. One possibility is to induce growth all long the edges of the FA, which should result in a longer tail distribution of the form  (see Eqs. 1–4). This may be done by rapidly shearing the cell in all directions such that the FAs feel an isotropic average pulling force, by placing the cell between microplates (17).
Acknowledgments
I thank Sam Safran, Achim Besser, Alice Nicolas, Micha Kozlov, Benny Geiger, and Daniel Wagner for useful discussions.
I thank the Israel Science Foundation grant, the European Union SoftComp NoE grant, and the Robert Rees Fund for Applied Research, for their support.
References
- 1.Besser, A., and S. A. Safran. 2006. Force-induced adsorption and anisotropic growth of focal adhesions. Biophys. J. 90:3469–3484. [DOI] [PMC free article] [PubMed] [Google Scholar]
- 2.Nicolas, A., B. Geiger, and S. A. Safran. 2004. Cell mechanosensitivity controls the anisotropy of focal adhesions. Proc. Natl. Acad. Sci. USA. 101:12520–12525. [DOI] [PMC free article] [PubMed] [Google Scholar]
- 3.Nicolas, A., and S. A. Safran. 2006. Limitation of cell adhesion by the elasticity of the extracellular matrix. Biophys. J. Epub ahead of print. [DOI] [PMC free article] [PubMed]
- 4.Shemesh, T., B. Geiger, A. D. Bershadsky, and M. M. Kozlov. 2005. Focal adhesions as mechanosensors: a physical mechanism. Proc. Natl. Acad. Sci. USA. 102:12383–12388. [DOI] [PMC free article] [PubMed] [Google Scholar]
- 5.Raz-Ben-Aroush, D., and H. D. Wagner. 2006. Shear stress profile along a cell focal adhesion. Adv. Mater. 18:1537–1540. [Google Scholar]
- 6.Saez, A., A. Buguin, P. Silberzan, and B. Ladoux. 2005. Is the mechanical activity of epithelial cells controlled by deformations or forces? Biophys. J. Biophys. Lett. 89:L52–L54. [DOI] [PMC free article] [PubMed] [Google Scholar]
- 7.Goffin, J. M., P. Pittet, G. Csucs, J. W. Lussi, J. J. Meister, and B. Hinz. 2006. Focal adhesion size controls tension-dependent recruitment of α-smooth muscle actin to stress fibers. J. Cell Biol. 172:259–268. [DOI] [PMC free article] [PubMed] [Google Scholar]
- 8.Risken, H. 1996. The Fokker-Planck Equation: Methods of Solution and Applications, 2nd Ed. Springer, Berlin, Germany.
- 9.Leng, J., S. U. Egelhaaf, and M. E. Cates. 2003. Kinetics of the micelle-to-vesicle transition: aqueous lecithin-bile salt mixtures. Biophys. J. 85:1624–1646. [DOI] [PMC free article] [PubMed] [Google Scholar]
- 10.Stukalin, E. B., and A. B. Kolomeisky. 2004. Simple growth models of rigid multifilament biopolymers. J. Chem. Phys. 121:10971104. [DOI] [PubMed] [Google Scholar]
- 11.Balaban, N. Q., U. S. Schwarz, D. Riveline, P. Goichberg, G. Tzur, I. Sabanay, D. Mahalu, S. Safran, A. Bershadsky, L. Addadi, and B. Geiger. 2001. Force and focal adhesion assembly: a close relationship studied using elastic micropatterned substrates. Nat. Cell Biol. 3:466–472. [DOI] [PubMed] [Google Scholar]
- 12.Puech, P. H., A. Taubenberger, F. Ulrich, M. Krieg, D. J. Muller, and C. P. Heisenberg. 2005. Measuring cell adhesion forces of primary gastrulating cells from zebra fish using atomic force microscopy. J. Cell Sci. 118:4199–4206. [DOI] [PubMed] [Google Scholar]
- 13.Wehrle-Haller, B., and B. A. Imhof. 2002. The inner lives of focal adhesions. Trends Cell Biol. 12:382–389. [DOI] [PubMed] [Google Scholar]
- 14.Ballestrem, C., N. Erez, J. Kirchner, Z. Kam, A. Bershadsky, and B. Geiger. 2006. Molecular mapping of tyrosine-phosphorylated proteins in focal adhesions using fluorescence resonance energy transfer. J. Cell Sci. 119:866–875. [DOI] [PubMed] [Google Scholar]
- 15.Lele, T. P., J. Pendse, S. Kumar, M. Salanga, J. Karavitis, and D. E. Ingber. 2006. Mechanical forces alter zyxin unbinding kinetics within focal adhesions of living cells. J. Cell. Physiol. 207:187–194. [DOI] [PubMed] [Google Scholar]
- 16.Novak, I. L., B. Slepchenko, A. Mogilner, and L. M. Loew. 2004. Cooperativity between cell contractility and adhesion. Phys. Rev. Lett. 93:268109. [DOI] [PubMed] [Google Scholar]
- 17.Suresh, S., J. Spatz, J. P. Mills, A. Micoulet, M. Dao, C. T. Lim, M. Beil, and T. Seufferlein. 2005. Connections between single-cell biomechanics and human disease states: gastrointestinal cancer and malaria. Acta Biomater. 1:16–30. [DOI] [PubMed] [Google Scholar]