Abstract
Molecular mobility is increasingly considered a key factor influencing storage stability of biomolecular substances, because it is thought to control the rate of detrimental reactions responsible for reducing the shelf life of, for instance, pharmaceuticals, food, and germplasm. We investigated the relationship between aging rates of germplasm and the rotational motion of a polar spin probe in the cytoplasm under different storage conditions using saturation transfer electron paramagnetic resonance spectroscopy. Rotational motion of the spin probe in the cytoplasm of seed and pollen of various plant species changed as a function of moisture content and temperature in a manner similar to aging rates or longevity. A linear relationship was established between the logarithms of rotational motion and aging rates or longevity. This linearity suggests that detrimental aging rates are associated with molecular mobility in the cytoplasm. By measuring the rotational correlation times at low temperatures at which experimental determination of longevity is practically impossible, this linearity enabled us to predict vigor loss or longevity. At subzero temperatures, moisture contents for maximum life span were predicted to be higher than those hitherto used in genebanks, urging for a reexamination of seed storage protocols.
Conservation of the genetic biodiversity of plants can be achieved by preserving seeds and pollens in genebanks. An important goal of germplasm facilities is the long-term preservation of viability. Because genebank operators must know when the loss of viability commences to timely regenerate samples, effective tools to predict longevity under given storage conditions and to minimize damage to the germplasm are required. A number of empirical equations to predict or describe longevity have been devised, with the most important one being the viability equation, developed by Ellis and Roberts (1). This viability equation has widely proven its validity (1–8). Nevertheless, it has been recognized that this empirical equation has some limitations regarding the validity of predictions, particularly at low temperatures and moisture contents (mcs) (5, 9, 10).
In recent years, a hypothesis to describe storage behavior has been developed by Vertucci and coworkers, based on thermodynamic considerations (9–11). These authors suggested that the limiting factor in aging of dry germplasm is the availability of water for chemical reactions, and that therefore the water potential would be a better way of predicting optimal storage conditions. Their approach resulted in the observation that the optimum mcs of storage shifted to higher values with lower temperatures (9, 10, 12). Because the optimum storage conditions and predictions of germplasm longevity still remain a matter of debate (13, 14), we investigated alternative ways of describing longevity.
Over the past years, an approach has been introduced to understand the effects of water content and temperature on longevity of germplasm. This kinetic model is based on the formation of glasses: highly viscous, semiequilibrium solid liquids (15). Low temperatures and low water contents drive the viscosity of the cytoplasm of tissues to such high values that it will form a glassy state (12, 16–18). It is assumed that the high viscosity of intracellular glasses decreases molecular mobility and impedes diffusion within the cytoplasm, thus slowing deleterious reactions and changes in structure and chemical composition during aging (12, 18–21). Molecular mobility is increasingly considered a key factor influencing storage stability, because it is thought to control the rate of detrimental aging reactions responsible for reducing shelf life (18–24).
Saturation transfer electron paramagnetic resonance (ST-EPR) spectroscopy is a powerful technique that enables the determination of the rotational correlation time (τR) of a spin probe that is incorporated into the material under study. For random rumbling, τR roughly corresponds to the average time for a molecule to progress one radian (25). The time scale of the motion detected by this technique ranges from 10−7 to 10−3 s, encompassing an extremely wide range of temperatures and mcs (24, 26, 27). We have previously assessed the rotational motion of the polar spin probe 3-carboxy-2,2,5,5-tetramethylpyrrolidine-1-oxyl (CP) incorporated in the cytoplasm of seeds and pollen as a function of mc and temperature (24, 27). It was shown that the temperature dependence of the rotational motion of the spin probe in seeds changed around the glass transition temperature (Tg), with the activation energy of rotational motion changing by a factor of three when tissues were stored below or above Tg (27). Similar changes in activation energy were found in the aging kinetics of Typha pollen (12). The altered activation energy below Tg indicates that extrapolation of reaction rates above Tg to conditions below Tg can lead to incorrect estimates of shelf life (12, 28). Using molecular mobility as a potential means to describe aging kinetics, the possible changes in kinetics resulting from the formation of glasses in the biological systems will be accounted for.
Here, we determined the rotational motion of the spin probe CP in the cytoplasm of seeds and pollen at different temperatures and mcs using ST-EPR spectroscopy. For Impatiens seeds and Typha pollen, the rotational motion was correlated to their aging rates or half-viability times, derived from our own experiments, both as a function of temperature and mc. Similarly, rotational motion of CP in pea axes was compared with the aging rates of pea seeds, based on vigor loss (10) or loss of germination capacity (3), derived from data in the literature. Finally, longevity of pea seeds was estimated by the viability equation of Ellis and Roberts (1, 3) and correlated to the rotational motion in the axes. The established linear relationship enabled extrapolations of vigor loss and longevity to subzero temperatures. The importance of these estimates in relation to germplasm storage protocols is discussed.
Methods
Plant Material, Sample Preparation, and Storage Experiments.
Seeds of Impatiens walleriana L. cv. impulse lila [initial mc of 0.05 g H2O g dw−1 (g/g)] were a gift from Novartis (Enkhuizen, The Netherlands). Initial percentage germination was 93%. Pea (Pisum sativum L.) seeds were obtained from Nunhems Zaden (Haelen, The Netherlands). Initial mc and percentage germination were 0.07 g/g and 99%, respectively. Mature male inflorescences of Typha latifolia L. were collected near Wageningen, The Netherlands and allowed to shed their pollen in the laboratory. Pollen (94% germination) was cleaned, dried in dry air to 0.05–0.08 g/g, and stored at −20°C until use.
For labeling of the tissues with CP (Sigma), Impatiens seeds were soaked in water for 2 h at 20°C, after which the seed coat was removed. Pea seeds were soaked in water for 16 h at 15°C, after which the axes were excised. Visible germination was not detected until 72 h. Decoated seeds of Impatiens and isolated axes of pea were incubated for 45 min in 1 mM CP solution at 20°C. Potassium ferricyanide was then added to a final concentration of 200 mM, and the seeds were incubated for another 15 min. Ferricyanide broadens spin probe signals in the solution surrounding the cells to invisibility (29). Subsequently, the labeled material was dried in dry air (3% relative humidity) for 24 h to an mc of 0.04 g/g. Germination experiments were performed to ensure that incubation in the spin probe/ferricyanide solution and subsequent drying back did not affect the percentage of germination. Labeling of Typha pollen was performed as described (24). Briefly, pollen was prehydrated in water vapor for 16 h at 5°C to an mc of 0.7 g/g and then mixed at 25°C with liquid germination medium containing 2.5 mM CP, after which the pollen was recovered by filtration. The pollen was then mixed with a solution of 1 mM CP and 120 mM potassium ferricyanide. After 5 more min, the pollen was recovered by filtration and rapidly dried in a flow of dry air (3% relative humidity) at room temperature to mcs < 0.05 g/g.
Immediately after drying, all tissues were exposed to various saturated salt solutions (30) at 25°C for 3–10 days to obtain different mcs. Approximately 20 seeds of Impatiens, three axes of pea, or 20 mg Typha pollen were sealed in a 2-mm diameter capillary for EPR measurements. After the measurements, the tissues were removed from the capillaries, and mcs were determined. Mcs were analyzed by weighing the samples before and after heating at 96°C for 36–48 h.
Longevity of Impatiens seeds was monitored during 2 yr under controlled storage conditions by using saturated salt solutions of various relative humidities in the dark at 25°C. At various intervals during storage, approximately 100 seeds were soaked on filter paper in the dark at 20°C. Germinated seeds were counted until final percentage germination was achieved (after approximately 3 wk). Aging rates were calculated as the absolute value of the slope of the linear regression between germination percentage (expressed on probability scale) and storage time.
Aging rates for pea seeds were derived from ref. 10 and represent the absolute value of the slope of the loss in vigor (radicle length multiplied by percentage germination) over storage time. Aging rates for Typha pollen were derived from our previously published results (12) and represent the absolute value of the slope of the linear regression between germination percentage (plotted on a probability scale) over storage time. The half-viability times (P50) were also derived from ref. 12 and represent the time until germination had decreased to 50%.
ST-EPR Measurements.
ST-EPR spectroscopy was employed to obtain the τR of CP (24, 27) by using an X-band EPR spectrometer (Bruker Analytik, Rheinstetten, Germany; model 300E). For ST-EPR measurements, the second harmonic quadrature absorption signal was detected under the following conditions: field modulation amplitude 0.5 mT, microwave power 100 mW, and field modulation frequency 50 kHz. The phase was set with the self-null method (31). In ST-EPR spectroscopy, τR values are obtained in an empirical way by using reference material of known viscosity. Here, spectra of CP in anhydrous glycerol were used to construct a calibration curve according to ref 32. Because the viscosity data for glycerol are only published above −35°C, and viscosities at lower temperatures were needed to construct the calibration curve, the known viscosity data for glycerol were fitted to the empirical Williams–Landel–Ferry (WLF) equation to provide the viscosities at lower temperatures (see ref. 32 for details). The calculated Tg, obtained from the fit of the WLF equation with the universal constants, was found to be identical to the literature value, validating the use of the universal constants (32). The line shape parameter L"/L, derived from the ST-EPR spectra, was used for the determination of τR (27). It is possible that anisotropic motion of the spin probe, resulting from the interaction with its environment, might affect ST-EPR spectra. However, based on ST-EPR on anisotropic systems (33), one can expect that this effect will be mainly exerted on the central part of the spectra, and that the effect on the L"/L ratio will be small. From the calibration curve, representing the L"/L ratio of CP in glycerol against τR, the τR values of CP in the seeds and pollen were obtained by interpolation. The τR values of CP in the different tissues were determined at different temperatures and mcs, corresponding to the storage conditions under which longevity or aging rates were determined. The variation of τR values within samples exposed to similar mc/temperature regimes was on average 5%.
Results
Temperature-Dependent Changes in Aging Rates Are Related to Rotational Motion.
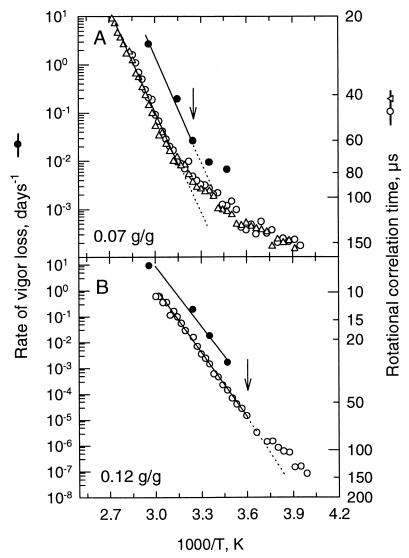
Changes in aging rate as a function of temperature were compared with changes in rotational motion of the spin probe CP for various seeds and pollen. A common way to plot the temperature dependence of an event is by Arrhenius plots, where the logarithm of the molecular mobility is plotted as a function of the reversed temperature (Fig. 1). In Fig. 1, the aging rate of pea seeds was expressed as the rate of vigor loss over time, where vigor is measured as hypocotyl length multiplied by percentage germination (10). A slower rotational motion, i.e., an increased τR of the spin probe in the cytoplasm of axes of pea, corresponded to a lower aging rate of the seed (Fig. 1). With decreasing temperature, the rotational motion and the aging rate both decreased in a similar manner, as shown for pea embryonic axes at two mcs (Fig. 1). The arrow indicates the onset Tg for the pea axes as measured by differential scanning calorimetry (obtained from ref. 24). When the cytoplasm of the axes was brought into a glassy state by decreasing the temperature below 34°C for axes with 0.07 g/g (indicated by the arrow), the temperature dependence of both aging rate and rotational motion deviated from Arrhenius behavior, as indicated by the deviation of a linear regression (Fig. 1A, dotted line). When the tissues were more hydrated (0.12 g/g), all data points for the aging rates were above Tg (arrow, Fig. 1B) and parallel to the rotational motion. The rotational motion deviated from Arrhenius behavior around Tg. The observation that both parameters changed parallel to one another prompted us to plot the aging rates obtained at different mcs and temperatures as a function of the τR.
Figure 1.
Dependence of aging rate (expressed as rate of vigor loss, day−1) of pea seeds (●) and τR (○ and ▵) on temperature of pea embryonic axes at an mc of 0.07 g/g (A) and an mc of 0.12 g/g (B). Two separate measurements of the τR of CP in pea axes at 0.07 g/g are shown in A to indicate the reproducibility of the ST-EPR measurements. Aging rates were taken from ref. 10. The arrows indicate the onset Tg as measured by differential scanning calorimetry, obtained from ref. 24, using a scanning rate of 10°C min−1.
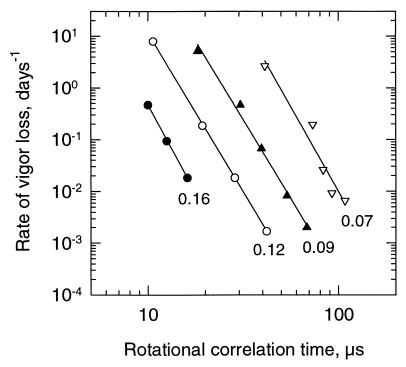
Aging rates of pea seeds stored at five different temperatures (15, 25, 35, 45, and 65°C) and four mcs (0.07, 0.09, 0.12, or 0.16 g/g) were plotted vs. the rotational motion of CP in pea axes, determined under similar conditions of mc and temperature (Fig. 2). For each mc, a linear relationship was observed between the logarithm of the aging rate and the logarithm of τR of CP, determined at the different temperatures (Fig. 2).
Figure 2.
Relationship between aging rate (expressed as rate of vigor loss, day−1) of pea seeds and τR of pea axes. Aging rates were determined at different temperatures (15, 25, 35, 45, and 65°C) and mcs (indicated values in g/g). Data were plotted on a double logarithmic scale {log y = a + b log x}. Mcs, constants, and correlation coefficients of the linear regressions are: ●, 0.16 g/g (a = 6.53, b = −6.86, r2 = 0.9995); ○, 0.12 g/g (a = 7.21, b = −6.15, r2 = 0.99993); ▴, 0.09 g/g (a = 8.53, b = −6.10, r2 = 0.991); and ▿, 0.07 g/g (a = 11.12, b = −6.57, r2 = 0.946). Aging rates of pea seeds were obtained by interpolation of previously determined data (10).
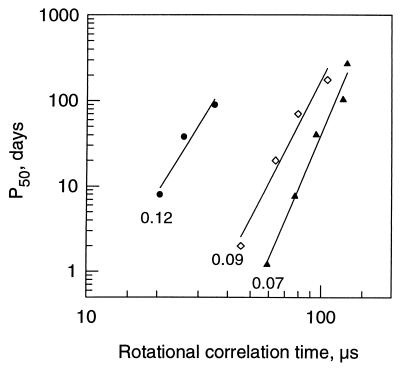
In addition to the established relationship between rotational motion and aging rates for pea seeds, we also investigated this relationship in pollen. In this case, half-viability times (P50, time until 50% germination is reached) were used as an estimate of viability loss. The advantage of studying the storage behavior of pollen is that true reductions in loss of viability can be obtained within a realistic time scale over a wide temperature range. Analogous linear relationships were found when the logarithm of the half-viability times of Typha pollen was plotted against the logarithm of τR at three different mcs (Fig. 3). An increased rotational motion corresponded to decreased half-viability times (Fig. 3). Also, linear regressions were obtained (data not shown) when rotational motion was plotted vs. the aging rates of the pollen (derived from ref. 12).
Figure 3.
Relationship between half-viability time (P50) and τR for Typha pollen. Half-viability times were determined under conditions of different temperatures (5, 15, 25, 35, and 45°C) and various mcs (indicated values in g/g). Data were plotted on a double logarithmic scale {log y = a + b log x}. Mcs, constants, and correlation coefficients of the linear regressions are: ●, 0.12 g/g (a = −4.80, b = 4.41, r2 = 0.943); ◊, 0.09 g/g (a = −8.39, b = 5.31, r2 = 0.971); and ▴, 0.07 g/g (a = −11.32, b = 6.47, r2=0.980). Half-viability times were obtained by interpolation of previously determined data (12).
Mc-Dependent Changes in Aging Rates Are Related to Rotational Motion.
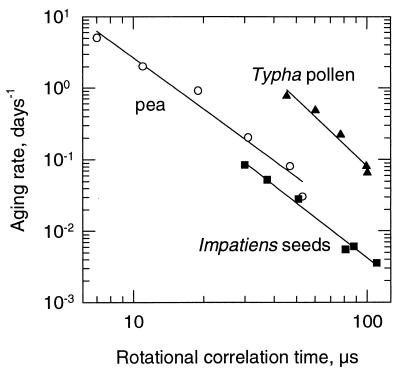
Apart from changing aging rates by varying temperature at constant mc, one can also change aging rates by varying mc at a constant temperature. Thus, the relationship between moisture-dependent changes in aging rate and rotational motion was determined for pea seeds aged at 65°C (3), Impatiens seeds aged at 25°C, and Typha pollen aged at 35°C (12). For all species, the aging rates represented the loss of germination capacity plotted on a probability scale over time (3, 12). A significant linear relationship was obtained between the logarithm of the aging rate and τR for these species when the mc was varied from 0.04 to 0.16 g/g (Fig. 4).
Figure 4.
Relationship between aging rate and τR for Impatiens seeds (■), pea seeds (○) and Typha pollen (▴). Aging rates were determined under conditions of different mcs and one constant temperature (pea seeds, 65°C; Typha pollen, 35°C; Impatiens seeds, 25°C). Aging rates from Typha pollen were taken from ref. 12, and those of pea seeds from ref. 3. Aging rates for all species represent the absolute value of the slope of the linear regression fitted to percentage germination plotted on a probability scale over storage time. Data were plotted on a double logarithmic scale {log y = a + b log x}. Equation constants and correlation coefficients of the linear regressions are: pea seeds, a = 2.82, b = −2.40, r2 = 0.972; Typha pollen, a = 5.16, b = −3.13, r2 = 0.965; and Impatiens seeds, a = 2.73, b = −2.56, r2 = 0.987.
Estimated Longevity from Viability Equation Correlates With Rotational Motion.
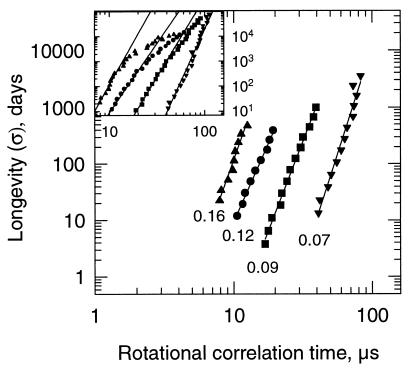
To test the general validity of the linear relationship between aging rate and rotational motion (Figs. 2–4), we estimated the longevity using the viability equation from Ellis and Roberts (1) that has been demonstrated to adequately describe longevity of seeds and pollen (2–8). The loss of viability over time can be described by the equation: log σ = KE − CWlog m − CHt − CQt2, where σ (in days) is the standard deviation of the distribution of deaths in time; KE, CW, CH, and CQ are experimentally determined constants that are specific for each species; t is temperature; and m is mc (1). The viability constants for most species with mcs below 17% (fresh weight basis) that have been published so far have been experimentally determined from storage data between 40 and 90°C. In this study, the viability constants for pea seeds were obtained from ref. 3 and used to calculate the σ for a range of temperatures (t) at four different mcs (m) at which the respective τR values of pea axes were also obtained (0.16, 0.12, 0.09, and 0.07 g/g). The σ was calculated for every 2.5°C between 35 and 65°C. For mcs of 0.12 and 0.16 g/g, the highest temperature for which σ was calculated was 55 and 45°C, respectively, because τR in pea axes at these high mcs could not be determined at higher temperatures because of partitioning of the spin probe into the lipid phase (24, 27). The relationship between the logarithms of σ and rotational motion of CP in the cytoplasm of pea axes was linear (Fig. 5). This indicates that the estimated viability data for pea seeds, derived from the viability equation, show a similar linear relationship with rotational motion, as did the actual data on vigor loss of pea (Figs. 5 and 2).
Figure 5.
Relationship between the longevity (σ) of pea seeds and τR of pea axes. The σ was calculated for every 2.5°C at different mcs by using the viability equation (1), with experimental constants obtained from ref. 3. Data were plotted on a double logarithmic scale. Mcs and temperature range for which σ was determined, together with constants and correlation coefficients are, respectively: ▴, 0.16 g/g, 25 to 45°C (a = −4.73, b = 6.79, r2 = 0.964); ●, 0.12 g/g, 35 to 55°C (a = −4.58, b = 5.546, r2 = 0.992); ■, 0.09 g/g, 35 to 65°C (a = −7.14, b = 6.355, r2 = 0.994); and ▾, 0.07 g/g, 35 to 65°C (a = −11.2, b = 7.64; r2 = 0.966).
When the σ values were calculated for temperatures below 25°C, the relationship between σ and τR deviated from a straight line (Fig. 5 Inset). It is noteworthy that the range of temperatures for which the viability equation has been proven to be valid is the range for which σ was found to linearly correlate with rotational motion (Fig. 5).
Predictions of Life Span Using Cytoplasmic Molecular Motion of Life Span Using Cytoplasmic Molecular Motion.
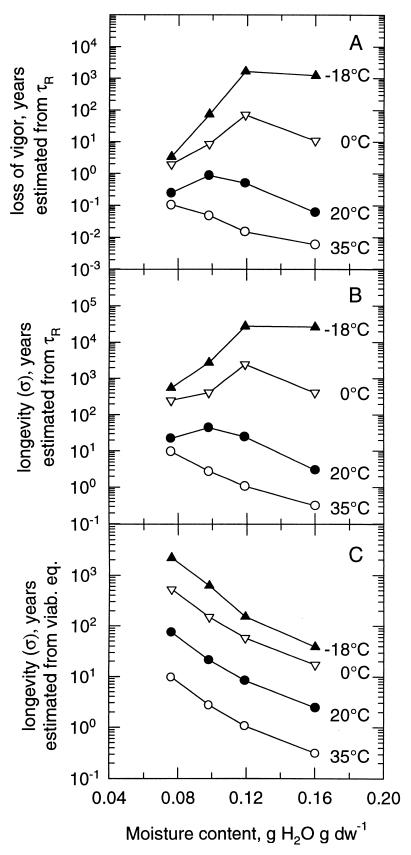
Predictions of life span are necessary to adequately preserve genetic resources. The established linear relationship between the logarithms of rotational motion and aging rate enabled us to extrapolate aging rates or longevity (σ) to subzero temperatures by simply measuring the τRs, assuming that the relationship between aging rate and rotational motion remains linear. In this way, we estimated the loss of vigor (Fig. 6A; extrapolated from the linear regressions in Fig. 2) or the longevity (σ) (Fig. 6B; extrapolated from the linear regressions in Fig. 5) of pea seeds stored at different mcs at 35, 20, 0, and −18°C. The longevity at these temperatures was also calculated by using the viability equation (Fig. 6C).
Figure 6.
Relationship between rate of vigor loss or longevity of pea seeds and mc determined for different temperatures. (A) Estimation of the loss of vigor, extrapolated from Fig. 2. (B) Estimation of the longevity (σ), extrapolated from the linear regressions in Fig. 5. (C) Estimation of the longevity (σ) calculated using the viability equation (1, 3).
The loss of vigor (1/aging rate; expressed as hypocotyl length day−1) was estimated by extrapolating the linear regressions in Fig. 2 for the different mcs (Fig. 6A). At 35°C, the time to vigor loss increased with decreasing mc (Fig. 6A). At 20°C, a lowering of the mc from 0.16 to 0.09 g/g increased the time to vigor loss. A further decrease of the mc resulted in a subsequent decrease in time to vigor loss. At 0°C, optimum storage behavior was found at 0.12 g/g. Estimation of the rate of vigor loss at −18°C showed an optimum storage behavior of 1,660 yr at 0.12 g/g. Storage of seeds at −18°C and 0.16 g/g reduced the time to loss of vigor to 1,224 yr. However, decreasing the mc to 0.09 or 0.07 g/g also decreased the time to vigor loss to 74 and 7 yr, respectively.
Similarly, when the longevity data (σ, calculated from the viability equation) were estimated at the same temperatures (Fig. 6B) by extrapolation of the linear regressions in Fig. 5, the effect of mc on longevity was analogous to that on vigor loss (compare Fig. 6 A with B). To validate the predictions, and to demonstrate that the predictions of vigor loss are comparable to loss of percentage germination, we plotted the linear regression of Fig. 2 against the linear regression of Fig. 5 for each mc. For all mcs, the regression coefficients of the relation between longevity and vigor loss were close to unity: −0.97 for 0.07 g/g, −1.00 for 0.09 g/g, −1.10 for 0.12 g/g, and −1.00 for 0.16 g/g. At 20°C, the optimum longevity was found around 0.09 g/g, while at 0°C, it was estimated to occur around 0.12 g/g. At these optimum mcs, longevity was estimated to be 44 and 2,466 yr when the tissues would be stored at 20 and 0°C, respectively. At −18°C, estimated longevity was found to decrease when seeds were stored below a mc of 0.12 g/g (Fig. 6B). In contrast, the calculations of longevity estimated from the viability equation showed a different effect of mc on longevity. At all temperatures, the calculated longevity increased with decreasing mcs (Fig. 6C). Unfortunately, no longevity predictions were possible for Typha pollen at subzero temperatures because of sensitivity limits of ST-EPR measurements in these samples.
Discussion
Our data show that the rotational mobility of the spin probe in the cytoplasm can adequately describe the aging rates of germplasm over a wide range of temperatures and mcs. Therefore, it seems plausible that the molecular mobility is influencing the vigor and life span of germplasm. Many studies on aging and glasses have suggested that molecular mobility will influence aging rates of seed and pollen (11, 12, 18–21, 24), or given evidence that certain detrimental reactions change in kinetics around Tg (20, 21). However, to our knowledge, this is the first experimental evidence that cytoplasmic molecular mobility in germplasm, measured by ST-EPR, is directly associated with aging rate. Despite the often-reported damage on membranes that seems to be associated with the aging of seeds and pollen (34–36), the determining factor in aging appears to be associated with the molecular mobility in the cytoplasmic surroundings. Alternatively, the viscous cytoplasm might be responsible for restricting motion of membrane components, thereby slowing down deleterious reactions taking place in membranes (37).
It is known that the formation of the glassy state changes the activation energy of reactions (23, 38, 39). It has been shown that formation of intracellular glasses in pollen also results in a change of the activation energy of aging reactions (12). Similarly, the activation energy of the rotational motion in seeds was found to change around Tg (27). Fig. 1 shows that there is a change in the kinetics of both aging rate and molecular mobility in dependence of temperature, apparent from the deviation in Arrhenius behavior. Nonetheless, we found a linear relationship when both parameters are plotted against each other on a logarithmic scale. Therefore, using the molecular mobility of molecules in the cytoplasm to describe aging rates takes into account the formation of the glassy state and the concomitant change in kinetics.
The observation that the relationship between the logarithms of rotational motion and longevity of germplasm is linear enabled extrapolations to other storage conditions. Predictions of life span are especially necessary at low temperatures, since under these storage conditions, longevities cannot practically be determined. It is these low temperatures that are chosen for seed storage protocols, because ultra-dry storage cannot achieve the necessary longevity needed by genebank conservers (40). The estimated longevity for pea seeds at 20°C ranged between 3 and 50 yr, depending on the mc, while the estimated longevity at 0°C ranged from 250 to 2,466 yr (Fig. 6B). It is not surprising to find these values for the predictions, because there are several reports showing that seeds can survive for over a hundred years (41–43) at ambient temperatures. The most remarkable discovery was that on ancient seeds of Sacred Lotus from China, where radiocarbon dating showed an age of the seed of 1,288 ± 271 yr while it was still capable of germinating (44).
Predictions of longevity at 20, 0, and −18°C on the basis of molecular mobility in the cytoplasm showed that drying below an optimum mc resulted in decreased vigor and longevity (Fig. 6 A and B). In general, viability constants for most seed species containing less than 17% water on a fresh weight basis have been determined by using experimental storage temperatures between 40 and 90°C. In the case of pea seeds, the viability constants were determined at 65°C (3). Therefore, it can be assumed that the calculations of the estimated longevity between 35 and 65°C for pea seeds as shown in Fig. 5 (filled symbols) are most likely accurate. The finding that the regression coefficients of the relation between the linear regressions of vigor loss (Fig. 2) and longevity (Fig. 5) were close to unity, and the observation that measurements of vigor loss and longevity, based on germination percentage, gave comparable viability predictions (Fig. 6 A and B), suggests that both types of measurements can be applied to obtain estimates of viability under different storage conditions.
The prediction that longevity decreases when seeds are dried below the optimum mc is in marked contrast with the concept that seeds with a low mc survive longer than seeds with an elevated mc (1, 2, 34). Our predictions on the basis of molecular mobility support the contention of the existence of an optimum mc for storage that shifts to higher values with decreasing storage temperatures (9, 10, 12). Currently, seed storage protocols recommend storage at 5% moisture and −18°C (40). Fig. 6 suggests that longevity at −18°C could be increased considerably by storing seeds at an mc higher than 7%. The consequences for germplasm preservation, therefore, are that when subzero temperatures for storage are considered, germplasm should preferably not be dried to too low mcs.
The observation that aging rates change by an order of four, whereas the τR changes less than one order of magnitude over the same temperature range (Fig. 2) raises the question of how rotational motion is linked with aging rates. The rotational motion of a spin probe and aging reactions are two processes occurring at a different molecular level. The rotational correlation time of the spin probe in its environment is determined by the size of the probe (45). It was found that the temperature dependence of rotation increased with increasing size of the probe, which could be interpreted as a qualitative indication that larger probes are more coupled to the macroscopic viscosity of the matrix than smaller ones (45). Additionally, the size of the molecules responsible for detrimental reactions will determine the difference in temperature dependence between rotational motion and aging rate. Nonetheless, rotational motion of CP was found to correlate with aging, indicating that rotational motion can be used to describe reaction rates leading to loss of viability.
Acknowledgments
This work was supported by the Netherlands Technology Foundation (STW) and was coordinated by the Life Sciences Foundation.
Abbreviations
- mc(s)
moisture content(s)
- CP
3-carboxy-2,2,5,5-tetramethylpyrrolidine-1-oxyl
- g/g
g H2O g dw−1
- ST-EPR
saturation transfer electron paramagnetic resonance
- τR
rotational correlation time
- Tg
glass-to-liquid transition temperature
Footnotes
Article published online before print: Proc. Natl. Acad. Sci. USA, 10.1073/pnas.040554797.
Article and publication date are at www.pnas.org/cgi/doi/10.1073/pnas.040554797
References
- 1.Ellis R H, Roberts E H. Ann Bot (London) 1980;45:13–30. [Google Scholar]
- 2.Ellis R H, Roberts E H. Ann Bot (London) 1980;45:31–37. [Google Scholar]
- 3.Ellis R H, Hong T D, Roberts E H. Ann Bot (London) 1989;63:601–611. [Google Scholar]
- 4.Kraak H L, Vos J. Ann Bot (London) 1987;59:353–359. [Google Scholar]
- 5.Dickie J B, Ellis R H, Kraak H L, Ryders K, Tompsett P B. Ann Bot (London) 1990;65:197–204. [Google Scholar]
- 6.Mwasha A J, Ellis R H, Hong T D. Seed Sci Technol. 1997;25:115–122. [Google Scholar]
- 7.Hong T D, Ellis R H, Buitink J, Walters C, Hoekstra F A, Crane J. Ann Bot (London) 1999;83:167–173. [Google Scholar]
- 8.Usberti R, Gomes R B R. Ann Bot (London) 1998;82:691–694. [Google Scholar]
- 9.Vertucci C W, Roos E E. Seed Sci Res. 1993;3:201–213. [Google Scholar]
- 10.Vertucci C W, Roos E E, Crane J. Ann Bot (London) 1994;74:531–540. [Google Scholar]
- 11.Vertucci C W, Roos E E. Plant Physiol. 1990;94:1019–1023. doi: 10.1104/pp.94.3.1019. [DOI] [PMC free article] [PubMed] [Google Scholar]
- 12.Buitink J, Walters C, Hoekstra F A, Crane J. Physiol Plant. 1998;103:145–153. [Google Scholar]
- 13.Walters C, Engels J. Seed Sci Res. 1998;8:3–8. [Google Scholar]
- 14.Ellis R H, Hong T D, Roberts E H. Ann Bot (London) 1995;76:521–534. [Google Scholar]
- 15.Franks F. BioTechniques. 1994;12:253–255. [Google Scholar]
- 16.Williams R J, Leopold A C. Plant Physiol. 1989;89:977–981. doi: 10.1104/pp.89.3.977. [DOI] [PMC free article] [PubMed] [Google Scholar]
- 17.Bruni F, Leopold A C. Biophys J. 1992;63:663–672. doi: 10.1016/S0006-3495(92)81638-7. [DOI] [PMC free article] [PubMed] [Google Scholar]
- 18.Leopold A C, Sun W Q, Bernal-Lugo I. Seed Sci Res. 1994;4:267–274. [Google Scholar]
- 19.Sun W Q, Leopold A C. Physiol Plant. 1993;89:767–774. [Google Scholar]
- 20.Sun W Q, Leopold A C. Physiol Plant. 1995;94:94–104. [Google Scholar]
- 21.Sun W Q, Leopold A C. Comp Biochem Physiol. 1997;117:327–333. [Google Scholar]
- 22.Hancock B C, Shamblin S L, Zografi G. Pharm Res. 1995;12:799–806. doi: 10.1023/a:1016292416526. [DOI] [PubMed] [Google Scholar]
- 23.Roos Y. Phase Transitions in Foods. London: Academic; 1995. [Google Scholar]
- 24.Buitink J, Claessens M M A E, Hemminga M A, Hoekstra F A. Plant Physiol. 1998;118:531–541. doi: 10.1104/pp.118.2.531. [DOI] [PMC free article] [PubMed] [Google Scholar]
- 25.Knowles P F, Marsh D, Rattle H W E. Magnetic Resonance of Biomolecules: An Introduction to the Theory and Practice of NMR and ESR in Biological Systems. London: Wiley; 1976. [Google Scholar]
- 26.Hemminga M A. Chem Phys Lipids. 1983;32:323–383. [Google Scholar]
- 27.Buitink J, Hemminga M A, Hoekstra F A. Biophys J. 1999;76:3315–3322. doi: 10.1016/S0006-3495(99)77484-9. [DOI] [PMC free article] [PubMed] [Google Scholar]
- 28.Franks F. Trends Biotechnol. 1994;12:114–117. doi: 10.1016/0167-7799(94)90087-6. [DOI] [PubMed] [Google Scholar]
- 29.Golovina E A, Tikhonov A N, Hoekstra F A. Plant Physiol. 1997;114:383–389. doi: 10.1104/pp.114.1.383. [DOI] [PMC free article] [PubMed] [Google Scholar]
- 30.Winston P W, Bates D H. Ecology. 1960;41:232–236. [Google Scholar]
- 31.Thomas D D, Dalton L R, Hyde J S. J Chem Phys. 1976;65:3006–3024. [Google Scholar]
- 32.Van den Dries I J, de Jager P A, Hemminga M A. J Magn Reson. 1998;131:241–247. doi: 10.1006/jmre.1997.1354. [DOI] [PubMed] [Google Scholar]
- 33.Marsh D. Biochemistry. 1980;19:1632–1637. doi: 10.1021/bi00549a017. [DOI] [PubMed] [Google Scholar]
- 34.Priestley D A. Seed Aging: Implications for Seed Storage and Persistence in Soil. Ithaca, NY: Comstock; 1986. [Google Scholar]
- 35.Wilson D O, Jr, McDonald M B., Jr Seed Sci Technol. 1986;14:269–300. [Google Scholar]
- 36.Van Bilsen D G J L, Hoekstra F A. Plant Physiol. 1993;101:675–682. doi: 10.1104/pp.101.2.675. [DOI] [PMC free article] [PubMed] [Google Scholar]
- 37.Lee C W B, Waugh J S, Griffin R G. Biochemistry. 1986;25:3737–3742. doi: 10.1021/bi00361a001. [DOI] [PubMed] [Google Scholar]
- 38.Karmas R, Buera M P, Karel M. J Agric Food Chem. 1992;40:873–879. [Google Scholar]
- 39.Sun W Q, Leopold C A, Crowe L M, Crowe J H. Biophys J. 1996;70:1769–1776. doi: 10.1016/S0006-3495(96)79740-0. [DOI] [PMC free article] [PubMed] [Google Scholar]
- 40.Ellis R H, Roberts E H. Nature (London) 1998;395:758. [Google Scholar]
- 41.Kivilaan A, Bandurski R S. Am J Bot. 1981;68:1290–1292. [Google Scholar]
- 42.Bewley J D, Black M. Physiology and Biochemistry of Seeds. Vol. 2. New York: Springer; 1982. [Google Scholar]
- 43.Steiner A M, Ruckenbauer P. Seed Sci Res. 1995;5:195–199. [Google Scholar]
- 44.Shen-Miller J, Mudgett M B, Schopf J W, Clarke S, Berger R. Am J Bot. 1995;82:1367–1380. [Google Scholar]
- 45.Deppe D D, Dhinojwala A, Torkelson J M. Macromolecules. 1996;29:3898–3908. [Google Scholar]


