Abstract
The practice of immunoassay has experienced a widespread transition from radioisotopic labeling to nonisotopic labeling over the last two decades. Radioisotope labels have drawbacks that hamper their applications: (i) perceived radiation hazards of reagents, (ii) regulatory requirements and disposal problems of working with radioactive materials, and (iii) short shelf-life of the labeled reagents. The advantage of isotopic labeling is the incorporation into analytes without altering structure or reactivity, as is often the case with ELISA or fluorescent detection systems. We developed a format for isotope label immunoassay with the long-life isotope 14C as the label and accelerator mass spectrometer (AMS) as the detection system. AMS quantifies attomole levels of several isotopes, including 14C. With this exquisite sensitivity, the sensitivity of an immunoassay is limited by the Kd of the antibody and not the detection system. The detection limit of the assays for atrazine and 2,3,7,8-tetrachlorodibenzo-p-dioxin was 2.0 × 10⁻¹⁰ M and 2.0 × 10⁻¹¹ M, respectively, approximately an order of magnitude below the standard enzyme immunoassay. Notably, <1 dpm (0.45 pCi) of 14C-labeled compound was used in each assay, which is well below the limit of disposal (50 nCi per g) as nonradioactive waste. Thus, endogenous reporter ligands quantified by AMS provide the advantages of an RIA without the associated problems of radioactive waste.
Immunoassay is an important bioanalytical technique with a significant scope of applications. The specificity of the immunoassay derives from the antibody–antigen interaction, whereas a choice of molecular labels contributes to the high sensitivity of this technique. The early stage of immunoassay development in biological research and clinical diagnostics exclusively used radioisotope labels (1). Conventional radioisotope detection methods, such as liquid scintillation counting (LSC) and autoradiography, use the radiation generated in the isotope-decay process. The sensitivity of the detection correlates to the rate of decay, or inversely to the half-life of the radioisotope. Although short-life isotopes, such as 32P (half-life, 14.3 days) and 125I (half-life, 60 days), can be detected at attomole levels by LSC, these high-energy isotopes pose safety concerns in the laboratory environment. Furthermore, the short half-life of the radioisotopes translates into short shelf life for the labeled reagents. These isotopes are attached to molecules by using specific chemistries that may modify molecular behavior and are not universally applicable to many compounds, such as small organic ligands. 14C and 3H are incorporated seamlessly into organics, but have decay detection limits at >10 dpm (75 and 0.15 fmol, respectively). These limitations of radioisotopes prompted the development of other labeling systems and detection methods for biological studies. Enzyme immunoassay was first introduced in 1971 (2) and promoted the general acceptance of immunoassay as an important analytical tool in areas such as environmental monitoring and food analysis.
Accelerator mass spectrometry (AMS) developed in the late 1970s as a form of isotope ratio MS for tracing long-life radioisotopes for chronometry in the earth sciences and archaeology (3). AMS directly counts low-abundance (10−15 < isotope/element < 10−9) isotopes individually emitted from the sample and is independent of their decay rate (3, 4). Over the past decade, AMS quantification of 3H and 14C was applied to the life sciences in a variety of disciplines: molecular carcinogenesis (5), environmental toxicology (6), chemical synergy (7), human–rodent scaling (8), dermal absorption of agrochemicals (9), molecular nutrition (10), metabolic profiling (11), and cellular lifetimes (12). 14C (half-life: 5,370 yr) is detected at attomole (10−18 mole, amol) levels by AMS. At this level, the radiation generated by 14C is negligible (1 amol of 14C undergoes one disintegration in approximately 5 days), and it is essentially treated as a stable isotopic label. AMS detection is a promising alternative to the traditional LSC methods for long-life isotopes, such as 14C, in biological research.
We investigated the high sensitivity of 14C-AMS for immunoassays that have the simplicity of RIA but avoid the complications of radioactivity above ambient levels. As a demonstration of this concept, we developed homogenous assays for the pesticide atrazine and for 2,3,7,8-tetrachlorodibenzo-p-dioxin (TCDD). Atrazine is one of the most heavily used herbicides in the United States and is among the most commonly detected pesticides in water (13). Dioxins are ubiquitous in the environment, and congeners such as TCDD are highly toxic and carcinogenic (14, 15). Monitoring these toxins requires extensive sample preparation (TCDD) and very low levels of detection (ppt or even ppq). Our laboratory has developed enzyme immunoassays for monitoring these chemicals in environmental and human samples in recent years (16–19). Although some excellent antibodies and assays have been generated, the detection limits still could not satisfy certain needs, such as screening biological and environmental samples. Isotope-labeled immunoassay will allow us to pursue ultrasensitive assays and to obtain a better understanding of antibody properties. We present the feasibility and potential advantages of by using AMS as the detection method in immunoassays.
Materials and Methods
Materials.
Magnetic particles coated with goat anti-rabbit IgG and goat anti-mouse IgG (1 mg/ml) were purchased from Polysciences. Atrazine was provided by CIBA–Geigy. The monoclonal anti-atrazine antibody (AM7B.2) was from A. E. Karu (University of California, Berkeley). Polyclonal anti-TCDD antibody 7598 was generated in this laboratory (18). Horseradish peroxidase (HRP) (EIA grade) was from Roche Molecular Biochemicals. Tributyrin was purchased from ICN. 14C-TCDD (122 mCi/mmol) was purchased from Cambridge Isotope Laboratories (Andover, MA). 2,3,7-Trichloro-8-methyldibenzo-p-dioxin (TMDD) was synthesized in this laboratory (18). 14C-labeled atrazine (17.7 mCi/mmol), 3,3′,5,5′-tetramethylbenzidine, 1,3-dicyclohexylcarbodiimide, N-hydroxysuccinimide, and all other chemicals were obtained from Sigma. Scintillation counting was conducted with a Wallac 1409 liquid scintillation counter (Gaithersburg, MD).
AMS Sample Preparation and Measurement.
A fixed quantity of resuspended magnetic particles in methanol was mixed with 1.19 mg of carrier carbon (tributyrin containing 8.8 amol 14C/mg C) and converted to graphite for AMS analysis (20). AMS measurements were performed at the Lawrence Livermore National Laboratory. Measurement times were typically 3 min/sample, with a counting precision of <2% and SD from 3–7 measurements of <3%. The isotope ratios of the unknowns were normalized to measured ratios of four identically prepared standards of known isotope concentration.
Binding Tests.
The 14C-TCDD solution was prepared in PBS (8 g/liter NaCl/1.15 g/liter Na2HPO4/0.2 g/liter KCl/distilled water) containing 50% DMSO. Antibody solutions were diluted in PBSB (PBS containing 0.2% of BSA). Crude Ab 7598 was used in this study for TCDD assay; its IgG concentration was measured by using an Easy-Titer Rabbit IgG Assay Kit from Pierce. Optimal concentrations of antibodies and 14C labels for AMS measurement were determined with 50 μl of 14C-TCDD (1.5 fmol) and 50 μl of different dilutions of Ab 7598 (2 fmol to 50 pmol of IgG) mixed in 12 × 75-mm borosilicate glass test tubes and incubated for 15 min. Then, 100 μl of magnetic particles coated with goat anti-rabbit IgG was added and incubated for 30 min with shaking. The incubation times used in this study were chosen based on the time-course experiments for both antibody–antigen reaction and antibody–particle binding (data not shown). The particles were separated from the solution by placing the tubes on a magnetic separator. The particles were washed three times with PBS containing 25% DMSO and suspended in methanol. The 14C labels bound to the particles were measured by AMS as described above.
A similar procedure was used for atrazine. 14C-atrazine was prepared in PBS, and the antibody was diluted in PBSB. A 50-μl aliquot of 14C-atrazine (10.2 fmol) and 50 μl of AM7B.2 (10 fmol to 50 pmol) were used for an atrazine experiment. After incubation, a 100-μl aliquot of magnetic particles coated with goat anti-mouse IgG was added for trapping primary antibodies. The particles were separated and then washed three times with PBS and resuspended into 100 μl of methanol.
To measure the antibody affinity constant (Ka), 50 μl of antibody (1.0 pmol Ab7598 or 2.0 pmol AM7B.2) in PBSB was mixed with 50 μl of different dilutions of 14C-TCDD (1–200 fmol of IgG in 50% DMSO-PBS) or atrazine (2–500 fmol in PBS) in test tubes, and incubated for 15 min. A 200-μl aliquot of magnetic particles then was added and incubated for 30 min with shaking. After separation and washing steps, 14C content bound onto the particles was determined with AMS as described above.
AMS Immunoassay.
A series of atrazine standard solutions (from 10−4 M to 10−14 M) were prepared in PBS by serial dilution. Standards of TMDD, a TCDD surrogate, were prepared in PBS containing 50% of DMSO. Antibodies AM7B.2 (for detecting atrazine) and 7598 (for detecting TCDD) were diluted in PBS containing 0.2% of BSA. A 50-μl aliquot of each analyte standard, the 14C-labeled atrazine (10.2 fmol, 0.53 dpm) or TCDD (1.5 fmol, 0.53 dpm), and antibodies (1,000 fmol of AM7B.2 or 500 fmol of Ab7598) were added sequentially to individual 12 × 75-mm glass test tubes. After mixing, the tubes were incubated at room temperature for 15 min. A 100-μl aliquot of magnetic particles was added to each tube and incubated for 30 min with gentle shaking. After separation and washing steps, bound 14C content on particles was measured by using AMS as described above.
Hapten-HRP Conjugates.
A total of 1.8 mg of hapten was dissolved into 260 μl of dimethylformamide, and followed by adding 3.4 mg of N-hydroxysuccinimide and 12.4 mg of 1,3-dicyclohexylcarbodiimide. The solution was stirred for 2.5 h at room temperature. After centrifugation, the supernatant was added dropwise to a volume of 6.0 ml of HRP solution in 0.13 M NaHCO3 buffer (pH 9.0) (0.66 mg HRP/ml buffer). The mixture was stirred for 16 h at 4°C, and then dialyzed against 1.0 liter of 0.13 M NaHCO3 (pH 9.0). The buffer was changed twice with 12-h dialysis each time. Finally, the contents of the dialysis bag were adjusted to a total volume of 8.0 ml with NaHCO3 buffer.
Enzyme Immunoassay for Atrazine.
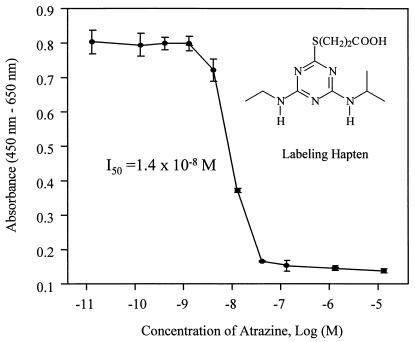
A volume of 50 μl each atrazine standard solution (in PBS), hapten-HRP conjugate solution (1,000× in PBS), and antibody (5 pmol AM7B.2 in PBSB) was sequentially added in a 12 × 75-mm glass test tube. The mixture was incubated at room temperature for 15 min, followed by addition of 200 μl magnetic particles and incubation for 30 min with shaking. Then, the tubes were placed on a magnetic separator to separate the particles from the solution phase. The supernatant was removed from the tube with a Pasteur pipette, and the particles were washed twice with 300 μl of PBS. Tetramethylbenzidine (TMB) substrate solution [250 μl/tube; 3.3 μl of 30% H2O2, 400 μl of 0.6% TMB in DMSO per 25 ml of acetate buffer (pH 5.5)] was added and incubated at room temperature for 10–20 min with shaking. Then, 100 μl of the reaction solution was transferred to a microtiter plate and mixed with 50 μl of 2 M H2SO4 to stop the enzymatic reaction. The absorbance at 450 nm was measured by using the absorbance at 650 nm as the background with a Vmax microplate reader (Molecular Devices). Dose-response curves were constructed by plotting the absorbance vs. the log value of the atrazine standard concentration.
Safety Considerations.
Although only a very small amount of TCDD was used in these assays (1.5 fmol or 483 fg of TCDD in each assay), extreme caution is necessary because of the toxicity of this compound. When TCDD and related compounds are handled, two pairs of protective gloves with some water between the layers, laboratory coat, and a pair of safety glasses are recommended (19).
Results and Discussion
AMS Measurement.
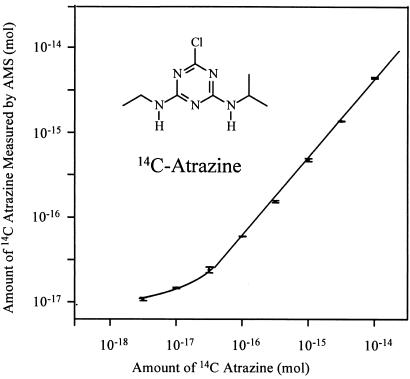
Fig. 1 shows the calibration curve of 14C-AMS for serial dilutions of the stock solution over the range from 10−17 mole to 10−14 mole atrazine. AMS is linear over 3 orders of magnitude as depicted here, and its limit of quantitation (LOQ = 3× SD of control background) is 12 amol of 14C-atrazine. These properties reduce the need to scale the assays to the dynamic range of the detection system, as is common with ELISA. AMS produces an isotope ratio applicable to the entire mg-sized sample. Absolute quantitation of the 14C in the sample requires an accurate knowledge of the sample's total carbon and its source (9). The magnetic particles that trap the antibodies after reaction with analyte in solution were included as part of the AMS sample. Nonspecific binding of the 14C-labeled analyte to the magnetic beads was a limiting factor in these assays. The carbon content of the beads was quantified and accounted for with a set of controls. The following equations were used to calculate the 14C-atrazine bound to beads from the measurement of the isotope ratio of the Rs.
 |
1 |
 |
 |
2 |
Ro is the 14C isotope ratio measured in a control sample that contains only the particles and carrier. The magnetic particles are iron oxide crystal coated with a monolayer of silicone polymer and conjugated with goat antibodies. The carbon content of the particles measured by elemental analysis was 10% (provided by manufacturer). Less than 100 μg of the particles was used in each assay, and the contribution of the particles to the total carbon content in each AMS measurement (close to 1,000 μg carbon) was about 1.0%. The 14C content in this amount of particles does not significantly increase the background of 14C for the purpose of AMS measurement.
Figure 1.
Calibration of 14C-atrazine dilution series by AMS. The specific radioactivity of the 14C atrazine is 17.7 mCi/mmol. This corresponds to 0.283 mol of 14C per mol of atrazine. Error bars represent SD of three replicates measured multiple times.
Binding Test and Affinity Constant.
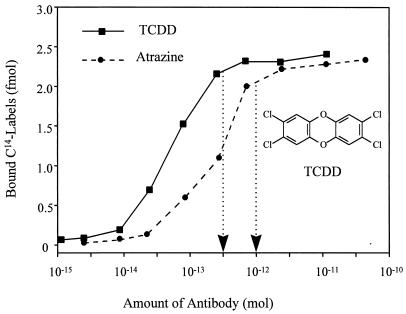
The optimal concentration of antibody and antigen (14C) was determined by a series of binding tests. The best range of isotope ratios for AMS measurement is between 0.01 and 10 fmol 14C per mg carbon. Considering possible nonspecific binding and other interference, 3.0 fmol 14C label was chosen for each assay as a fixed concentration in this study. The amount of bound 14C-labeled TCDD and atrazine at different concentrations of antibodies is shown in Fig. 2. The lowest antibody concentration that binds a sufficient amount of 14C label was selected as the optimal concentration. Therefore, 1.0 pmol of AM7B.2 and 500 fmol of Ab 7598 were used for atrazine and TCDD immunoassay, respectively.
Figure 2.
Bound 14C labels at varied concentrations of antibodies. A total of 10.2 fmol (0.53 dpm) of 14C-atrazine (about 3 fmol 14C) and purified mAb (10 fmol-50 pmol) was used in each tube for atrazine experiment. A total of 1.5 fmol (0.53 dpm) of 14C-TCDD (about 3 fmol 14C) and polyclonal antibody 7598 (2 fmol-50 pmol) was used in each tube for TCDD experiment. The arrows indicate the amount of antibodies chosen in this study.
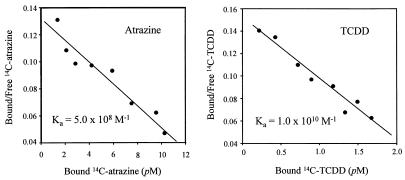
The sensitivity of an assay primarily depends on the binding affinity of antibody used (21). Knowing the affinity constant (Ka) of an antibody is significant for characterization of antibody properties, which is particularly important for antibody engineering, and aids in assay development. The Scatchard model (22) is the most widely used mathematical approach to calculate the affinity constant (Ka), in which the distribution of the analyte between the bound and free forms in an equilibrium solution must be determined. For the small molecule analyte, a tracer generally is used for measuring the bound and free analyte. Although widely used as tracers, external labels, such as enzyme or fluorescent probes, modify the analyte structurally and thus introduce handle recognition and have stereo-impact on antibody–antigen reaction. Therefore, these Kas are only approximations of the true antibody affinity constant (23). AMS allows us to use an intrinsic reporter (14C label in analyte molecule) and measure the true Ka of an antibody. According to the Scatchard plot (Fig. 3), the affinity constants of AM7B.2 (against atrazine) and Ab7598 (against TCDD) were 5.0 × 10⁸ M−1 and 1.0 × 10¹⁰ M−1, respectively. Because AM7B.2 is a mAb, this is a true Ka, whereas the Ka for the polyclonal Ab 7598 is an average for the pool. The x-intercept in Fig. 3 is an estimate of the concentration of available binding sites under these assay conditions. This value is useful in designing further assays to make optimal use of AMS sensitivity and in determining the stability of the binding regions.
Figure 3.
Scatchard plots for atrazine and TCDD antibodies. The affinity constant (Ka) for atrazine antibody (mAb) and TCDD antibody (Ab 7598) was calculated according to the Scatchard plot above. A fixed concentration of antibody and varied concentration of 14C-labeled analytes were used for this experiment. The slopes provide the affinity constants shown.
AMS Immunoassay.
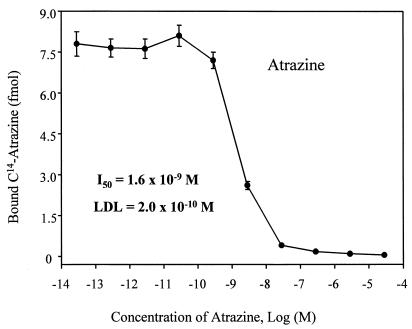
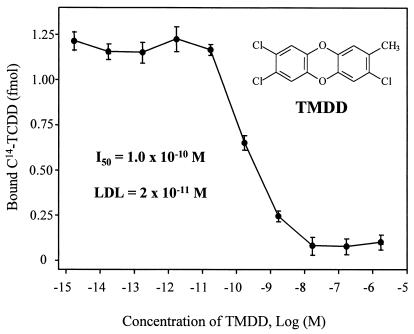
A format with AMS as detection system was developed for both atrazine and TCDD immunoassays. The equilibrium binding of antibody, analyte, and tracer is achieved in solution and is followed by collection of the antibody on an added solid substrate. We used magnetic particles to separate bound analytes from reaction solution, and then directly measured the 14C content on the particles. This could decrease matrix interference and sample pretreatment, which usually are required in nonisotopic labeled immunoassays. The concentration of analyte giving 50% inhibition (I50) for the atrazine immunoassay in this system was 1.6 × 10⁻⁹ M (Fig. 4), which is about 1 order of magnitude more sensitive than the enzyme-labeled format (1.4 × 10⁻⁸ M; Fig. 5). Similarly, the I50 of the TCDD immunoassay (toward TMDD) is 1.0 × 10⁻¹⁰ M (Fig. 6), which is eight times more sensitive than the coating antigen format (0.8 × 10⁻⁹ M; ref. 19). The detection limit is defined as the analyte concentration that gives a response that has a statistically significant difference from the response of zero analyte sample (24). Therefore, the detection limits of the TCDD and atrazine AMS assays were 2.0 × 10⁻¹¹ M and 2.0 × 10⁻¹⁰ M, respectively.
Figure 4.
Atrazine AMS immunoassay dose-response curve. A total of 10.2 fmol (0.53 dpm) of 14C-atrazine and purified mAbs (1.0 pmol) was used in each tube. Atrazine concentrations refer to those in the 50-μl standard solutions. Error bars represent SD of three replicates measured multiple times.
Figure 5.
Atrazine dose-response curves for enzyme immunoassays with HRP labeling. A total of 5 pmol of antibody was incubated with 50 μl of atrazine standard and 50 μl of HRP conjugate in the assay. Atrazine concentrations refer to that in the 50-μl standard solution. Error bars represent SD of three replicates.
Figure 6.
TMDD AMS immunoassay dose-response curve. A total of 1.5 fmol (0.53 dpm) of 14C-TCDD and polyclonal antibody (500 fmol of IgG) was used in each tube. TMDD was used as surrogate to replace highly toxic TCDD. Its concentrations refer to those in the 50-μl standard solutions. Error bars represent SD of three replicates measured multiple times.
Because dioxins are extremely lipophilic, a high percentage of cosolvent (e.g., 50% DMSO) is required to assure TCDD is well distributed in the solution. We did not attempt an enzyme-labeled assay for TCDD because lower absorbance and large uncertainties result from slow turnover of available enzymes in organic solvents (data not shown). A sensitive TCDD assay was achieved by screening antigens containing structurally similar hapten in a coating antigen format. A highly sensitive assay for TMDD with an I50 of 0.8 × 10⁻⁹ M was developed (19). However, more than 20 antigens were synthesized and underwent antibody–antigen screening in the development (18, 19). In this AMS immunoassay format, a more sensitive assay is obtained and no hapten (for antigen) synthesis and labeling is needed.
The ultimate sensitivity of a competitive immunoassay is limited by the affinity constant of antibody, the random experimental error, nonspecific binding, and precision of the detection system (25). Jackson and Ekins (25) estimated that the lowest detection limit possible for a competitive immunoassay would be 10−10 M with Ka = 108 M−1 (or Kd = 10−8 M), a 1% coefficient of variation for the response at zero dose. In this study, the detection limit of atrazine assay is 2.0 × 10⁻¹⁰ M, which is about 10 times lower than the antibody Kd (2.0 × 10⁻⁹ M). For the lipophilic TCDD, higher nonspecific binding (10%) was observed, and its detection limit (2.0 × 10⁻¹¹ M) is about five times lower than the Kd of the antibody (10−10 M). This AMS immunoassay format provides the sensitive assay near the theoretical limit without extensive synthesis, and screening of haptens and antigens to find an optimum combination. Moreover, only 0.53 dpm (0.23 pCi) of 14C content was used in each assay for both atrazine and TCDD, which is thousands of times lower than the amount of radioactivity used in conventional radioimmunoassay (1). It is about 200,000 times less than the regulatory levels of 50 nCi/g, the limit of disposal as nonradioactive waste (26). Therefore, no radiation and radioactive waste problems are associated in this AMS assay.
In conclusion, an isotope-labeled immunoassay was successfully achieved with the AMS detection system. AMS allows detection at attomole levels of isotope 14C, which results in no radiation hazard and radioactive waste. With AMS, the sensitivity of immunoassay is constrained by the affinity constant of the antibody and not the detection system. For an antibody with very high affinity, AMS will support the development of an ultrasensitive assay. On the other hand, knowing a true Ka of an antibody by using AMS would help the understanding of antibody–antigen interaction and antibody properties, and assist antibody design and engineering. In addition, the AMS immunoassay eliminates the need for hapten synthesis and labeling. Usually, when pharmaceutical or agrochemical companies developed a drug or pesticide, long-life 14C-labeled ligands were made and available for the metabolism and other studies. To compare with nonisotopic-labeled immunoassays, this AMS immunoassay also offers many other advantages, including the direct kinetic relationship between the measured signal and the amount of label present, few matrix effects, low nonspecific binding, and straightforward assay optimization. AMS is a new technology in biochemical research that is only available at a limited number of facilities worldwide at this time. Our assay is not suggested as a universally applicable technique, but it demonstrates the values and limits of assays using long-life isotopes as the intrinsic tracer. There may be applications in pharmacology, physiology, and toxicology that require the characteristics of this assay at this time. AMS techniques are now proven in molecular nutrition, the molecular bases of carcinogenesis, mass balance, and linear pharmacokinetics at low doses, dermal transmission of chemicals, cellular lifetimes, and in a number of environmental research projects. The widening application of AMS and the concerted effort to develop smaller and less expensive spectrometers (27–29) will increase the opportunities of using attomole isotope detection in highly sensitive, yet simple, assays.
Acknowledgments
We thank Kurt Haack and Stewart P. H. T. Freeman for assistance in AMS sample preparation and measurement. This work was supported in part by funds from the University of California and the Department of Energy, Lawrence Livermore National Laboratory (UC Presidents Campus Laboratory Collaboration 95–103 and Intra-University Agreement B29 1419, LLNL-UCD), and the National Institute of Environment Health Sciences Superfund Basic Research Program (P42 ES04699). Work carried out at the Lawrence Livermore National Laboratory was supported under Department of Energy Contract W-7405-ENG-48.
Abbreviations
- LSC
liquid scintillation counter
- AMS
accelerator mass spectrometry
- TCDD
2,3,7,8-tetrachlorodibenzo-p-dioxin
- TMDD
2,3,7-trichloro-8-methyldibenzo-p-dioxin
- HRP
horseradish peroxidase
Footnotes
Article published online before print: Proc. Natl. Acad. Sci. USA, 10.1073/pnas.040575997.
Article and publication date are at www.pnas.org/cgi/doi/10.1073/pnas.040575997
References
- 1.Yalow R S, Berson S A. Nature (London) 1959;184:1648–1649. doi: 10.1038/1841648b0. [DOI] [PubMed] [Google Scholar]
- 2.Engvall E, Perlmann P. Immunochemistry. 1971;8:871–874. doi: 10.1016/0019-2791(71)90454-x. [DOI] [PubMed] [Google Scholar]
- 3.Vogel J S, Turtletaub K W, Finkel R, Nelson D E. Anal Chem. 1995;67:353A–359A. doi: 10.1021/ac00107a001. [DOI] [PubMed] [Google Scholar]
- 4.Tuniz C, Bird J R, Fink D, Herzog G F. Accelerator Mass Spectrometry: Ultrasensitive Analysis for Global Science. Boca Raton, FL: CRC; 1998. [Google Scholar]
- 5.Turteltaub K W, Felton J S, Gledhill B L, Vogel J S, Southon J R, Caffee M W, Finkel R C, Nelson D E, Proctor I D, Davis J C. Proc Natl Acad Sci USA. 1990;87:5288–5292. doi: 10.1073/pnas.87.14.5288. [DOI] [PMC free article] [PubMed] [Google Scholar]
- 6.Creek M R, Mani C, Markee C E, Vogel J S, Turteltaub K W. Carcinogenesis. 1997;18:2421–2427. doi: 10.1093/carcin/18.12.2421. [DOI] [PubMed] [Google Scholar]
- 7.Dingley K H, Roberts M L, Velsko C A, Turteltaub K W. Chem Res Toxicol. 1998;11:1217–1222. doi: 10.1021/tx9801458. [DOI] [PubMed] [Google Scholar]
- 8.Dingley K H, Curtis K D, Nowell S, Felton J S, Lang N P, Turteltaub K W. Cancer Epidemiol Biomarkers Prev. 1999;8:507–512. [PubMed] [Google Scholar]
- 9.Gilman S D, Gee S J, Hammock B D, Vogel J S, Haack K, Buchholz B A, Freeman S, Wester R C, Hui X Y, Maibach H I. Anal Chem. 1998;70:3463–3469. doi: 10.1021/ac971383v. [DOI] [PubMed] [Google Scholar]
- 10.Clifford A J, Arjomand A, Dueker S R, Schneider P D, Buchholz B A, Vogel J S. Adv Exp Med Biol. 1998;445:239–251. doi: 10.1007/978-1-4899-1959-5_15. [DOI] [PubMed] [Google Scholar]
- 11.Buchholz B A, Fultz E, Haack K W, Vogel J S, Gilman S D, Gee S J, Hammock B D, Hui X, Wester R C, Maibach H I. Anal Chem. 1999;71:3519–3525. doi: 10.1021/ac990152g. [DOI] [PubMed] [Google Scholar]
- 12.Buchholz B A, Arjomand A, Dueker S R, Schneider P D, Clifford A J, Vogel J S. Anal Biochem. 1999;269:348–352. doi: 10.1006/abio.1999.4041. [DOI] [PubMed] [Google Scholar]
- 13.Belluck D A, Benjamin S L, Dawson T. In: Pesticide Transformation Products, Fate and Significance in the Environment. Somasundaram L, Coats J R, editors. Washington, DC: Am. Chem. Soc.; 1991. pp. 254–273. [Google Scholar]
- 14.Becher H, Flesch-Janys D. Environ Health Perspect. 1998;106, Suppl. 2:623–624. doi: 10.1289/ehp.98106623. [DOI] [PMC free article] [PubMed] [Google Scholar]
- 15.Safe S H. J Anim Sci. 1998;76:134–141. doi: 10.2527/1998.761134x. [DOI] [PubMed] [Google Scholar]
- 16.Schneider P, Hammock B D. J Agric Food Chem. 1992;40:525–530. [Google Scholar]
- 17.Wortberg M, Jones G, Kreissig S B, Rocke D M, Gee S J, Hammock B D. Anal Chim Acta. 1996;319:291–303. [Google Scholar]
- 18.Sanborn J R, Gee S J, Gilman S D, Sugawara Y, Jones A D, Rogers J, Szurdoki F, Stanker L H, Stoutamire D W, Hammock B D. J Agric Food Chem. 1998;46:2407–2416. [Google Scholar]
- 19.Sugawara Y, Gee S J, Sanborn J R, Gilman S D, Hammock B D. Anal Chem. 1998;70:1092–1099. doi: 10.1021/ac9708203. [DOI] [PubMed] [Google Scholar]
- 20.Vogel J S. Radiocarbon. 1992;34:344–350. [Google Scholar]
- 21.Rodbard D, Feldman H A. Methods Enzymol. 1975;36:3–16. doi: 10.1016/s0076-6879(75)36003-5. [DOI] [PubMed] [Google Scholar]
- 22.Scatchard G. Ann NY Acad Sci. 1949;51:660–672. [Google Scholar]
- 23.Blake D A, Chakrabarti P, Khosraviani M, Harcher F M, Westhoff C M, Geobel P, Wylie D E, Blake R C, II. J Biol Chem. 1996;271:27677–27685. doi: 10.1074/jbc.271.44.27677. [DOI] [PubMed] [Google Scholar]
- 24.Diamandis E P, Christopoulos T K. In: Immunoassay. Diamandis E P, Christopoulos T K, editors. San Diego: Academic; 1996. pp. 25–50. [Google Scholar]
- 25.Jackson T M, Ekins R P. J Immunol Methods. 1986;87:13–20. doi: 10.1016/0022-1759(86)90338-8. [DOI] [PubMed] [Google Scholar]
- 26.56 Federal Register 98 (1991), p. 23403.
- 27.Suter M, Jacob S T, Synal H A. Nucl Inst Methods Phys Res. 1997;B123:148–152. [Google Scholar]
- 28.Hughey B J, Klinkowstein R E, Shefer R E, Skipper P L, Tannenbaum S R, Wishnok J S. Nucl Inst Methods Phys Res. 1997;B123:153–158. [Google Scholar]
- 29.Mous D J W, Purser K H, Fokker W, Vandenbroek R, Koopmans R B. Nucl Inst Methods Phys Res. 1997;B123:159–162. [Google Scholar]


