

Abstract
DNA barcoding as an approach for species identification is rapidly increasing in popularity. However, it remains unclear which statistical procedures should accompany the technique to provide a measure of uncertainty. Here we describe a likelihood ratio test which can be used to test if a sampled sequence is a member of an a priori specified species. We investigate the performance of the test using coalescence simulations, as well as using the real data from butterflies and frogs representing two kinds of challenge for DNA barcoding: extremely low and extremely high levels of sequence variability.
Keywords: DNA barcoding, likelihood ratio tests, assignment of individuals, coalescent simulations
1. Introduction
DNA barcoding is a technique for assigning specimens to species or other taxonomic units based on their DNA sequence in a standard marker, the DNA barcode (Hebert et al. 2003a; Tautz et al. 2003). Despite growing popularity of the approach, it remains unclear which statistical procedures should be used to assign an unknown specimen to a species, and how to associate the assignments with measures of statistical uncertainty. The major problem arises because within-species variability and between-species variability can easily be confounded (Lipscomb et al. 2003; Seberg et al. 2003). The extent of these variations may be notably different across the animal phylogeny (Hebert et al. 2003b). Statistical methods in DNA barcoding must, therefore, be aimed primarily at discriminating intra- from inter-specific variability on the basis of actual sequence data.
There are several population genetic approaches for assignment of individuals, such as the methods of Paetkau et al. (1995), Rannala & Mountain (1997), Cornuet et al. (1996), Cornuet et al. (1999), and Pritchard et al. (2000). All these methods consider multi-locus data, e.g. restriction fragment length polymorphisms (RFLP), single nucleotide polymorphisms (SNP) or microsatellite data. The situation in DNA barcoding is slightly different because assignment is based on a single DNA sequence, usually not subject to recombination. New statistical and population genetic methods are needed to deal with this special situation.
In this paper we consider the problem of testing membership of a particular, a priori specified, species. This situation may arise in many cases, for example in screens of invasive species, pathogenic bacterial strains, toxic algae or products from protected species (e.g. Tautz et al. 2002, 2003; Armstrong & Ball 2005; Lorenz et al. 2005; Markmann & Tautz 2005). We will assume that more than one sequence from the focal species is known. A new sequence has been obtained from a sample and it is then of interest to the hypothesis that the new sequence was obtained from an individual from the focal species. We propose a new likelihood ratio test to address this problem, based on existing population genetic Markov Chain Monte Carlo methods (MCMC).
2. Methods and theory
In the following, we will describe how a likelihood ratio test can be constructed to test the hypothesis of species membership. The basic idea is to use a model with two populations, one population containing all existing database sequences from the species, and another population containing the new sampled sequence. The null hypothesis is then specified as H0: T=0, where T is the divergence time between the two species.
The likelihood function is defined as a function proportional to the sampling probability of the data, conditional on the parameters, e.g. Pr(X|Ψ), where X is a vector of DNA sequences from multiple individuals, and Ψ is a vector of parameters. A fundamental problem in the analysis of DNA sequence data in population genetics is that the likelihood function cannot be calculated analytically. However, the likelihood conditional on the underlying gene tree (or coalescent tree) can be easily calculated using standard methods of phylogenetics. The following representation of the likelihood is often used:
| (2.1) |
where G is the gene tree, Ω is the set of all possible gene trees, and f(G|Ψ) is the density of gene trees. The integral can be thought of as a sum over all possible gene tree topologies and a multi-dimensional integral over all possible coalescent times (lineage divergence times in the gene tree). This integral cannot be evaluated analytically, or using numerical integration, for realistically large sets of DNA sequences, but must be evaluated using stochastic methods. For example, Griffiths & Tavaré (1994), as well as Stephens & Donnelly (2000), used a simulation technique known as sequential importance sampling (e.g. Liu 2001), while Kuhner et al. (1995) and Nielsen & Wakeley (2001) used MCMC. In the MCMC methodology of Nielsen & Wakeley (2001), a Markov chain is defined with state space on Ω×Ψ, where Ψ is the parameter space, i.e. Ω×Ψ for all values of Ψ. A prior distribution is assigned to Ψ and a Markov chain is then constructed with stationary distribution (equilibrium distribution) given by the joint posterior distribution of G and Ψ, i.e. f(G, Ψ|X). When simulating this Markov chain, parameter values sampled from it (at stationarity) follow the marginal posterior for Ψ, f(Ψ|X). Using a uniform prior for Ψ, the integrated likelihood function for Ψ is simply given by f(Ψ|X). Inferences regarding the parameters can then either proceed in a Bayesian or a frequentist framework.
Nielsen & Wakeley (2001) considered a model with migration and divergence between two populations. We will here use a simplification that assumes no ongoing gene flow between the two populations (i.e. zero migration rate). In tests of T=0, including migration in the model would add an additional parameter, leading to an undesirable increase in degrees of freedom in the test. Also, since only one sequence has been assigned to one of the populations, the effective population size of this population does not affect the likelihood calculation. The only scalar parameters of the model are then θ=2Nfμ (where Nf is the effective female population size and μ is the mutation rate), and the scaled divergence time T, i.e. Ψ=(θ, T). This definition of θ is valid for mtDNA. For nuclear DNA of a diploid species, θ=4Nμ.
In the MCMC scheme applied to this model, T can then be estimated by sampling values of T from the Markov chain at stationarity. To obtain smooth estimates of the likelihood surface and to obtain the likelihood at T=0, we use Gaussian kernel density estimation using Silverman's rule-of-thumb for choice of bandwidth (e.g. Silverman 1986). The maximum likelihood value of the integrated likelihood surface from T and the likelihood value for T=0 is then estimated from the same run of the Markov chain. A likelihood ratio based on the integrated likelihoods is then formulated as
where L(T) is the integrated likelihood function for T. The reason to base the test on the integrated likelihood instead of the profile likelihood is that the Monte Carlo variance in the estimate of the profile likelihood is higher than the variance in the integrated likelihood, because of the lower dimensionality of the integrated likelihood function compared to the joint likelihood function for both parameters. The classical results for the asymptotic distribution of the likelihood ratio under the null hypothesis would dictate that the likelihood ratio test statistic is a 50 : 50 mixture of a point mass at zero and a distribution (e.g. Self & Liang 1987). This would, for example, mean that the null hypothesis is rejected at the 5% significance level if the likelihood ratio statistic exceeds ∼2.71. However, in this case the likelihood cannot be written as the product of likelihood functions calculated in multiple independent data points. The applicability of the classical results is, therefore, questionable, which prompted us to perform coalescent simulations to determine the distribution of the test statistic under the null hypothesis.
3. Analysis of simulated data
The simulation of sequences under the coalescent model was performed using the MS program (Hudson 2002) under an infinite sites model, assuming θ=3, 12 and 30 (per locus); θ=12 represented more or less common situations in animal barcoding (Hebert et al. 2003b), while θ=3 and 30 modelled low-divergence and high-divergence situations, respectively. For each of the three values of θ, we produced 100 datasets composed of either 4, 11 or 26 sequences, one of which was then randomly chosen as the query sequence, resulting in n=3, 10 or 25 ‘database’ sequences. For each simulated data set, 500 000 updates of the Markov chain were performed using a burn-in period of 50 000. Although more updates might be recommendable for real data analysis, using 500 000 updates provides reasonably accurate estimates of the likelihood ratio while allowing multiple simulations to be performed in a short amount of time.
The frequency distribution of likelihood ratios are shown in figure 1. For small sample sizes or small values of θ, the type I error rate (rejection of the correct species) for the critical value of 2.7 was slightly lower than 5%. However, for large sample sizes a test based on a critical value of 2.7 would reject the correct species much more often than in the expected 5% of cases. The most extreme case is n=25 and θ=30, where the critical value of 2.7 for likelihood ratio statistic resulted in 15/100 rejections. From the simulations it appeared that a critical value of 4 would ensure a 5% significance level test of the right size (figure 1b). Still, the coalescent simulations did not address the magnitude of type II error rate for this critical value. This issue was further investigated in the simulations involving real data (see below).
Figure 1.

(a) Frequencies of likelihood ratios in the test applied to sequence data simulated using different values of θ per locus, for different number of database sequences. Horizontal axis, value of likelihood ratio test statistic; vertical axis, number of replicates out of 100. (b) Summary of the results from panel A.
The major reason why the rejection rate increases with θ and n appears to be that likelihood ratio is harder to estimate for larger sample sizes. The increased Monte Carlo variance for these parameter values inflates the rejection rate. This problem can be rectified by increasing the number of cycles in the MCMC procedure. In real data analysis it may also be desirable to obtain critical values directly by parametric bootstrapping, although such procedures may be computationally expensive. Future research may also be focused on more computationally efficient methods for estimating the likelihood ratio.
4. Analysis of real data
We examined two real data sets representing two marginal cases of extremely low and extremely high sequence variability, both at the intra- and inter-specific levels. The first data set contains sequences from the skipper butterfly Astraptes fulgerator, which recently has been proposed to be a complex of perhaps as many as 12 separate species (Hebert et al. 2004a). Genetic differentiation between these species was originally identified by the phylogeny of cytochrome oxidase I (cox1) sequences, and was corroborated by the presence of morphological difference in caterpillars and the species of plants preferred by them as food. Still, both the degree of divergence within and between these species is very small (figure 2a), average θ estimate per species being only 0.65 for the whole locus. In sharp contrast to the butterflies, our second example—four species of the Australian rainforest frogs of the genus Litoria—displayed intra-specific cox1 sequence often exceeding 10% pairwise difference (figure 2b) (Schneider et al. 1998), with average θ=26. Such a high level of cox1 variability appears to be common in amphibians (Vences et al. 2005a,b).
Figure 2.

Consensus maximum parsimony trees for cox1 sequences from the two real data sets: (a) skipper butterfly Astraptes fulgerator species complex, and (b) four species of the tree frogs of the genus Litoria. Scale bars: 10 nucleotide changes. The number of individual sequences per species is indicates near the species names. (c–f): frequency distributions of the likelihood ratio test statistic in simulations with these datasets. The number of sequences used to represent a true or sister species in the test was either 3 (c, d) or 10 (e, f). Filled bars, test with correct species to assess type I error rate; open bars, test with sister species to assess type II error rate.
In the simulations described here, for each of the two datasets 100 sequences were drawn with replacement from the data pool to represent every species with equal probability (i.e. in each draw, first the species name was randomly chosen and then a sequence from this species was randomly selected). These queries were then tested using the likelihood ratio test for affiliation with their true species, to estimate the type I error rate, as well as for affiliation with the most similar ‘sister species’ identified on the basis of the blastn score (Altschul et al. 1997), to evaluate type II error rate. The use of the word sister species here reflects, therefore, sequence similarity and does not reflect any phylogenetic assessment of taxonomic status. From the sequences originating from each of these two species, several ‘database sequences’ were randomly chosen to represent them when applying the likelihood ratio test. We performed simulations either with three or ten representative database sequences. In each case 100 000 updates of the Markov chain under a finite sites model was performed.
The frequencies of the likelihood ratios obtained in the simulations are shown in figure 2c,e (skipper butterfly) and figure 2d,f (tree frogs). Notice, that the distributions in most cases do not show much overlap when comparing the true species and the sister species. This shows that, if appropriate critical values have been obtained, powerful tests for rejecting species membership can be constructed. For 10 sequences, assuming a critical value of 2.7 for the likelihood ratio test results in a conservative test with high power to reject the wrong species, the type I error was less than 5% and the power (1—type I error) was larger or around 95% (figure 3). Note that in both these cases, using a critical value of 2.7 results in a test with good properties (figure 3), whereas re-setting the critical value to 4 would result in dramatic increase in type II error rate (loss of power). However, when analysing only three representative database sequences, the power was significantly reduced (figure 3). Additionally, a critical value of 2.7 would result in an anti-conservative test in the case of Litoria.
Figure 3.
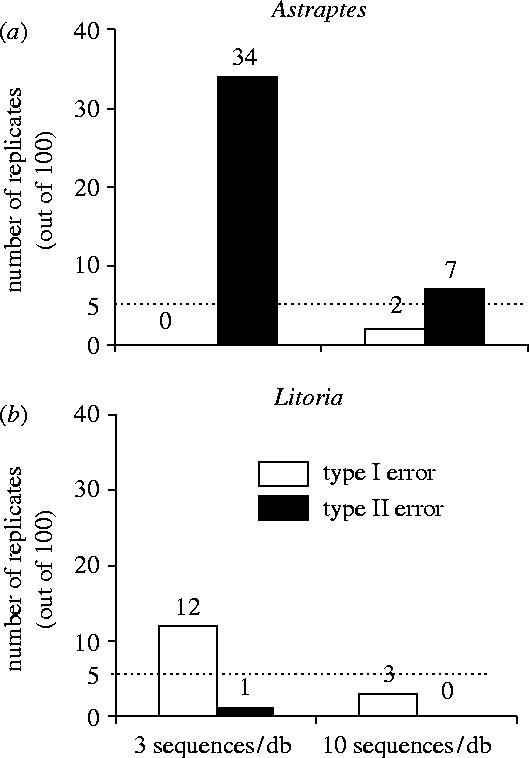
Summary of error rates obtained for Astraptes (a) and Litoria (b) datasets with different number of sequences per species in the database, assuming the critical value of 2.7. Open bars, type I error rate; filled bars, type II error rate.
5. Discussion
The likelihood ratio test presented here is one of the first attempts to introduce statistical rigor into DNA barcoding. It is designed to explicitly evaluate the possible boundaries of intra-specific variation on the basis of the available sequence data, using population genetic inference based on coalescent theory. It is essentially a test of population subdivision between a query sequence and a set of database sequences. This procedure represents a significant step towards realistic species modelling in comparison to the previously suggested limiting threshold approach, which simply assumes that the intra-specific sequence variation cannot exceed certain pairwise distance (Floyd et al. 2002; Hebert et al. 2003a,b).
The taxonomic affiliation of the query sequence is sometimes inferred using tree-building methods on the basis of phylogenetic grouping of the query (Hebert et al. 2004a,b). Our method is in fact a tree-based one as well, but it takes into account phylogenetic uncertainty and uses population genetic theory to determine cut-offs in ambiguous cases (e.g. cases with lineage sorting). For example, based on purely topological arguments, at least 12 sequences would be needed to have a theoretical chance of rejecting species membership at the 5% significance level, assuming all topologies are equally likely. The population genetic approach essentially makes use of the distribution of branch-lengths to determine if species membership is plausible.
Throughout this work, we assumed the simplest model of intra-specific variability based on a single panmictic population of constant size. Caution should be exercised, therefore, in direct applications of the test to cases where these assumptions may be seriously violated, for example, when the query sequence has been obtained from a distinct geographic area than the database sequences. Although we expect that the concept of effective population size may mitigate most of the complications, the extent to which our test is applicable to non-ideal populations remains to be investigated. In the future, it may be feasible to include the possibility of modifying the parameters of the intra-specific variability model, to appropriately account for such factors as strong population subdivision or varying population size (Hey & Nielsen 2004; Hey et al. 2004; Hey 2005; Won & Hey 2005).
A thorny issue in the application of our test is the choice of the critical value. Our coalescent simulations suggest that a critical value of 4 should result in a test of the right size (i.e. a test where the expected number of false rejections when the null hypothesis is true is less than or equal to 5%). However, using such a critical value in the analysis of real data may result in a conservative test, as suggested by our simulations with real data.
The likelihood ratio test can be easily adapted for use in routine DNA barcoding. However, it is obvious that the power of the test depends greatly on the number of samples in the database. Although tests based on only three sequences have some power, it is clear that more sequences are desirable. Databases containing only a single sequence from each species cannot be used to test for species membership without making additional assumptions regarding θ. Unfortunately, at the current stage of development of DNA barcoding databases, in which the depth of individual species sampling is usually sacrificed in favour of greater taxonomic coverage, it will in most cases not be possible to test for species membership using our procedure. For example, the database of DNA barcodes for the North American birds (Hebert et al. 2004b) includes just one or two sequences for the majority of species. We believe that the priorities in the data accumulation for DNA barcode databases should be adjusted to balance the two essential informational components, intra-specific and inter-specific sampling. Otherwise, the implementation of the DNA barcoding technology would be delayed, or even worse, would lead to artefacts resulting from confusion between intra- and inter-specific genetic variation.
Finally, we would like to point out that the DNA barcoding technology at the present moment sacrifices a great deal of potential power by relying on just a single molecular marker. The data acquisition for a multi-locus DNA barcoding database may be more feasible than it seems, since the stages associated with sample collection, DNA isolation and (partially) PCR set up would not require additional investments in comparison to single-locus data acquisition (e.g. see Chase et al. 2005; Summerbell et al. 2005). The current statistical method could also be modified to analyse data from multiple loci (e.g. Hey & Nielsen 2004; Hey et al. 2004).
Acknowledgements
Funding for this project was provided by grants from NIH (GM066243) and US Department of Defense (SERDP program) to MVM, and HFSP Grant RGY0055/2001-M, NSF Grant DEB-0089487 and NSF/NIH Grant DMS/NIGMS—0201037 to RN.
Footnotes
One contribution of 18 to a Theme Issue ‘DNA barcoding of life’.
References
- Altschul S.F, Madden T.L, Schaffer A.A, Zhang J.H, Zhang Z, Miller W, Lipman D.J. Gapped BLAST and PSI-BLAST: a new generation of protein database search programs. Nucl. Acids Res. 1997;25:3389–3402. doi: 10.1093/nar/25.17.3389. 10.1093/nar/25.17.3389 [DOI] [PMC free article] [PubMed] [Google Scholar]
- Armstrong K.F, Ball S.L. DNA barcodes for biosecurity: invasive species identification. Phil. Trans. R. Soc. B. 2005;360:1813–1823. doi: 10.1098/rstb.2005.1713. 10.1098/rstb.2005.1713 [DOI] [PMC free article] [PubMed] [Google Scholar]
- Chase M.W, Salamin N, Wilkinson M, Dunwell J.M, Kesanakurthi R.P, Haidar N, Savolainen V. Land plants and DNA barcodes: short-term and long-term goals. Phil. Trans. R. Soc. B. 2005;360:1889–1895. doi: 10.1098/rstb.2005.1720. 10.1098/rstb.2005.1720 [DOI] [PMC free article] [PubMed] [Google Scholar]
- Cornuet J.M, Aulagnier S, Lek S, Franck P, Solignac M. Classifying individuals among infra-specific taxa using microsatellite data and neural networks. C. R. Acad. Sci. Paris. Life Sci. 1996;319:1167–1177. [PubMed] [Google Scholar]
- Cornuet J.M, Piry S, Luikart G, Estoup A, Solignac M. New methods employing multi-locus genotypes to select or exclude populations as origins of individuals. Genetics. 1999;153:1989–2000. doi: 10.1093/genetics/153.4.1989. [DOI] [PMC free article] [PubMed] [Google Scholar]
- Floyd R, Abebe E, Papert A, Blaxter M. Molecular barcodes for soil nematode identification. Mol. Ecol. 2002;11:839–850. doi: 10.1046/j.1365-294x.2002.01485.x. 10.1046/j.1365-294X.2002.01485.x [DOI] [PubMed] [Google Scholar]
- Griffiths R.C, Tavaré S. Simulating probability distributions in the coalescent. Theor. Pop. Biol. 1994;46:131–159. [Google Scholar]
- Hebert P.D.N, Cywinska A, Ball S.L, deWaard J.R. Biological identification through DNA barcodes. Proc. R. Soc. B. 2003;270:313–321. doi: 10.1098/rspb.2002.2218. 10.1098/rspb.2002.2218 [DOI] [PMC free article] [PubMed] [Google Scholar]
- Hebert P.D.N, Ratnasingham S, deWaard J.R. Barcoding animal life: cytochrome c oxidase subunit 1 divergences among closely related species. Proc. R. Soc. B. 2003;270:S96–S99. doi: 10.1098/rsbl.2003.0025. 10.1098/rspb.2002.2218 [DOI] [PMC free article] [PubMed] [Google Scholar]
- Hebert P.D.N, Penton E.H, Burns J.M, Janzen D.H, Hallwachs W. Ten species in one: DNA barcoding reveals cryptic species in the neotropical skipper butterfly Astraptes fulgerator. Proc. Natl Acad. Sci. USA. 2004;101:14 812–14 817. doi: 10.1073/pnas.0406166101. 10.1073/pnas.0406166101 [DOI] [PMC free article] [PubMed] [Google Scholar]
- Hebert P.D.N, Stoeckle M.Y, Zemlak T.S, Francis C.M. Identification of birds through DNA barcodes. Plos Biol. 2004b;2:1657–1663. doi: 10.1371/journal.pbio.0020312. 10.1371/journal.pbio.0020312 [DOI] [PMC free article] [PubMed] [Google Scholar]
- Hey J. On the number of new world founders: a population genetic portrait of the peopling of the Americas. Plos Biol. 2005;3:e193. doi: 10.1371/journal.pbio.0030193. 10.1371/journal.pbio.0030193 [DOI] [PMC free article] [PubMed] [Google Scholar]
- Hey J, Nielsen R. Multilocus methods for estimating population sizes, migration rates and divergence time, with applications to the divergence of Drosophila pseudoobscura and D. persimilis. Genetics. 2004;167:747–760. doi: 10.1534/genetics.103.024182. 10.1534/genetics.103.024182 [DOI] [PMC free article] [PubMed] [Google Scholar]
- Hey J, Won Y.-J, Sivasundar A, Nielsen R, Markert A. Using nuclear haplotypes with microsatellites to study gene flow between recently separated populations. Mol. Ecol. 2004;13:909–919. doi: 10.1046/j.1365-294x.2003.02031.x. 10.1046/j.1365-294X.2003.02031.x [DOI] [PubMed] [Google Scholar]
- Kuhner M.K, Yamato J, Felsenstein J. Estimating effective population size and mutation rate from sequence data using Metropolis-Hastings sampling. Genetics. 1995;140:1421–1430. doi: 10.1093/genetics/140.4.1421. [DOI] [PMC free article] [PubMed] [Google Scholar]
- Lipscomb D, Platnick N, Wheeler Q. The intellectual content of taxonomy: a comment on DNA taxonomy. Trends Ecol. Evol. 2003;18:65–66. 10.1016/S0169-5347(02)00060-5 [Google Scholar]
- Liu J.S. Monte Carlo Strategies in Scientific Computing. Springer; New York: 2001. [Google Scholar]
- Lorenz J.G, Jackson W.E, Beck J.C, Hanner R. The problems and promise of DNA barcodes for species diagnosis of primate biomaterials. Phil. Trans. R. Soc. B. 2005;360:1869–1877. doi: 10.1098/rstb.2005.1718. 10.1098/rstb.2005.1718 [DOI] [PMC free article] [PubMed] [Google Scholar]
- Markmann M, Tautz D. Reverse taxonomy: an approach towards determining the diversity of meiobenthic organisms based on ribosomal RNA signature sequences. Phil. Trans. R. Soc. B. 2005;360:1917–1924. doi: 10.1098/rstb.2005.1723. 10.1098/rstb.2005.1723 [DOI] [PMC free article] [PubMed] [Google Scholar]
- Nielsen R, Wakeley J.W. Distinguishing Migration from Isolation: an MCMC Approach. Genetics. 2001;158:885–896. doi: 10.1093/genetics/158.2.885. [DOI] [PMC free article] [PubMed] [Google Scholar]
- Paetkau D, Calvert W, Stirling I, Strobeck C. Microsatellite analysis of population structure in Canadian polar bears. Mol. Ecol. 1995;4:347–354. doi: 10.1111/j.1365-294x.1995.tb00227.x. [DOI] [PubMed] [Google Scholar]
- Rannala B, Mountain J.L. Detecting immigration using multi-locus genotypes. Proc. Natl Acad. Sci. USA. 1997;94:9197–9202. doi: 10.1073/pnas.94.17.9197. [DOI] [PMC free article] [PubMed] [Google Scholar]
- Schneider C.J, Cunningham M, Moritz C. Comparative phylogeography and the history of endemic vertebrates in the Wet Tropics rainforests of Australia. Mol. Ecol. 1998;7:487–498. 10.1046/j.1365-294x.1998.00334.x [Google Scholar]
- Seberg O, Humphries C.J, Knapp S, Stevenson D.W, Petersen G, Scharff N, Andersen N.M. Shortcuts in systematics? A commentary on DNA-based taxonomy. Trends Ecol. Evol. 2003;18:63–65. 10.1016/S0169-5347(02)00059-9 [Google Scholar]
- Self S.G, Liang K.Y. Asymptotic properties of maximum likelihood estimators and likelihood ratio tests under nonstandard conditions. J. Am. Stat. Assoc. 1987;82:605–610. [Google Scholar]
- Silverman B. Density Estimation for Statistics and Data Analysis. Chapman & Hall; London: 1986. [Google Scholar]
- Stephens M, Donnelly P. Inference in molecular population genetics. J. Roy. Stat. Sco. B. 2000;62:605–635. [Google Scholar]
- Summerbell R.C, et al. Microcoding: the second step in DNA barcoding. Phil. Trans. R. Soc. B. 2005;360:1897–1903. doi: 10.1098/rstb.2005.1721. 10.1098/rstb.2005.1721 [DOI] [PMC free article] [PubMed] [Google Scholar]
- Tautz D, Arctander P, Minelli A, Thomas R.H, Vogler A.P. DNA points the way ahead of taxonomy – in assessing new approaches, it's time for DNA's unique contribution to take a central role. Nature. 2002;418:479. doi: 10.1038/418479a. 10.1038/418479a [DOI] [PubMed] [Google Scholar]
- Tautz D, Arctander P, Minelli A, Thomas R.H, Vogler A.P. A plea for DNA taxonomy. Trends Ecol. Evol. 2003;18:70–74. 10.1016/S0169-5347(02)00041-1 [Google Scholar]
- Vences M, Thomas M, van der Meijden A, Chiari Y, Vieites D.R. Comparative performance of the 16S rRNA gene in DNA barcoding of amphibians. Front. Zool. 2005a;2:5. doi: 10.1186/1742-9994-2-5. 10.1186/1742-9994-2-5 [DOI] [PMC free article] [PubMed] [Google Scholar]
- Vences M, Thomas M, Bonett R.M, Vieites D.R. Deciphering amphibian diversity through DNA barcoding: chances and challenges. Phil. Trans. R. Soc. B. 2005;360:1859–1868. doi: 10.1098/rstb.2005.1717. 10.1098/rstb.2005.1717 [DOI] [PMC free article] [PubMed] [Google Scholar]
- Won Y.J, Hey J. Divergence population genetics of chimpanzees. Mol. Biol. Evol. 2005;22:297–307. doi: 10.1093/molbev/msi017. 10.1093/molbev/msi017 [DOI] [PubMed] [Google Scholar]