

Abstract
Micro-photolithographic methods have been employed to form discrete patterns of spinal cord astrocytes that allow quantitative measurements of Ca2+ wave propagation. Astrocytes were confined to lanes 20–100 μm wide and Ca2+ waves propagated from a point of mechanical stimulation or of application of adenosine triphosphate; all Ca2+ wave propagation was blocked by simultaneous application of purinergic P2Y1 and P2Y2 antagonists. Stimulation of an astrocyte at one end of a lane, followed by further stimulation of this astrocyte, gave rise to Ca2+ transients in the same astrocytes; however, if the second stimulation was applied to an astrocyte at the other end of the lane, then this gave rise to a different but overlapping set of astrocytes generating a Ca2+ signal. Both the amplitude and velocity of the Ca2+ wave decreased over 270 μm from the point of initiation, and thereafter remained, on average, constant with random variations for at least a further 350 μm. Also, the percentage of astrocytes that gave a Ca2+ transient decreased with distance along lanes. All the above observations were quantitatively predicted by our recent theoretical model of purinergic junctional transmission, as was the Ca2+ wave propagation along and between parallel lanes of astrocytes different distances apart. These observations show that a model in which the main determinants are the diffusion of adenosine triphosphates regeneratively released from a stimulated astrocyte, together with differences in the properties and density of the purinergic P2Y receptors on astrocytes, is adequate to predict a wide range of Ca2+ wave transmission and propagation phenomena.
INTRODUCTION
The propagation of calcium (Ca2+) waves through astrocytes has been of considerable interest since their first discovery (1). The amplitude and the velocity of a wave decreases continuously over the first 200 μm or so from the site of initiation (2,3) and propagation from a site of mechanical or chemical stimulation in two-dimensional cultures is thought to terminate within ∼250–350 μm (∼60 cells: (1,3–12)), regardless of whether the astrocytes are derived from cortex (9), striatum (13), or hippocampus (1). In all these cases, the velocity of the Ca2+ wave is 15–27 μm s−1 near the site of stimulation and thereafter decreases (1,3,5,7,8,11,14,15).
Micropatterned substrates have recently been developed (16), using photolithographic methods, that allow control of the location of astrocytes for growth. Astrocytes were confined to parallel grooves or lanes some 110-μm wide separated by cell-free lanes 40-μm wide. Such defined networks were shown to propagate Ca2+ waves along a lane at a velocity that continuously decreased from ∼20 μm s−1 at 50 μm to ∼8 μm s−1 at 200 μm from a site of mechanical stimulation. Thus these lanes allow quantitative measurements to be made in a controlled astrocyte system to answer key questions concerning Ca2+ wave propagation: Is the decrease in amplitude and velocity of the Ca2+ wave related to lane width and/or astrocyte density? Does the Ca2+ wave cease to propagate beyond ∼300 μm in lanes? Is the profile of decrease in Ca2+ amplitude and velocity along a lane contingent on the mode of initiation of the Ca2+ wave? Finally, are the same astrocytes excited to give a Ca2+ wave, independent of which astrocyte in the lane is mechanically stimulated (4,7,8)?
We recently developed a theoretical model of purinergic transmission of Ca2+ waves between astrocytes that accounts for many of the properties of the propagating wave, such as the dependence of velocity on the type of P2Y receptors on the astrocytes and the time lag of Ca2+ wave propagation behind that of adenosine triphosphate (ATP) propagation (17). In this work we use this model to quantitatively account for our experimental observations on the changes in amplitude and velocity of a Ca2+ wave along astrocyte lanes and on the number of astrocytes that participate in generating Ca2+. In addition, we show that it predicts the conditions under which discrete networks of astrocyte lanes can propagate a Ca2+ wave.
METHODS
Cell culture
Mixed cultures of spinal cord glia were obtained from neonatal 12-hour-old Sprague-Dawley rat pups by use of culture methods adapted from Scemes et al. (18). Further purification of the cell culture was performed using methods established by Cole and de Vellis (19) and Weisinger et al. (20).
Immunochemistry
To identify lane-seeded astrocytes we labeled them using a primary monoclonal antibody (anti-glial fibrillary acidic protein) and a fluorescently conjugated secondary antibody (Alexa Fluor 488 goat anti-mouse IgG, Invitrogen, Molecular Probes, Eugene, OR). Cells were examined by confocal microscopy using a Leica TCS SPII multi-photon microscope (Leica, Wetzlar, Germany).
Mechanical stimulation of Ca2+ waves
A fire-polished glass micropipette with tip ∼3–5 μm diameter was used to mechanically stimulate a single astrocyte to evoke Ca2+ waves. The tip was driven by a piezo-stepper (P-2000, Physik Instrumente, Karlsruhe, Germany) that ensured that the cell was touched at a low velocity of 0.12 μm s−1.
Drug application
The micropipette was filled with 100 μM ATP (Sigma, St. Louis, MO), prepared in extracellular recording solution. A jet of ATP was ejected by a single pulse using a pressure of 25 Pa and duration of 125 ms. The trapezoidal area covered by the ATP jet was from 1000 μm2 to 2500 μm2, as determined by dye ejection from the micropipette, so that ∼8 cells were hit by the ATP jet.
Ca2+ recording
All experiments were conducted at room temperature (20–22°C). Each set of Ca2+ dye-imaged (Fluo-3 AM; Molecular Probes) lane-seeded cells were allowed to recover for 60 min after stimulation. Images were captured and processes as described in Macleod et al. (21). The relative fluorescence amplitude (ΔF/F), was calculated using the formula
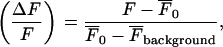 |
where F is the amplitude of the Ca2+ transient,  is the amplitude averaged over the interval immediately before the calcium transient, and
  is the average fluorescence intensity measured in several cell-free areas. Ca2+ transients with a maximum ΔF/F value <0.3 (being 15% of the largest Ca2+ transient observed in a lane of astrocytes) were discounted as being too close to the noise level to be reliable. All experiments were repeated at least three times and values are presented as mean ± SD. Statistical significance was determined with the use of unpaired t-tests and ANOVA, and P < 0.05 was considered significant.
Lane-seeded astrocytes
Astrocytes were confined to grow along lanes tens of micrometers wide and hundreds of micrometers long (see Supplementary Material). For this purpose, we employed soft photolithographic micropatterning techniques (16,22,23).
Drugs and other chemicals
We used: monoclonal mouse anti-glial fibrillary acidic protein (Sigma); Alexa Fluor 488 goat anti-mouse IgG (Molecular Probes); polyclonal goat anti-P2Y1 and anti-P2Y2 (Santa Cruz Biotechnology, Santa Cruz, CA); calcium fluorescent dye Fluo-3 AM (Molecular Probes); apyrase grade III (Sigma); adenosine 3′-phosphate 5′-phosphosulphate (A3P5PS) (Sigma); adenosine 5′-triphosphate (Sigma); Dulbecco's Modified Eagle's Medium (Sigma); penicillin/streptomycin/glutamine (Gibco, Invitrogen, Carlsbad, CA); cosmic calf serum (Progen, Singapore); horse serum (Trace Bioscientific, Castle Hill, NSW, Australia); d-sorbitol (Sigma); high-gelling temperature agarose (Sigma); poly-d-lysine (Sigma); negative radiation sensitive-resist SU-55 (MicroChem, Newton, MA); SU-8.5 developer (MicroChem); and silicone elastomer, Sylgard (Dow Corning, Midland, MI).
THEORY
A detailed description of the mathematical model is given in Bennett et al. (17); here, we give only a brief summary of the main aspects.
Communication between the model astrocytes is mediated by ATP diffusing in the extracellular space. This ATP binds reversibly to metabotropic receptors (P2Y) on the surface of cells so that the ratio of bound to total receptors is given by
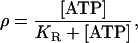 |
where [ATP] is the extracellular ATP concentration and KR is the dissociation constant for ATP binding. The value KR is the concentration of ATP at which half the total receptors are bound, and is an important parameter in the model; in addition to being a measure of the affinity of different receptor types (P2Y1 and P2Y2), it also can be taken to reflect additional variables such as spatial variations in receptor density, and ρ then becomes a measure of the effective activity of ATP as a function of space and time. Thus KR is to be understood as an effective, rather than an actual, dissociation constant (see Receptors in (17)).
The activated receptors initiate a G-protein cascade leading to the activation of phospholipase C and the cleaving of phosphatidylinositol 4,5-bisphosphate to produce inositol 1,4,5-trisphosphate (IP3). The equations describing this process are a simplification of the scheme given in Lemon et al. (24), as presented in Bennett et al. (17). This IP3 diffuses only inside the cytosol and activates the release of ATP from the cell boundary into the extracellular space, with the internal ATP stores undergoing depletion as a result. There are no gap junctions in this model, so IP3 does not diffuse between cells. This released ATP then diffuses in the extracellular space where it acts in both an autocrine and a paracrine manner to release further ATP via the purinergic metabotropic pathway. To prevent an ATP wave being spontaneously generated by resting levels of IP3, the release of ATP only occurs when the concentration of IP3 exceeds a threshold value.
Ca2+ is released from internal stores as a result of the increase in cytosolic IP3 concentration (details in (17)). It is to be noted that in this model the Ca2+ does not have an active role in the production of IP3 or ATP, as no feedback loops are included. Ca2+ production is included since it is the quantity visualized experimentally, but it plays no active part in the propagation of the Ca2+ wave.
Each astrocyte is represented by a cube of sides of 25-μm, and these cubes are arranged in two-dimensional arrays with a 25-μm spacing between them. As explained in Bennett et al. (17), this simplified geometry does not model the spatial complexity of a real astrocyte, but is a lumped approximation. The diffusion of IP3 inside the cells and of ATP in the extracellular space is implemented numerically on a three-dimensional rectangular grid using a leap-frog algorithm, as described in Bennett et al. (17). The Ca2+ wave can be initiated either by increasing the IP3 concentration in a single cell, or by applying ATP extracellularly. In the present calculations a fixed concentration of ATP (typically, 80 μM) is applied for an extended time (typically, 5 s) to the surface of one model astrocyte. This is an increase over the initial concentration used in Bennett et al. (17) and is necessary to obtain agreement with the experimental results. Similar initial ATP concentrations have been observed after mechanical stimulation of retinal astrocytes (25). Unless otherwise specified, the parameters used are those given in Table 1 of Bennett et al. (17). The values assigned to KR have been chosen to give agreement with the experimental results; as explained above, these are effective values that take into account a number of variables, and so are not actual dissociation constants for P2Y receptors.
RESULTS
Reproducibility of Ca2+ patterns along lanes of astrocytes
To test if initiation of Ca2+ wave propagation by stimulation of a particular astrocyte gives rise to a wave that propagates over a particular set of astrocytes in a lane, a stimulus was applied to one astrocyte and then reapplied to the same astrocyte some 10 min later, with note taken of the astrocytes sustaining the Ca2+ wave propagation in both cases. Fig. 1 A shows the results for one of four experiments. Stimulating one astrocyte (Fig. 1 A a) gave rise to a Ca2+ transient in each of 17 astrocytes in that lane, indicated by the open circles (Fig. 1 A b). Subsequent stimulation of the same astrocyte 10 min later (Fig. 1 A c) gave rise to a Ca2+ transient in 13 astrocytes in the lane, all but one of which had responded to the first stimulus (compare Fig. 1 A d with Fig. 1 A b). In all four experiments of this kind the astrocytes giving a Ca2+ transient to the second stimulus were fewer than those responding to the first, and at least 90% had been initiated by the first stimulus (92 ± 6%) It will be noted that the number of astrocytes responding to either the first or the second stimulus is highest near the site of stimulation (compare Fig. 1 A d with Fig. 1 A b).
FIGURE 1.

(A) The reproducibility of Ca2+ patterns in a lane of astrocytes when a stimulus is applied to one astrocyte in the lane and a further stimulus is applied to the same astrocyte some 10 min later. (a,c) A lane of astrocytes 30-μm wide, together with the position of the exciting micropipette for the first (a) and second (c) stimulus. (b) The distribution of astrocytes indicated by open circles, that gave a Ca2+ signal in response to the first stimulus at the site indicated by the arrow. (d) The distribution of astrocytes that gave a Ca2+ signal in response to the second stimulus applied at the same site as the first stimulus; (○) astrocytes that gave a Ca2+ signal for both stimuli and (▵) an astrocyte that gave a Ca2+ signal only to the second stimulus. (B) The reproducibility of Ca2+ patterns in lanes of astrocytes when a first stimulus is applied to one astrocyte in a lane and a second stimulus some 10 min later to a different astrocyte in the same lane. (a, c) A lane of astrocytes 50-μm wide, together with the position of the exciting micropipette for the first (a) and second (c) stimulus. (b) The distribution of astrocytes (○) that gave a Ca2+ signal in response to the first stimulus at the site indicated by the arrow. (d) The distribution of astrocytes that gave a Ca2+ signal in response to the second stimulus applied at the same site as the first stimulus; (○) astrocytes that gave a Ca2+ signal for both stimuli and (▵) astrocytes that gave a Ca2+ signal only to the second stimulus. Calibration is 45 μm in both A and B.
Next, consideration was given to the case in which the second stimulus was applied to a different astrocyte to that given the first stimulus. Fig. 1 B a shows the site of the micropipette for the first stimulus toward one end of the lane that gave rise to a Ca2+ transient in the 33 astrocytes indicated by the circles in Fig. 1 B b. Subsequent stimulation some 10 min later of an astrocyte toward the other end of the lane (Fig. 1 B c) excited Ca2+ in 38 astrocytes in the lane as shown in Fig. 1 B d. Of these, 29% were astrocytes not previously evoked by the first stimulus (compare Fig. 1 B d with Fig. 1 B b). These occurred in the vicinity of the stimulating electrode where, as before, the greatest number of responding astrocytes was found (Fig. 1 B d). In all four experiments of this kind there was substantially smaller overlap of responding astrocytes due to the second stimulus, compared with the first stimulus, than there was when both stimuli were applied to the same astrocyte (percentage of cells overlapping 62 ± 25% compared with 92 ± 6% (P < 0.001)). These observations suggest that the diffusion of ATP from the site of mechanical stimulation is at a sufficient concentration to activate many astrocytes in the immediate vicinity of the site. In contrast, secretion of ATP by astrocytes during propagation of a Ca2+ wave is insufficient to provide an ATP concentration that activates all these astrocytes.
Modeling the reproducibility of Ca2+ patterns along lanes of astrocytes
The model of purinergic transmission of Ca2+ wave propagation was next used to test the plausibility of the hypothesis that the pattern of astrocytes that generate a Ca2+ wave after stimulation of an astrocyte in a lane is determined by the relatively large ATP release at the site of stimulation, together with the distribution of astrocytes with particular KR values. Fig. 2 shows the distribution of astrocytes in a lane that possessed peak Ca2+ values >15% of the maximum after stimulation of an astrocyte, marked by a solid circle at one end of the lane, with a pulse of ATP. The clustering of activated astrocytes near the site of initiation of the Ca2+ wave is due to the large amount of ATP released in this region. Subsequent stimulation of an astrocyte at the opposite end of the lane, indicated by the other solid circle, gives rise to a pattern of activated astrocytes that tends to be the mirror image of the previous pattern of activated astrocytes (Fig. 2). It will be noted that astrocytes excited by both stimuli are found away from the sites of stimulation, as is observed experimentally (see Fig. 1 B b and d). This is attributed in the model to most cells being excited near the point of stimulation, even those with a high KR, because of the relatively high ATP concentration there, whereas further away only low KR cells are excited.
FIGURE 2.

Theoretical predictions of the distribution of astrocytes in a lane five-cells wide that give a Ca2+ response, with amplitude >15% of maximum, after excitation of a single astrocyte toward either end of the lane. Dots indicate the positions of astrocytes in the lane. Plus-symbols (+) indicate astrocytes that gave a response after stimulation of the astrocyte near the left-hand end of the lane indicated by the solid circle (•); and dot-circles (⊙) indicate responses to stimulation of the astrocyte near the right-hand end of the lane indicated by the solid circle (•). Thus, astrocytes that respond to both stimuli are indicated by a plus inside a circle (⊕). The KR values range from 25 μM to 125 μM for different astrocytes across each lane.
Quantitative characteristics of the propagating Ca2+ wave
The characteristics of Ca2+ wave propagation along lanes up to 600 μm from site of initiation were determined in order to see if the Ca2+ waves could propagate for long distances, even though at a reduced amplitude and velocity compared with those near the site of initiation. Fig. 3 shows an example of a Ca2+ wave propagating over 600 μm from the site of mechanical initiation with a micropipette. Stimulation with this micropipette, shown in Fig. 3 A, gives rise to Ca2+ transients in the astrocytes indicated in Fig. 3 B. The initial high values of the velocity and peak amplitude decline near the site of initiation as usual, but the Ca2+ wave is still propagating 600 μm away (see Fig. 3, C and D). Both the amplitude and velocity reach approximately constant values by a distance of between 300 μm and 400 μm, although random variations in these continue to occur (Fig. 3 E). It will be noted that the density of cells responding with a Ca2+ transient falls off along the length of a lane, so that although the cells might respond at a distance of 600 μm the density of cells doing so is relatively low.
FIGURE 3.

The amplitude and velocity of the Ca2+ wave in a lane of astrocytes do not decrease significantly beyond 300 μm from the site of initiation. Shown is an example in which the velocity and amplitude of the Ca2+ wave were followed for >600 μm from the site of mechanical initiation. (A) The astrocyte lane considered, together with the micropipette used for mechanical stimulation at the far left of the lane. (B) The astrocytes, indicated by open circles, that gave a Ca2+ signal in response to stimulation at the position of the arrow (calibration bar 45 μm). (C) The peak amplitude and (D) the velocity of the Ca2+ wave for astrocytes at different distances from the point of initiation. (E) Graph of peak amplitude (dotted line) and velocity (bold line) of the propagating Ca2+ wave in astrocytes at different distances from the site of initiation (amplitude and velocity were each normalized to their respective peak values).
Fig. 4 A shows a graph of the decline in amplitude of the average peak Ca2+ found in successive 45–90-μm-long segments of lanes along the length of six different lanes in six different experiments. After the initial decline over a distance of ∼300 μm, the peak Ca2+ settles down to a value between 15 and 40% of the value at the site of initiation. Between 250 and 300 μm the amplitude of ΔF/F, normalized to peak value, was 0.34 ± 0.16 (mean ± SD), which is not significantly different to that between 300 and 550 μm of 0.37 ± 0.10 (P > 0.25). A decline in the percentage of cells that give a Ca2+ transient in any segment (Fig. 4 B) accompanies this decline in peak Ca2+ amplitude, as is shown in Fig. 3 C. The rate of decline in the amplitude of Ca2+ and in the percentage of cells that give rise to a Ca2+ transient along a lane, is about the same until a steady state is reached (compare Fig. 4, A and B); the fraction of cells that give a Ca2+ transient, normalized to that near the site of initiation, is 0.42 ± 0.09 beyond 300 μm, which may be compared with the normalized ΔF/F beyond 300 μm of 0.37 ± 0.10 (P > 0.25). The decline in the peak amplitude of Ca2+ and of the percentage of cells giving a Ca2+ transient along the length of a lane is accompanied by a decline in the velocity of the Ca2+ wave (Fig. 4 C). This velocity beyond 300 μm, when normalized to the value near the site of initiation, was 0.28 ± 0.06, which is not significantly different from the amplitude of ΔF/F, normalized to its value near the site of initiation, at 300 μm of 0.37 ± 0.10 (P > 0.25). The average amplitude of peak Ca2+ in those cells that give rise to a Ca2+ transient increases with the number of such cells per 1000 μm2 of lane, although the variance increases markedly for larger Ca2+ amplitude (Fig. 4 D). The variance/mean at <1 cell/1000 μm2 is 0.19 compared with that at >2 cells/1000 μm2 of 0.49. This reflects the large variance observed in the amplitude of Ca2+ near the site of initiation of the wave.
FIGURE 4.

Quantitative characteristics of the Ca2+ wave for a number of astrocyte lanes. (A) The average peak amplitude of Ca2+ declines along the lanes for the first 270 μm and is then maintained at a constant level (values normalized to the peak Ca2+ at the stimulating electrode). (B) The number of astrocytes that give a Ca2+ response at different positions along the length of a lane, expressed as a percentage of the total number of Ca2+-indicator-labeled astrocytes at that position, declines along lanes for the first 270 μm and is then maintained. (C) The average velocity of the Ca2+ wave declines over 270 μm and is then maintained (values normalized to peak Ca2+ wave velocity). (D) The average amplitude of the peak Ca2+ in equal-width segments of an astrocyte lane increases with the number of astrocytes that propagate a Ca2+ wave in the segment. Results in A–D are for six different lanes in six different cultures. In panels A and B, the distance is from equal-width segments along a lane (for which the average peak Ca2+ was calculated for all astrocytes in the segment) to the site of mechanical initiation of the Ca2+ wave.
Modeling the quantitative characteristics of Ca2+ wave propagation
The model of purinergic transmission of the Ca2+ wave given in Methods was used to give a quantitative description of the characteristics of Ca2+ wave propagation for comparison with the experimental results. A lane of astrocytes five-cells wide and 1000-μm long was considered in which the center-to-center distance between the astrocytes is 50 μm. The whole lane of astrocytes was placed on a two-dimensional surface 1000 μm × 1000 μm in an infinite volume (Fig. 5). Each row of five cells possessed KR values assigned by random permutation of the values 25, 50, 75, 100, and 125 μM. Note that these are effective KR values that take into account other properties besides dissociation of ATP from P2Y receptors (such as the density of receptors; see Theory above). Activation of an astrocyte in the center of the lane, by increasing the ATP concentration around the cell to 80 μM for 5 s, generated a propagating ATP wave that had not reached the end of the lane by 30 s after initiation, as shown in Fig. 5 A. The corresponding Ca2+ wave varied in amplitude and velocity both across the width of the lane and along its length (Fig. 5 B).
FIGURE 5.

Diagrammatic representation of the theoretical spatial and temporal changes in ATP and in Ca2+ in a lane of astrocytes five-cells wide after excitation of the central astrocyte. Initiation is by a 5-s pulse of ATP of concentration 80-μM at the central astrocyte, applied at time t = 0 s. The vertical bars give ATP (A) and Ca2+ (B) in μM at times t = 7.5, 15, 22.5, and 30 s, as indicated. (The ATP concentration in panel A at 7.5 s has been truncated to fit on the same scales as the other graphs.) Values of KR range from 25 μM to 125 μM for different astrocytes across the lane.
A quantitative analysis of Ca2+ wave propagation in a lane such as that shown in Fig. 5 B gives the results summarized in Fig. 6. The peak amplitude of Ca2+ in each astrocyte of the lane varied significantly both along the length and across the width of the lane (Fig. 6 A). Normalizing the Ca2+ to the largest amplitude observed at the site of initiation shows that many of the cells give a Ca2+ amplitude that is <15% of the largest one (Fig. 6 A). Using this as a cutoff for the ΔF/F value that would be observable experimentally (see Methods) gives a rate of decline of Ca2+ with distance similar to that observed, namely to between 15 and 40% over 300 μm (compare Fig. 6 A with Fig. 4 A). The percentage of cells that give a Ca2+ amplitude >15% of the largest amplitude at the site of initiation, for different rows of five cells along the length of the lane, declines as shown in Fig. 6 B to reach a value of ∼40% at 350 μm from the site of Ca2+ wave initiation and then remains steady, with fluctuations. (Fig. 6 B appears to show a further decline after 500 μm, but other runs with different permutations of the KR values show that this is a fluctuation.) This is a similar rate of decline of the percentage of active cells along the lane as that observed experimentally (compare with Fig. 4 B).
FIGURE 6.

Theoretical characteristics of a Ca2+ wave in an astrocyte lane, according to the mathematical model as in Fig. 5 B, for quantitative comparison with the observed characteristics (see Fig. 4). (A) The predicted peak amplitude of Ca2+ for all cells in a lane, normalized to that at the site of stimulation, declines with distance along the length of the lane over about the first 270-μm and is then maintained (compare with Fig. 4 A); horizontal line, values of the Ca2+ amplitude below which experimental detection is in the noise level (set at 15%). (B) The predicted number of astrocytes that give a Ca2+ response >15% of the maximum value, at different positions along the length of a lane, expressed as a percentage of the total number of cells at that position; this declines along the length of the lane over ∼270 μm until it reaches a steady state, with fluctuations (compare with Fig. 4 B). (C) The predicted average Ca2+, averaged across each row in a lane, declines over 270 μm and is then maintained (values normalized to peak Ca2+ velocity; compare with Fig. 4 C). (D) The predicted amplitude of the average peak Ca2+ in rows of an astrocyte lane increases with the number of astrocytes that propagate a Ca2+ wave in the row (compare with Fig. 4 D). All values are from the data generated by the model results shown diagramatically in Fig. 5 B.
The average amplitude of the peak Ca2+ across rows of cells increases with the number of cells that are activated in a row, with the variance of this relationship increasing markedly with an increase in the number of activated cells (Fig. 6 D). This is also observed experimentally (compare Fig. 6 D with Fig. 4 D). Finally, the velocity of propagation between rows of cells along the lane, calculated as the difference between the average of the times to reach peak Ca2+ amplitude in one row and that in the next row, divided into the distance apart of the rows (50 μm), indicated that the rate of decline of the velocity along the lane (Fig. 6 C) was similar to that observed experimentally (Fig. 4 C): both declined to a steady-state velocity of ∼30% of the peak velocity by 300 μm from the point of initiation of the Ca2+ wave. The peak velocity of the theoretical wave was 25 μm s−1 at the point of initiation, which is comparable to the average peak velocity of Ca2+ observed experimentally of 30 μm s−1.
Density of P2Y receptors on astrocytes
We next sought to determine if the theoretical requirement for KR taking values from 25 to 125 μM was reflected in different densities of P2Y receptors on the astrocytes, given that in our theory KR depends on this density as well as dissociation of ATP from the receptors (see Theory, above). Polyclonal antibody labeling of P2Y1 (Fig. 7, upper-left panel) and P2Y2 (Fig. 7, upper-right panel) showed that these receptors were localized in small clusters. The P2Y2 clusters ranged in size from 0.4- to 1.0-μm diameter—the same as that previously determined by us using antibodies as well as GFP.P2Y2 chimeras (see Fig. 3 in (26)). The density of each receptor type over five astrocytes varied approximately fivefold (Fig. 7, lower panel). Given that the present model is based on KR values varying over a fivefold range, it may be that this is primarily due to differences in P2Y receptor density over astrocytes.
FIGURE 7.

Density of P2Y receptors on astrocytes. (Upper panels) Distribution of anti-P2Y1 (left) and anti-P2Y2 (right) receptor immunofluorescence on single spinal-cord astrocytes in lanes. (Lower panel) Histogram of the density of anti-P2Y1 labeled receptors (dark bars) and anti-P2Y2 labeled receptors (light bars) for five different astrocytes. The error bars indicate mean ± SE. At least 10 areas on each cell were used to determine the P2Y receptor density.
Ca2+ wave propagation along different patterns of astrocyte lanes
Astrocyte lanes of different patterns were constructed to test the spatial conditions under which ATP can diffuse and effectively set up a Ca2+ wave. We found in eight experiments that astrocyte lanes that were only 15 ± 3-μm wide could propagate a Ca2+ wave across cell-free lanes 67 ± 5-μm wide to adjacent and parallel astrocyte lanes. Fig. 8 A shows astrocyte lanes 35-μm wide separated by cell-free lanes 65-μm wide in which a Ca2+ wave propagated both along and between lanes from the site of initiation of the Ca2+ wave. Much wider astrocyte lanes (90 ± 5 μm) were able to propagate a Ca2+ wave across wider cell-free lanes (140 ± 5 μm) in six experiments (Fig. 8 B). However, a Ca2+ wave failed to propagate to parallel lanes of astrocytes if there was an intervening cell-free lane wider than 170 ± 10 μm in five experiments. The times taken for a Ca2+ wave to propagate across the width of a lane were comparable to those for propagation across cell-free lanes of the same width. Fig. 8, E and F, shows the times taken for such propagation for two different sets of lanes; the velocity of propagation varied between 5.0 μm s−1 and 9.3 μm s−1.
FIGURE 8.

Propagation of a Ca2+ wave occurs between astrocyte lanes if these are not separated by distances >∼140 μm. (A, B) Parallel lanes of astrocytes in which the lane widths are 35- and 90-μm, respectively, separated by cell-free lanes of 65- and 140-μm, respectively; (○) astrocytes that gave a Ca2+ response after mechanical excitation of the astrocyte indicated by the arrow. (C, D) Lanes of astrocytes that have been interrupted along their length by gaps of different lengths (73 μm in C and 170 μm in D); (○) astrocytes that responded with a Ca2+ transient when the astrocyte identified by the arrow was mechanically stimulated; in panel C, the Ca2+ wave propagated across the gap but in panel D it failed to cross the gap. Panels E and F give two different examples of the time taken for a Ca2+ wave to propagate across an astrocyte lane and then to parallel astrocyte lanes separated by cell-free lanes; continuous lines, propagation across a lane, and the broken lines for the delay period before a Ca2+ response was first observed on the edge of an adjacent lane. Calibration bar, for panels A–D, is 45 μm.
A further test of the diffusion distance at which ATP released from astrocytes can evoke Ca2+ transients was made by producing astrocyte lanes with cell-free gaps. The Ca2+ wave jumped such gaps in two experiments if these were <73 ± 11 μm long (Fig. 8 C) but a Ca2+ wave failed to propagate across gaps >170 ± 10 μm in eight experiments (Fig. 8 D). Parallel lanes of astrocytes separated by cell-free lanes wider that 170 μm but bridged by an astrocyte lane propagated Ca2+ waves throughout the system of lanes when initiated at a point, but did not jump cell-free regions (see Supplementary Material).
Modeling Ca2+ wave propagation along different patterns of astrocyte lanes
The model of purinergic transmission of Ca2+ waves was used to see if it could account for Ca2+ wave propagation along and between parallel lanes of astrocytes, such as those shown in Fig. 8 A. Fig. 9 shows the propagation of Ca2+ waves in three such parallel lanes of cells, separated by cell-free lanes 125-μm wide, after initiation of the Ca2+ wave in the middle row of the middle lane by applying 80 μM of ATP for 5 s at one edge. There is propagation of Ca2+ over 30% of the middle lane before the side lanes are engaged, at ∼15 s after application of the initiating stimulus (Fig. 9). Both side lanes first generate a Ca2+ wave, which is in cells in a row opposite or nearly opposite the row containing the initiating cell in the middle lane. By 45 s the crest of the Ca2+ wave has reached the ends of the middle lane, 500 μm from the site of initiation, by which time it has traveled <70% of that distance along the adjacent lanes (Fig. 9). A quantitative description of the propagation of the crest of the Ca2+ wave is given by the contour lines indicating the times to peak of Ca2+ in all three lanes (Fig. 10). Because the excited cell in the middle lane is at the extreme edge of a row, it is closer to one of the side lanes than to the other. This side lane then generates a Ca2+ wave some 20 s after that in the initiating cell, whereas the other side lane does not do so until 37 s after initiation. The velocity of propagation across both cell-free lanes is the same at 6.25 μm s−1, whereas that across the middle lane of cells is 11 μm s−1 and across the side lanes of cells is 7.1 μm s−1. These velocity values may be compared with those observed experimentally of 7.5 ± 1.6 μm s−1 in cell-free lanes and 6.3 ± 1.1 μm s−1 for astrocyte lanes (see Fig. 8, E and F). Varying the width of the astrocyte-free lanes showed that the velocity of propagation across the cell-free lanes was constant at 6.25 μm s−1, independent of the width of the cell lanes, or of the KR values of such cells or their maximum Ca2+ amplitude. On the other hand, the velocity of propagation within a cell lane was dependent on the KR values of cells in the lane.
FIGURE 9.

A diagrammatic representation of the theoretical spatial and temporal changes in Ca2+ in three lanes of astrocytes each five-cells wide, separated by cell-free lanes 125-μm wide, after excitation of a single astrocyte in the middle row of the middle lane. The calcium wave is initiated by a 5-s pulse of ATP of concentration 80-μM on the excited astrocyte at time t = 0. The vertical bars give Ca2+ in μM at times t = 7.5, 15, 22.5, 30, 37.5, 45, 52.5, and 60 s, as indicated. The KR values range from 25 μM to 125 μM for different astrocytes across each lane.
FIGURE 10.

Contour plots of the time-to-peak of the Ca2+ wave throughout the three lanes of astrocytes, as diagrammatically represented in Fig. 9, after initiation of the wave in the astrocyte marked by an asterisk (★). Each contour is labeled with the time (s) from initiation.
DISCUSSION
Decline of the amplitude and velocity of Ca2+ waves near the site of Ca2+ initiation
The amplitude and velocity of the Ca2+ wave, and the percentage of astrocytes excited to give a Ca2+ response, were correlated along the length of an astrocyte lane, both decreasing from near the site of initiation over a distance of ∼300 μm. Decreases in amplitude of Ca2+ from a site of mechanical initiation have often been observed in randomly seeded astrocytes over a homogeneous substrate (2,4,27). It has been suggested that this decrease might be related to the fact that, in the vicinity of a site of mechanical stimulation, the Ca2+ is primarily communicated via IP3 diffusion through gap junctions; this releases Ca2+ from the endoplasmic reticulum, thus giving rise to a relatively large amplitude and high velocity Ca2+ wave in this region. Such IP3 diffusion is taken to be limited in spatial extent, but able to give sufficient amounts of an extracellular messenger to generate smaller Ca2+ amplitudes downstream (28). We can reject this as an explanation in the present case, since blocking purinergic P2Y1 and P2Y2 receptors completely blocked any propagation of a Ca2+ wave from a mechanically stimulated spinal-cord astrocyte into surrounding astrocytes, indicating that ATP rather than gap junctions mediates transmission at the site of Ca2+ initiation (see also (29–31)). There is therefore no need to consider models in which the diffusion of IP3 through gap junctions is the dominant mechanism for junctional transmission between spinal cord astrocytes (32,33). Recently, a model of Ca2+ wave propagation in a sheet of astrocytes has been described that allows for junctional transmission between astrocytes to be carried out by different proportions of purine/pyrimidines and IP3 (34), but direct comparison with experimental observations was not made; also this model does not incorporate the regenerative release of ATP that in our case is essential for agreement with experiment. (In our case, with the initial conditions used in the calculations, pure diffusion of ATP would limit the extent of the Ca2+ wave to ∼125 μm.)
The purinergic transmission model suggests that this decline in amplitude and velocity of the Ca2+ wave was due to the relatively high level of ATP released from the stimulated astrocyte that then dominates the concentration profile of ATP within ∼300 μm. The decline in amplitude and velocity of the Ca2+ wave approximately follows this concentration gradient of ATP, so the decline in the percentage of astrocytes excited to give a Ca2+ response within this 300-μm range is then attributed to a failure of astrocytes possessing a relatively high KR to generate a Ca2+ response as the concentration of ATP declines over the same range. A Ca2+ wave can be initiated with much lower concentrations (≳2 μM) of ATP than the 80 μM used in the present calculation, but only those cells with a low KR respond and the change of amplitude with distance does not match the experimental results reported here.
Maintenance of Ca2+ wave propagation over long distances
The observation that a Ca2+ wave propagated for distances of >600 μm along lanes (the longest distance followed) albeit at low amplitude and velocity, is in contrast to the suggestion that the furthest extent of such propagation is ∼180–300 μm in cultures of randomly seeded astrocytes on homogeneous substrates (see Table 1 in (4); however, see also Fig. 6 C in (35)). The question arises as to the reason for such discrepancies. Our work shows that there can still be propagation of Ca2+ waves between parallel lanes of astrocytes when these are ∼20-μm wide and separated by cell-free lanes ∼150-μm wide, but this does not occur until many astrocytes in the initiating lane undergo a Ca2+ response. Although not measured in the present study, it is clear that a certain minimal amount of ATP must be released from the initiating lane, involving a certain minimal number of astrocytes undergoing a Ca2+ response, before nearby astrocyte lanes are excited. Such minimal amounts might not be generated throughout randomly seeded cultures. Alternatively, these cultures might contain sets of astrocytes that have quite different classes of P2Y receptors with high- and low-KR values that might determine preferred pathways for Ca2+ wave propagation. It is interesting in this regard to note that evidence has been provided that during Ca2+ wave propagation only a subset of astrocytes release ATP in two-dimensional cultures of these cells (35). According to the present model, these ATP-releasing astrocytes are those with low-KR P2Y receptors and/or high densities of such receptors.
Fluctuations in the amplitude and velocity of the Ca2+ wave due to changes in the local ATP concentration are consequential upon the changes in the local number of astrocytes excited. This in turn depends on the distribution of astrocytes in the region with either low or high effective KR values. The possibility that there are astrocytes that possess uniquely different classes of P2Y receptors has been established (36), but changes in density of P2Y receptors on cells has only recently been described (37,38). Here we have shown that the density of P2Y receptors on astrocytes in lanes is not uniform, but varies over at least a fivefold range as do the KR values in our model.
Propagation of Ca2+ waves in networks of astrocyte lanes
Repeated stimulation of the same astrocyte with two impulses separated by 10 min gave rise to Ca2+ responses in almost identical subsets of astrocytes. On the other hand, stimulation of two different astrocytes at 10-min intervals and some hundreds of microns apart gave a Ca2+ response in many different astrocytes after the second stimulus. In all cases, the density of astrocytes excited was greatest closest to the site of stimulation. Our model quantitatively explains these observations as arising from the large amount of ATP released by the stimulated astrocyte diffusing to activate astrocytes within 300 μm even if they have relatively high-KR P2Y receptors and a relatively low density of receptors. However, the amount of ATP released by astrocytes through autocrine/paracrine mechanisms is alone insufficient to excite astrocytes with high-KR P2Y receptors or with low densities of receptors. Thus, stimulating two different and well-spaced astrocytes in a lane will lead to unique activation of Ca2+ in astrocytes near the sites of stimulation, whereas further away only the low-KR P2Y receptor astrocytes, or those with high densities of receptors, will be activated and these will be evoked by both stimulations.
SUPPLEMENTARY MATERIAL
An online supplement to this article can be found by visiting BJ Online at http://www.biophysj.org.
Acknowledgments
This work was supported by Australian Research Council grant No. DP0345968.
References
- 1.Cornell-Bell, A. H., S. M. Finkbeiner, M. S. Cooper, and S. J. Smith. 1990. Glutamate induces calcium waves in cultured astrocytes: long-range glial signaling. Science. 247:470–473. [DOI] [PubMed] [Google Scholar]
- 2.Blomstrand, F., N. D. Aberg, P. S. Eriksson, E. Hansson, and L. Ronnback. 1999. Extent of intercellular calcium wave propagation is related to gap junction permeability and level of connexin-43 expression in astrocytes in primary cultures from four brain regions. Neuroscience. 92:255–265. [DOI] [PubMed] [Google Scholar]
- 3.Venance, L., N. Stella, J. Glowinski, and C. Giaume. 1997. Mechanism involved in initiation and propagation of receptor-induced intercellular calcium signaling in cultured rat astrocytes. J. Neurosci. 17:1981–1992. [DOI] [PMC free article] [PubMed] [Google Scholar]
- 4.Giaume, C., and L. Venance. 1998. Intercellular calcium signaling and gap junctional communication in astrocytes. Glia. 24:50–64. [PubMed] [Google Scholar]
- 5.Charles, A. C., J. E. Merrill, E. R. Dirksen, and M. J. Sanderson. 1991. Intercellular signaling in glial cells: calcium waves and oscillations in response to mechanical stimulation and glutamate. Neuron. 6:983–992. [DOI] [PubMed] [Google Scholar]
- 6.Charles, A. C., C. C. Naus, D. Zhu, G. M. Kidder, E. R. Dirksen, and M. J. Sanderson. 1992. Intercellular calcium signaling via gap junctions in glioma cells. J. Cell Biol. 118:195–201. [DOI] [PMC free article] [PubMed] [Google Scholar]
- 7.Finkbeiner, S. 1992. Calcium waves in astrocytes—filling in the gaps. Neuron. 8:1101–1118. [DOI] [PubMed] [Google Scholar]
- 8.Venance, L., D. Piomelli, J. Glowinski, and C. Giaume. 1995. Inhibition by anandamide of gap junctions and intercellular calcium signaling in striatal astrocytes. Nature. 376:590–595. [DOI] [PubMed] [Google Scholar]
- 9.Hassinger, T. D., P. B. Guthrie, P. B. Atkinson, M. V. Bennett, and S. B. Kater. 1996. An extracellular signaling component in propagation of astrocytic calcium waves. Proc. Natl. Acad. Sci. USA. 93:13268–13273. [DOI] [PMC free article] [PubMed] [Google Scholar]
- 10.Naus, C. C., J. F. Bechberger, Y. Zhang, L. Venance, H. Yamasaki, S. C. Juneja, G. M. Kidder, and C. Giaume. 1997. Altered gap junctional communication, intercellular signaling, and growth in cultured astrocytes deficient in connexin43. J. Neurosci. Res. 49:528–540. [DOI] [PubMed] [Google Scholar]
- 11.Zanotti, S., and A. Charles. 1997. Extracellular calcium sensing by glial cells: low extracellular calcium induces intracellular calcium release and intercellular signaling. J. Neurochem. 69:594–602. [DOI] [PubMed] [Google Scholar]
- 12.Wang, Z., P. G. Haydon, and E. S. Yeung. 2000. Direct observation of calcium-independent intercellular ATP signaling in astrocytes. Anal. Chem. 72:2001–2007. [DOI] [PubMed] [Google Scholar]
- 13.Venance, L., J. Cordier, M. Monge, B. Zalc, J. Glowinski, and C. Giaume. 1995. a. Homotypic and heterotypic coupling mediated by gap junctions during glial cell differentiation in vitro. Eur. J. Neurosci. 7:451–461. [DOI] [PubMed] [Google Scholar]
- 14.van den Pol, A. N., S. M. Finkbeiner, and A. H. Cornell-Bell. 1992. Calcium excitability and oscillations in suprachiasmatic nucleus neurons and glia in vitro. J. Neurosci. 12:2648–2664. [DOI] [PMC free article] [PubMed] [Google Scholar]
- 15.Dani, J. W., A. Chernjavsky, and S. J. Smith. 1992. Neuronal activity triggers calcium waves in hippocampal astrocyte networks. Neuron. 8:429–440. [DOI] [PubMed] [Google Scholar]
- 16.Takano, H., J. Y. Sul, M. L. Mazzanti, R. T. Doyle, P. G. Haydon, and M. D. Porter. 2002. Micropatterned substrates: approach to probing intercellular communication pathways. Anal. Chem. 74:4640–4646. [DOI] [PubMed] [Google Scholar]
- 17.Bennett, M. R., L. Farnell, and W. G. Gibson. 2005. A quantitative model of purinergic junctional transmission of calcium waves in astrocyte networks. Biophys. J. 89:2235–2250. [DOI] [PMC free article] [PubMed] [Google Scholar]
- 18.Scemes, E., S. O. Suadicani, and D. C. Spray. 2000. Intercellular communication in spinal cord astrocytes: fine tuning between gap junctions and P2 nucleotide receptors in calcium wave propagation. J. Neurosci. 20:1435–1445. [DOI] [PMC free article] [PubMed] [Google Scholar]
- 19.Cole, R., and J. de Vellis. 1997. Astrocyte and oligodendrocyte cultures. In Protocols for Neural Cell Cultures. S. Fedoroff, and A. Richardson, editors. Humana Press, New Jersey. 117–130.
- 20.Wiesinger, H., B. Schuricht, and B. Hamprecht. 1991. Replacement of glucose by sorbitol in growth medium causes selection of astroglial cells from heterogeneous primary cultures derived from newborn mouse brain. Brain Res. 550:69–76. [DOI] [PubMed] [Google Scholar]
- 21.Macleod, G. T., P. A. Dickens, and M. R. Bennett. 2001. Formation and function of synapses with respect to Schwann cells at the end of motor nerve terminal branches on mature amphibian (Bufo marinus) muscle. J. Neurosci. 21:2380–2392. [DOI] [PMC free article] [PubMed] [Google Scholar]
- 22.Recknor, J. B., J. C. Recknor, D. S. Sakaguchi, and S. K. Mallapragada. 2004. Oriented astroglial cell growth on micropatterned polystyrene substrates. Biomaterials. 25:2753–2767. [DOI] [PubMed] [Google Scholar]
- 23.Whitesides, G. M., E. Ostuni, S. Takayama, X. Jiang, and D. E. Ingber. 2001. Soft lithography in biology and biochemistry. Annu. Rev. Biomed. Eng. 3:335–373. [DOI] [PubMed] [Google Scholar]
- 24.Lemon, G., W. G. Gibson, and M. R. Bennett. 2003. Metabotropic receptor activation, desensitization and sequestration. I. Modelling calcium and inositol 1,4,5-trisphosphate dynamics following receptor activation. J. Theor. Biol. 223:93–111. [DOI] [PubMed] [Google Scholar]
- 25.Newman, E. A. 2001. Propagation of intercellular calcium waves in retinal astrocytes and Müller cells. J. Neurosci. 21:2215–2223. [DOI] [PMC free article] [PubMed] [Google Scholar]
- 26.Lemon, G., J. Brockhausen, G.-H. Li, W. G. Gibson, and M. R. Bennett. 2005. Calcium mobilization and spontaneous transient outward current characteristics upon agonist activation of P2Y2 receptors in smooth muscle cells. Biophys. J. 88:1507–1523. [DOI] [PMC free article] [PubMed] [Google Scholar]
- 27.Suadicani, S. O., M. H. D. Pina-Benabou, M. Urban-Maldonado, D. C. Spray, and E. Scemes. 2003. Acute downregulation of Cx43 alters P2Y receptor expression levels in mouse spinal cord astrocytes. Glia. 42:160–171. [DOI] [PMC free article] [PubMed] [Google Scholar]
- 28.Charles, A. 1998. Intercellular calcium waves in glia. Glia. 24:39–49. [DOI] [PubMed] [Google Scholar]
- 29.Gallagher, C. J., and M. W. Salter. 2003. Differential properties of astrocyte calcium waves mediated by P2Y1 and P2Y2 receptors. J. Neurosci. 23:6728–6739. [DOI] [PMC free article] [PubMed] [Google Scholar]
- 30.Salter, M. W., and J. L. Hicks. 1994. ATP-evoked increases in intracellular calcium in neurons and glia from the dorsal spinal cord. J. Neurosci. 14:1563–1575. [DOI] [PMC free article] [PubMed] [Google Scholar]
- 31.Fam, S. R., C. J. Gallagher, and M. W. Salter. 2000. P2Y1 purinoceptor-mediated Ca2+ signaling and Ca2+ wave propagation in dorsal spinal cord astrocytes. J. Neurosci. 20:2800–2808. [DOI] [PMC free article] [PubMed] [Google Scholar]
- 32.Sneyd, J., M. Wilkins, A. Strahonja, and M. J. Sanderson. 1998. Calcium waves and oscillations driven by an intercellular gradient of inositol (1,4,5)-trisphosphate. Biophys. Chem. 72:101–119. [DOI] [PubMed] [Google Scholar]
- 33.Hofer, T., L. Venance, and C. Giaume. 2002. Control and plasticity of intercellular calcium waves in astrocytes: a modeling approach. J. Neurosci. 22:4850–4859. [DOI] [PMC free article] [PubMed] [Google Scholar]
- 34.Iacobas, D. A., S. O. Suadicani, D. C. Spray, and E. Scemes. 2006. A stochastic two-dimensional model of intercellular Ca2+ wave spread in glia. Biophys. J. 90:24–41. [DOI] [PMC free article] [PubMed] [Google Scholar]
- 35.Arcuino, G., J. H. Lin, T. Takano, C. Liu, L. Jiang, Q. Gao, J. Kang, and M. Nedergaard. 2002. Intercellular calcium signaling mediated by point-source burst release of ATP. Proc. Natl. Acad. Sci. USA. 99:9840–9985. [DOI] [PMC free article] [PubMed] [Google Scholar]
- 36.Ho, C., J. Hicks, and M. W. Salter. 1995. A novel P2-purinoceptor expressed by a subpopulation of astrocytes from the dorsal spinal cord of the rat. Br. J. Pharmacol. 116:2909–2918. [DOI] [PMC free article] [PubMed] [Google Scholar]
- 37.Szucs, A., H. Szappanos, A. Toth, Z. Farkas, G. Panyi, L. Csernoch, and I. Sziklai. 2004. Differential expression of purinergic receptor subtypes in the outer hair cells of the guinea pig. Hear. Res. 196:2–7. [DOI] [PubMed] [Google Scholar]
- 38.Tsim, K. W., and E. A. Barnard. 2002. The signaling pathways mediated by P2Y nucleotide receptors in the formation and maintenance of the skeletal neuromuscular junction. Neurosignals. 11:58–64. [DOI] [PubMed] [Google Scholar]