

Abstract
Total internal reflection fluorescence correlation spectroscopy (TIR-FCS) allows us to measure diffusion constants and the number of fluorescent molecules in a small area of an evanescent field generated on the objective of a microscope. The application of TIR-FCS makes possible the characterization of reversible association and dissociation rates between fluorescent ligands and their receptors in supported phospholipid bilayers. Here, for the first time, we extend TIR-FCS to a cellular application for measuring the lateral diffusion of a membrane-binding fluorescent protein, farnesylated EGFP, on the plasma membranes of cultured HeLa and COS7 cells. We detected two kinds of diffusional motion—fast three-dimensional diffusion (D1) and much slower two-dimensional diffusion (D2), simultaneously. Conventional FCS and single-molecule tracking confirmed that D1 was free diffusion of farnesylated EGFP close to the plasma membrane in cytosol and D2 was lateral diffusion in the plasma membrane. These results suggest that TIR-FCS is a powerful technique to monitor movement of membrane-localized molecules and membrane dynamics in living cells.
INTRODUCTION
Fluorescence correlation spectroscopy (FCS) monitors the fluctuations in fluorescence intensity caused by fluorophores diffusing freely in a small observation volume. The measured fluctuation signals are converted to diffusion constants and the absolute number of fluorescently labeled particles at the single-molecule level (1). FCS has been used as a powerful tool for characterizing the dynamic behavior and kinetic properties of biochemical reactions in vitro (2–6) and in vivo (7–13).
Intracellular signaling pathways are triggered by the binding of a ligand to its receptor, stimulation, stress, etc., on the cell surface to regulate cell activities (proliferation, differentiation, apoptosis, etc.). Hence, elucidation of the molecular interactions on the plasma membrane is required for understanding of cellular functions and is expected to be useful for the discovery of drug targets as well. Growing numbers of FCS studies at the single-molecule level have revealed the kinetic properties of biomolecular interactions in subcellular organelles in living cells (7–12). However, with confocal optics-based FCS, there are some difficulties in measuring molecular diffusion on the plasma membrane because of the relatively low spatial resolution along the optical axis and the very large scattering of background light at the coverslip. To improve this, we combined FCS with objective-lens type total internal reflection fluorescence microscopy (TIR-FM). For excitation light, objective-lens type TIR-FM generates an evanescent field, using a totally internally reflected laser beam after it passes through the objective (14). The depth of the evanescent field is very thin (100∼200 nm). Therefore, the field excites only fluorophores near the surface. The narrow excitation achieved by the evanescent field allows visualization of molecular dynamics at the plasma membrane without interference from fluctuations in cytosol (15). FCS combined with TIR-FM, i.e., TIR-FCS (16), has developed into a useful method to quantitatively study ligand-receptor associations and kinetics on a supported membrane (17,18). However, there has been no report on the application of TIR-FCS to cell biology.
Herein, for the first time, we report cellular application of TIR-FCS for measuring lateral diffusion of membrane-binding proteins, carried out as a feasibility study for the development of TIR-FCS. The TIR-FCS setup is constructed with an FCS detector unit and objective-type TIR-FM (Fig. 1) (19,20). By using TIR-FCS, we observed lateral diffusion of membrane binding proteins, i.e., the enhanced green fluorescent protein (EGFP)-fused farnesylated domain (EGFP-F) in the plasma membrane facing the coverslip in HeLa cells and COS7 cells. Conventional FCS and single-molecule tracking (SMT) using a charge-coupled device camera were carried out to assess the obtained TIR-FCS data.
FIGURE 1.

Schematic diagram of objective-type TIR-FCS setup for cellular application. Total internal reflection (TIR) illumination, achieved by objective-lens type TIR-FM, produces an evanescent field. Cultured cells are illuminated by the evanescent field near the glass surface. Fluorescence signals are focused into an optical fiber (φ50 μm) and collected by an Avalanche photodiode (APD). The fluorescence autocorrelation function is calculated by a digital correlator.
MATERIALS AND METHODS
Sample preparation
EGFPs were prepared using a wheat-germ extract (cell-free) translation system (21). Glass chambers (384-well glass-bottom plate, Olympus, Tokyo, Japan) for in vitro TIR-FCS experiments were treated with a blocking reagent (N101, NOF, Tokyo, Japan) to prevent nonspecific adsorption of EGFPs.
Cells were cultured in a 5% CO2 humidified atmosphere at 37°C in Dulbecco's modified Eagle's medium (DMEM) supplemented with 10% fetal bovine serum, 2 × 10⁵ U/L penicillin G, and 200 mg/L streptomycin sulfate. For microscopy the cells were grown on glass-base dishes (φ12 mm, Asahi Technoglass, Chiba, Japan).
Octadecyl rhodamine B chloride (R18) was purchased from Molecular Probes (Eugene, OR). For R18 labeling, COS7 cells were incubated with 2 ml of DMEM and 100 μl of R18 (1 μM) on poly-L-lysine-coated glass-base dishes 5 h before TIR-FCS measurement. Before the experiments, COS7 cells were washed five times with PBS.
Cells were transfected with 1.0 μg of plasmid DNA of pEGFP-C1 or pEGFP-F (Clontech, Palo Alto, CA) (note that although these products are now commercially unavailable, the vector information is provided as a courtesy on the company's website, http://www.clontech.com/clontech/) and 3.0 μl of FuGENE6 (Roche Molecular Biochemicals, Mannheim, Germany) per glass-base dish 15 h before TIR-FCS measurement or single-molecule imaging. During microscopic observation, cells were maintained in phenol red-free DMEM/F-12 (Invitrogen, Carlsbad, CA) at room temperature.
TIR-FCS setup and measurement
The TIR-FCS setup was constructed with an inverted microscope (TE2000, Nikon, Kanagawa, Japan), observation unit for TIR illumination (Nikon), a multimode fiber with a φ50 μm-diameter core, an avalanche photodiode (SPCM-AQ-141-FC, EG&G, Vaudreuil, Quebec, Canada), and a digital correlator (ALV 5000/E, ALV, Langen, Germany). The objective-type TIR-FM was equipped with a ×100 oil-immersion objective (Plan Apo, NA = 1.45, Nikon). The samples were excited at the 488-nm laser line of a semiconductor laser (488-20CDRH, Coherent, CA), and fluorescence signals were detected through a dichroic mirror (>505 nm) and a bandpass filter (510–560 nm) for EGFP and a longpass filter (>520 nm) for R18.
Determination of TIR-FCS observation volume
Fluorescence autocorrelation functions (FAFs), G(τ), were acquired online with a digital correlator and fitted by a one-component model (17,19,20) for the control experiments on fluorescein in 10 mM Tris buffer (pH 8.0) to determine the structure parameter defined by ω = h/ωxy (20). The values h and ωxy are the height and radius of the TIR-FCS detection volume, respectively.
 |
(1) |
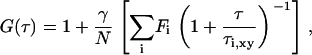
where the value N is the average number of fluorescent particles in an effective volume. The value γ is a correction factor, describing the deviation of the effective volume. Here, we used the value γ = 1/3.4 according to previous research (20). The value p is the average fraction of molecules that are in the triplet state in the effective volume. The value τt is the triplet state decay time. The axial diffusion time is given by τz = h2/4D. The value D denotes the diffusion constant and w is the complex generalization of the error function, w(x) ≡ exp(−x2) erfc(−ix).
To estimate the size of the observation volume, we determined the value of h from the relation h = (4Dτz)1/2, using the diffusion constant of fluorescein (D = 3.0 × 10⁻⁶ cm2/s (20)) and the average value of τz obtained by fitting. In the case of cellular measurements, we used the same values of ω, h, and ωxy as for in vitro experiments.
Analysis of TIR-FCS data
Fitting analyses of FAFs were carried out to yield the diffusion constants, where the value of ω was fixed, based on 10 measurements from control experiments on fluorescein. For R18-labeled COS7 cells, a model of two-dimensional diffusion (Eq. 2) was employed to fit the data (22),
 |
(2) |
where Fi is the fraction of fluorophores laterally diffusing on the surface. The lateral diffusion time for two-dimensionally diffusing fluorophores on the plasma membrane is given by 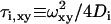 (i = 1, 2).
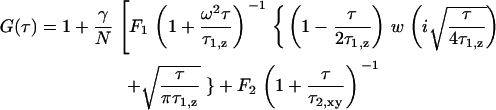
The fitting model for experiments of EGFP-F expressed in cells, in which fluorescence fluctuations resulting from both faster free diffusion through the evanescent field and slower lateral diffusion parallel to the surface, was applied to a two-component model containing the terms of the two-dimensional model:
 |
(3) |
The value τ1,z is the axial diffusion time of three-dimensionally diffusing fluorophores near the plasma membrane in cytosol. In fact, we used a model function containing a term accounting for triplet state kinetics as described in previous works (19,20).
Confocal FCS and single-molecule tracking
Confocal FCS measurements were carried out with a ConfoCor 2 (Carl Zeiss, Jena, Germany) (11). Single-molecule tracking was performed using a TIR fluorescence microscope equipped with a cooled charge-coupled device camera (Cascade 650, Photometrics, Tucson, AZ) and an image intensifier (C8600-03, Hamamatsu Photonics, Hamamatsu, Japan). The single fluorescent molecules were tracked for 0.67 ∼ 2 s (20∼60 frames) using imaging software (Meta Morph, Universal Imaging, Downingtown, PA). The single-molecule trajectories were analyzed with mean-square displacement (MSD) given by 〈r2〉 = 4Dτ. The two-dimensional MSD, 〈r2〉, was calculated for each particle, where r denotes the displacement of the fluorescent particle during each time interval, τ indicates multiples of 33.3 ms, and 〈…〉 denotes the average over the tracking duration (23,24).
RESULTS
TIR-FCS in vitro experiments
We first carried out TIR-FCS measurements of fluorescein in Tris-buffered solution (10 mM, pH 8.0), in control experiments to determine the TIR-FCS observation volume. Fluorescence fluctuation of fluorescein diffusing near the glass surface in aqueous solution was detected by TIR-FCS (Fig. 2 a). The best fitting of the autocorrelation functions by Eq. 1 yielded the average value of structure parameter ω = 0.16 and axial diffusion time τz = 3.1 μs. Therefore, h was estimated to be 61 nm and ωxy = 381 nm.
FIGURE 2.

Autocorrelation function of TIR-FCS control experiments. Control measurements were carried out on samples. (a) 300 nM fluorescein in 10 mM Tris (pH 8.0). Fitting analysis with Eq. 1 yielded N = 10.4, p = 44%, τt = 0.3 μs, τz = 2.7 μs, and ω = 0.15. (b) EGFP in 10 mM Tris (pH 8.0) near the glass surface with (•) and without (○) blocking treatment. The best fit of the data (•) to Eq. 1 gave N = 0.6, τt = 0.2 μs, p = 78%, and τz = 16 μs. The structure parameter ω was fixed to 0.16.
As the next step, EGFP diffusing near the glass surface in Tris buffer was measured using TIR-FCS (Fig. 2 b). With the blocking reagent treatment (see Materials and Methods) only free diffusion of EGFP in the buffer solution was measured by TIR-FCS (Fig. 2 b, solid circles). On the other hand, when the glass chamber was not treated, nonspecific binding of EGFPs to the glass surface gave a long-time component of autocorrelation (Fig. 2 b, open circles). The overall background signal for the negative control with the blocking reagent was ∼4.0 kcps (103 counts/second). The blocking reagent exhibited weak fluorescence but gave no autocorrelation function. The fitting analyses with Eq. 1, where ω = 0.16 was fixed, yielded diffusion constants of EGFP in Tris buffer (D = 6.9 × 10⁻⁷ cm2/s, Table 1). This value agreed well with the predicted value calculated from the cube root of fluorescein and the EGFP molecular weight ratio, according to the Stokes-Einstein equation, and was almost the same as that obtained using conventional FCS (7.8 × 10⁻⁷ cm2/s, (25)). Fig. 2 b shows that the average signal 〈S〉 was 10.2 kcps, and the average background intensity 〈B〉 was 3.8 kcps. Fitting gave the number of fluorophores N = 0.6. The background-corrected values (26) of N and cpm were 0.2 and 27.8 kcps, respectively. Therefore, these results demonstrated that the TIR-FCS system was successfully set up.
TABLE 1.
TIR-FCS of EGFP in solution and living cells
| EGFP | ω | D (cm2/s) | n |
|---|---|---|---|
| In Tris buffer | 0.16 | 6.9 ± 0.9 × 10⁻⁷ | 10 |
| 0.18 | 7.2 ± 0.7 × 10⁻⁷ | 10 | |
| In HeLa cells | 0.16 | ND | |
| 0.18 | 2.7 ± 1.0 × 10⁻⁷ | 23 |
Average diffusion constants (D) of EGFP in Tris buffer (pH 8.0) and HeLa cells measured using TIR-FCS. Structure parameter ω was fixed, based on the fitting results of fluorescein measurements. The value n is the number of measurements. ND, not determined. Means ± SD.
TIR-FCS of EGFP in cytosol of HeLa cells
We also tried to measure EGFP diffusion in cytosol of HeLa cells using TIR-FCS. First, we carried out experiments with the same incident angle of the laser beam near θmax (≈72°) as in the control experiments above, which resulted in a small evanescent field. However, no clear correlation curve was obtained (data not shown).
To gain stronger fluorescent signals, HeLa cells were illuminated with a deeper evanescent field (θ < 70°), then correlation curves were observed (Fig. 3). Because of fast photobleaching, we could collect fluorescent signals from HeLa cells for only 10 s. Therefore, the ratio of signal/noise (S/N) was lower than for in vitro experiments. The background autofluorescence level of HeLa cells was ∼5.0 kcps. With the same incident-angle of the laser, fluorescein in Tris-buffer solution was measured, and the fitting of the data gave ω = 0.18. EGFP in solution was also measured in the same way (Fig. 3). By fitting of the FAFs with Eq. 1, where ω was fixed at 0.18, the average diffusion constants of EGFP were calculated to be 7.2 ± 1.0 × 10⁻⁷ cm2/s in solution and 2.7 ± 1.0 × 10⁻⁷ cm2/s in HeLa cells (Table 1). The values agreed well with previous research using confocal FCS measurement (solution: 7.8 × 10⁻⁷ cm2/s, HeLa: 2.4 × 10⁻⁷ cm2/s (25)). In comparison between the EGFP diffusion constants in aqueous solution and HeLa cells, the ratio (∼2.7) reflects the difference of viscosity in Tris-buffer solution and cytosol of living cells (Table 1). These results showed the feasibility of using TIR-FCS to measure diffusion constants of molecules in living cells.
FIGURE 3.

Autocorrelation functions of EGFP in aqueous solution and in cytosol of HeLa cells using TIR-FCS. Representative normalized autocorrelation functions of EGFP in Tris buffer solution (pH 8.0) (red cross) and in cytosol of HeLa cells (blue circle). Diffusion constants were given as 8.2 × 10⁻⁷ cm2/s in solution and 1.6 × 10⁻⁷ cm2/s in a HeLa cell by fitting.
TIR-FCS of fluorescent lipophilic probes in cell membranes
To apply TIR-FCS to membrane-localized molecules in living cells, the fluorescent lipophilic probe, R18, which binds to the membrane, was observed by TIR-FCS in the plasma membrane of COS7 cells. The autocorrelation function for R18 in COS7 cellular membranes is shown in Fig. 4 (black line). The data were fitted well by a two-component model of two-dimensional diffusion (blue line), but not by a one-component model (red line). The fitting results yielded faster diffusion constants 5.7 ± 8.6 × 10⁻⁷ cm2/s (40 ± 16%) and slower diffusion constants 6.2 ± 3.7 × 10⁻⁹ cm2/s (60 ± 16%). Confocal FCS measurements were also carried out to confirm that there was not only one normal diffusive (lateral) motion but also a faster component of R18 on the cell membrane (Supplementary Material, Fig. S1). These results demonstrated that TIR-FCS was applicable for monitoring lateral diffusion of molecules on the cell membrane.
FIGURE 4.

Autocorrelation function of R18 in cell membranes of living COS7 cells using TIR-FCS. Autocorrelation function of R18 in the cell membrane (black line) and fitting curves of one-component model (red line, Eq. 2, i = 1) and two-component model (blue line, Eq. 2, i = 2). The fit residues are shown in the bottom panel.
TIR-FCS of membrane binding protein in living cells
TIR-FCS was employed for observation of lateral diffusion of membrane-binding farnesylated EGFP (EGFP-F) in living cells. At its C-terminal 20-amino-acid region, EGFP-F contains a membrane-anchor domain from H-Ras (Fig. 5 a) (27,28). After modification of the domain by farnesylation and palmitoylation, the EGFP-F was located in the inner leaflet of the plasma membrane. Fig. 5 b shows that most EGFP-F was anchored in the plasma membrane; however, weak signals from cytosol were presumed to represent EGFP-F without fatty acid modification for membrane-anchorage.
FIGURE 5.

TIR-FCS measurements of HeLa cells expressing EGFP-F. (a) Schematic diagram of EGFP-F. EGFP-F are anchored in the inner surface of the plasma membrane by one farnesylation and two palmitoylations at its C-terminal region. (b) LSM image of HeLa cells expressing EGFP-F. Bar represents 20 μm. (c) TIR-FM image of an HeLa cell expressing EGFP-F. Arrow and small circle indicate TIR-FCS observation area. Bar represents 5 μm. (d) The black line shows the autocorrelation function acquired by TIR-FCS of EGFP-F and the red line shows the fitting curve. (Inset) Time course of the fluorescence intensities. The bottom panel shows the fit residue. (e) Distribution analysis of diffusion constants. Dispersion plots of diffusion constants and their fractions from TIR-FCS of EGFP-F.
To reduce background signals from cytosol and photobleaching, an evanescent field as thin as possible was formed by adjusting the incident angle of the excitation laser beam to 72°, close to the maximum angle allowed by the numerical aperture of the objective (NA = 1.45), for total internal reflection. By such fine-tuning we could collect fluorescence signals from small areas of plasma membranes of HeLa cells transiently expressing EGFP-F (Fig. 5 c). When the cells were initially illuminated by the evanescent field for 90 s, the fluorescence intensity at the plasma membrane decreased to ∼70% because of photobleaching. Thus, after the photobleaching we observed the fluorescence fluctuation using TIR-FCS. The obtained FAFs fit very well with the 3D2D two-component model (Eq. 3), using the fixed value of ω = 0.16 (Fig. 5 d). We detected two kinds of diffusional motion: fast diffusion (D1 = 1.1 ± 0.3 × 10⁻⁷ cm2/s, F1 = 72%) derived from the three-dimensional term of the fitting model, and much slower diffusion (D2 = 5.6 ± 2.2 × 10⁻⁹ cm2/s, F2 = 28%) from the two-dimensional term (Fig. 5 e). D1 was presumed to express freely-diffusing EGFP-F near the plasma membrane in cytosol. Then confocal FCS was carried out to detect EGFP-F randomly moving in cytosol (three-dimensional model) and to measure its diffusion constant (D1 = 2.7 ± 1.0 × 10⁻⁷ cm2/s, F1 = 59%, Table 2).
TABLE 2.
Comparison of TIR-FCS with other methods
| Fast
|
Slow
|
||||
|---|---|---|---|---|---|
| Method | D1 (cm2/s) | F1 (%) | D2 (cm2/s) | F2 (%) | n |
| TIR-FCS | 1.1 ± 0.3 × 10⁻⁷ | 72 ± 11 | 5.6 ± 2.2 × 10⁻⁹ | 28 ± 11 | 23 |
| SMT | ND | 4.7 ± 4.6 × 10⁻⁹ | 100 | 127 | |
| Confocal FCS | 2.7 ± 1.0 × 10⁻⁷ | 59 ± 14 | 7.0 ± 8.6 × 10⁻⁹ | 41 ± 14 | 42 |
Average diffusion constants (D), fraction (F) of EGFP-F expressed in HeLa cells measured using TIR-FCS, single-molecule tracking (SMT) and confocal FCS. The value n is the number of measurements (FCS) or EGFP-F molecules (SMT). ND, not determined. Means ± SD.
Single-molecule tracking of EGFP-F
We employed single-molecule tracking analysis to measure the diffusion constants of membrane-anchor EGFP-F. EGFP-F fluorescent signals were visualized as small spots (Fig. 6 a). The EGFP-F spots exhibited single-step photobleaching (Fig. 6 b), and the distribution of the fluorescence intensity of individual spots showed a Gaussian-like shape (data not shown). These aspects showed that visualization with single-molecule sensitivity was achieved. Some spots had almost double the intensity of single EGFP-F molecules because of the tendency for EGFP to dimerize. Lateral movements of single fluorescent particles were traced and the obtained trajectories are shown in Fig. 5 c. The mean-square displacement (MSD), 〈r2〉, was plotted against the time lag to calculate the diffusion constants of EGFP-F spots. The average diffusion constant was obtained as 4.7 ± 4.6 × 10⁻⁹ cm2/s (Fig. 6 d).
FIGURE 6.

Single-molecule tracking of EGFP-F on plasma membrane. (a) Single fluorescent molecule images of EGFP-F expressed in HeLa cells. Bar represents 5 μm (left). Enlarged image of area surrounded by red rectangle. The fluorescence intensity is viewed in pseudocolor. Single molecules (single arrowheads) and a dimer (double arrowheads) of EGFP-F are shown. Bar represents 1 μm (right). (b) Time course of fluorescent intensity of EGFP-F spot. (c) Representative trajectories of EGFP-F moving with small (red) and typical (black) diffusion constants on the plasma membrane. Bar represents 1 μm. (d) Histogram of diffusion constants of EGFP-F spots measured by single-molecule tracking.
TIR-FCS with a series of laser power
Generally, FCS may not be appropriate for monitoring slow diffusional motion such as lateral diffusion of membrane-binding molecules because of the high possibility of photobleaching artifacts. The problem is that photobleaching may result in a faster apparent diffusion time than the real one. When fluorescent molecules diffuse slowly they are likely to be bleached in the detection volume before they pass through it. Therefore, it is necessary to demonstrate that diffusion constants obtained by TIR-FCS really represent diffusional mobility rather than photobleaching dynamics. By using TIR-FCS, we observed EGFP-F in COS7 cells with a series of excitation laser power densities: 1.0, 0.5, and 0.25 μW/μm2 (Fig. 7, a–c). These laser power densities were measured through the objective (θ = 0°, epi-illumination). The laser power at the maximum was 1.0 μW/μm2 in our TIR-FCS system. We were not able to obtain a clear autocorrelation function below 0.25 μW/μm2. Each autocorrelation function was fitted with Eq. 3 as well as Fig. 5. There were differences in the fluorescence intensities (inset) and S/N ratios of the autocorrelation curves among the data for the three different laser powers. On the other hand, the diffusion constants of slow components (D2) were almost the same (Table 3). We also carried out confocal FCS of EGFP-F in COS7 cells (n = 47 measurements). The results were D1 = 3.0 ± 1.8 × 10⁻⁷ cm2/s, F1 = 50 ± 18%, D2 = 5.9 ± 2.6 × 10⁻⁹ cm2/s, and F2 = 50 ± 18%.
FIGURE 7.

Autocorrelation functions of EGFP-F expressed in living COS7 cells with a series of laser powers. Autocorrelation functions of EGFP-F in COS7 cells by using a series of laser powers: 1.0, 0.5, and 0.25 μW/μm2 are shown in a, b, and c, respectively. Autocorrelation functions (black line) were fitted with Eq. 3 (red line). The results were D1 = 0.6 × 10⁻⁷ cm2/s (46%) and D2 = 3.1 × 10⁻⁹ cm2/s (54%) in panel a, D1 = 0.5 × 10⁻⁷ cm2/s (46%) and D2 = 3.5 × 10⁻⁹ cm2/s (54%) in panel b and D1 = 0.4 × 10⁻⁷ cm2/s (41%) and D2 = 3.5 × 10⁻⁹ cm2/s (59%) in panel c. The insets and the bottom panels show the fluorescence intensities and the fit residues, respectively.
TABLE 3.
The relationship between TIR-FCS results and laser excitation power
| Laser power (μW/μm2) | Fast
|
Slow
|
|||
|---|---|---|---|---|---|
| D1 (cm2/s) | F1 (%) | D2 (cm2/s) | F2 (%) | ||
| TIR-FCS | 1.0 | 0.7 ± 0.2 × 10⁻⁷ | 52 ± 6 | 4.7 ± 2.6 × 10⁻⁹ | 48 ± 6 |
| 0.5 | 0.6 ± 0.3 × 10⁻⁷ | 51 ± 7 | 4.6 ± 2.5 × 10⁻⁹ | 49 ± 7 | |
| 0.25 | 0.5 ± 0.3 ×10⁻⁷ | 47 ± 10 | 5.1 ± 2.9 × 10⁻⁹ | 53 ± 10 | |
TIR-FCS of EGFP-F in COS7 cells with a series of laser excitation powers. The statistical data are based on TIR-FCS results for the same cells (n = 14 cells). Means ± SD.
DISCUSSION
TIR-FCS detection volume
Although the radius of the excitation area was ∼10 μm, the TIR-FCS detection area was much smaller. The values h and ωxy of the TIR-FCS observation volume were estimated by both fitting of TIR-FCS data on fluorescein in Tris-buffer solution and using the diffusion constant value of D = 3.0 × 10⁻⁶ cm2/s as a standard value (Fig. 2 a). With the larger incident-angle of the excitation laser, which produced a thinner evanescent field, the value of h decreased, while ωxy was not changed.
In the case of cellular experiments, the size of the observation volume is presumed to be a little different from that in aqueous solution measurements. Indeed, h, but not ωxy, would be larger because of the higher refractive indexes of cytosol. However, we used the same value of h as for in vitro experiments, because exact estimation of the observation volume in cellular applications seems to be very difficult due to heterogeneous attachment of the plasma membrane to the glass surface. The value of h numerically calculated by MDEs (20) may be appropriate for the cellular experiments to more precisely calculate three-dimensional diffusion constants. In this study, however, the procedure to estimate observation volume used in Fig. 2 a should have been sufficient to calculate the two-dimensional diffusion constants on the cell surface we were interested in.
TIR-FCS of R18 in the plasma membrane
The fitting results with the two-component model of two-dimensional diffusion, but not with the one-component model, agreed well with the measured correlation function in TIR-FCS of R18 in cell membranes (Fig. 4). This may be due to binding processes of R18 to the membrane, micellar structure, or anomalous diffusion (22). Confocal FCS also detected two diffusing species of R18 in the cell membrane (Supplementary Material, Fig. S1). A more appropriate laser wavelength (HeNe 543 nm) was used for R18 dyes (absorption maximum 556 nm) in confocal FCS, whereas our TIR-FCS system employed only a 488-nm laser in all the experiments. That is the reason why the signal bursts, as shown in confocal FCS measurements of R18, could not be observed in TIR-FCS. Nor could we do experiments using different laser powers with R18 in the cell membrane since the maximum power of the 488-nm laser only evoked weak excitation of R18, so the laser power could not be reduced.
Diffusion constants measured by TIR-FCS
Confocal FCS measurements (D1 = 2.7 × 10⁻⁷ cm2/s) confirmed that D1 (1.1 × 10⁻⁷ cm2/s), measured by TIR-FCS, represented free diffusion of EGFP-F located near the plasma membrane in cytosol of HeLa cells (Table 2). D2 (5.6 × 10⁻⁹ cm2/s) obtained by TIR-FCS was consistent with single-molecule tracking (SMT) data (4.7 × 10⁻⁹ cm2/s) and previous research in tsA201 cells at 22°C (SMT: 5.3 × 10⁻⁹ cm2/s, FRAP: 4.8 × 10⁻⁹ cm2/s (29)). However, the immobile fraction (0.6 × 10⁻⁹ cm2/s (29)) detected by previous research was not observed by TIR-FCS in this study. This suggested that the minimum detectable diffusion constant of TIR-FCS was ∼10−9 cm2/s, and was due to photobleaching.
The value D1 of EGFP-F in Fig. 5 seems to be a little smaller than the value of D1 measured by confocal FCS (Table 2). This might be due to underestimation of h (see TIR-FCS Detection Volume, above) or some interaction of EGFP-F with the cell surface.
Fraction of slow mobility on the cell surface
Although confocal FCS could detect both membrane-bound and free fluorescent molecules near the plasma membrane (Table 2), the standard deviations of the diffusion constants for the slow and fast moving components were much larger than those obtained by TIR-FCS. By using the confocal FCS, the plasma membrane can be detected very easily because the thickness of plasma membrane is only ∼10 nm and the length of the confocal element of FCS is ∼1 μm. However, detection of stable emission intensity from plasma-membrane-bound fluorophores may be difficult by using the confocal element of confocal FCS, because the distribution of excitation energy is changed according to the optical axis by moving the focal position. This suggests that local observation of the plasma membrane of the living cell is constantly achieved by TIR-FCS, because the thickness of the excitation field of TIR-FCS is constant at the plasma membrane. However, the detection efficiency decays much more in the axial direction in TIR-FCS. Therefore, we measured the strongest fluorescence intensity in cells whose membranes were tightly attached to the glass surface and did not undergo axial movement in and out of the exponentially decaying detection volume. However, it is necessary to design control experiments using a fluorescent probe residing exclusively in the cellular or an artificial membrane to address the possibility that minute movements of membranes in the axial direction contribute to the fluorescence fluctuation. Moreover, the dependence of diffusion times on the laser power and pinhole size should be checked in the near future as in a previous study (20). One should recognize the similarity between the TIR-FCS curve of eGFP sticking to a noncoated coverslip (Fig. 2 b, open circles) and the TIR-FCS curves of the membrane probes (Fig. 4, black line).
Although EGFP-F signals in the plasma membranes of HeLa cells were stronger than in cytosol as shown in the fluorescence microscope image (Fig. 5 b), the average fraction of membrane-binding EGFP-F (28%) was smaller than that of cytosol-localized EGFP-F (72%) (Fig. 5 e). This was because the depth of the evanescent field (200 nm) was still thicker than the plasma membrane (10 nm). A higher numerical aperture objective lens (NA = 1.65), which can produce a thinner evanescent field, could be expected to decrease the interference from cytosol. The fraction of F1 measured in confocal FCS was smaller than that in TIR-FCS (Table 2). In the confocal FCS measurements, most of the area focused on by the confocal element might be off the cell. In Table 3, however, the fraction of the membrane-binding component (F2) with laser power density 0.25 μW/μm2 was 53%, which was larger than the F2 (50%) obtained by confocal FCS of EGFP-F in COS7 cells.
The effect of photobleaching
We could measure the diffusion of EGFP near the cell surface in cytosol of HeLa cells only when using a deeper evanescent field than that used in Fig. 2 (Fig. 3). Indeed, although the autocorrelation function of EGFP in cytosol was obtained using the same incident angle for the laser as in Fig. 2, FCS signals were too weak to be analyzed by fitting. On the other hand, both cytosol-localized and membrane-anchoring EGFP-Fs were clearly detected using the same conditions of TIR illumination (Fig. 5 d). This might have been due to the interaction of EGFP-F with the plasma membrane, but it could not be explained in detail, so further study is required. However, Figs. 3–5 demonstrate that TIR-FCS was at least appropriate for monitoring of membrane-binding molecules, though not cytosol-localized molecules. Due to the reduced photobleaching by the thinner evanescent field, signal collection was performed for a longer time (30∼90 s). Indeed, 30-s collection gave correlation curves clear enough for fitting (Fig. 7).
The decrease of fluorescence occurring when the cells were first illuminated might correspond to the photobleaching of the mostly immobile fraction (29) or the aggregation of EGFP-F in the plasma membranes of HeLa cells (Fig. 5).
The total number of EGFPs in a cultured cell was much smaller than that in the buffer solution for in vitro experiments, because the volume of a cell is much smaller than the total volume in an in vitro experiment. The few EGFPs in cell space were destroyed readily by the evanescent field. Thus, in cellular experiments with an incident laser-beam angle of <70°, strong photobleaching interfered with signal collection of FCS for a longer time (Fig. 3).
After modification by double palmitoylation and single farnesylation, EGFP-F might come from the cytosol pool and then anchor in the plasma membrane like H-Ras. However, in this study, we presumed that association and dissociation of EGFP-F with the plasma membrane would rarely occur within the TIR-FCS detection volume. Since EGFP-F has two palmitoyl groups, its residence time at the plasma membrane should be longer than for membrane-anchored proteins with a single palmitoyl group like N-Ras (28). The slow process observed here may arise from EGFP-F molecules that have diffused three-dimensionally from the cytoplasm to the plasma membrane, instead of laterally within the plasma membrane into the detection volume (18,30). Detailed simulation experiments could resolve this question. However, that is beyond the scope of this article.
The assumption that diffusion constants may represent artifacts of photobleaching, but not real diffusional mobility, was denied by the experiments with a series of laser powers (Fig. 7). If D2 represents photobleaching dynamics, the D2 value would become smaller with weaker laser power. However, this effect did not occur (Table 3).
The disadvantage of TIR-FCS is that the total power of the laser used for illumination of the specimen is stronger than that in confocal FCS. Therefore, the fluorophores in the overall specimen, but not the detection volume, may be more easily bleached than in confocal FCS, in which the total power is lower and the excitation area is smaller. However, this weak point of TIR-FCS may be improved by a reduction of the illumination area in the x,y plane with a smaller field diaphragm.
On the other hand, the laser power density (the value obtained by division of total laser power by the illumination area), but not total power, is ∼50 times lower than that in confocal FCS. This advantage of TIR-FCS may yield a smaller possibility of photobleaching artifacts, compared to confocal FCS.
Incident laser intensity of ∼1 μW/μm2, which was measured through the objective (θ = 0°, epi-illumination), was used for TIR-FCS. This was ∼50 times weaker than that for confocal FCS, suggesting that there was little possibility of photobleaching in the detection volume on the cell surface and the usefulness of dual-color TIR-fluorescence cross-correlation spectroscopy (TIR-FCCS) application in combination with both EGFP-fused proteins and photochemically unstable monomeric red fluorescent proteins.
Finally, we conclude that TIR-FCS simultaneously detects membrane-bound movement and free movement of protein in cytosol in the living cell. In the near future, we plan to employ TIR-FCS to examine the dynamic processes of proteins that undergo localization changes between the cytosol and plasma membrane (PKC, MAPKKKs, etc.). Furthermore, TIR-FCCS should be useful as a method with high sensitivity for detecting weak pairs (31) or a leading method for monitoring of protein-protein associations on the surfaces of living cells (30). Our future goal is to develop TIR-FCCS and then to employ the technique for identification and characterization of ligand-receptor or protein-protein interactions at the plasma membranes in living cells.
SUPPLEMENTARY MATERIAL
An online supplement to this article can be found by visiting BJ Online at http://www.biophysj.org.
Acknowledgments
The authors thank T. Pieper for the kind discussion about simulation of surface diffusion. M.K. thanks Nikon Instech. Co., Ltd., for supporting the TIRF system on the TE2000.
This research was partly supported by Grants-in-Aid for Scientific Research Nos. (B) 15370062 and (A) 18207010 from the Japan Society for the Promotion of Science, and Grant-In-Aid for Scientific Research (Kakenhi) No. 16072201 in the Priority Area “Molecular Nano Dynamics.”
References
- 1.Rigler, R., Ü. Mets, J. Widengren, and P. Kask. 1993. Fluorescence correlation spectroscopy with high count rate and low background: analysis of translational diffusion. Eur. Biophys. J. 22:169–175. [Google Scholar]
- 2.Kinjo, M., and R. Rigler. 1995. Ultrasensitive hybridization analysis using fluorescence correlation spectroscopy. Nucleic Acids Res. 23:1795–1799. [DOI] [PMC free article] [PubMed] [Google Scholar]
- 3.Kinjo, M., G. Nishimura, T. Koyama, and Ü. Mets. 1998. Single-molecule analysis of restriction DNA fragments using fluorescence correlation spectroscopy. Anal. Biochem. 260:166–172. [DOI] [PubMed] [Google Scholar]
- 4.Takakuwa, Y., C.-G. Pack, X.-L. An, S. Manno, E. Ito, and M. Kinjo. 1999. Fluorescence correlation spectroscopy analysis of the hydrophobic interactions of protein 4.1 with phosphatidyl serine liposomes. Biophys. Chem. 82:149–155. [DOI] [PubMed] [Google Scholar]
- 5.Pack, C.-G., K. Aoki, H. Taguchi, M. Yoshida, M. Kinjo, and M. Tamura. 2000. Effect of electrostatic interactions on the binding of charged substrate to GroEL studied by highly sensitive fluorescence correlation spectroscopy. Biochem. Biophys. Res. Commun. 267:300–304. [DOI] [PubMed] [Google Scholar]
- 6.Nomura, Y., and M. Kinjo. 2004. Real-time monitoring of in vitro transcriptional RNA by using fluorescence correlation spectroscopy. ChemBioChem. 5:1701–1703. [DOI] [PubMed] [Google Scholar]
- 7.Brock, R., G. Vàmosi, G. Vereb, and T. M. Jovin. 1999. Rapid characterization of green fluorescent protein fusion proteins on the molecular and cellular level by fluorescence correlation microscopy. Proc. Natl. Acad. Sci. USA. 96:10123–10128. [DOI] [PMC free article] [PubMed] [Google Scholar]
- 8.Terada, S., M. Kinjo, and N. Hirokawa. 2000. Oligomeric tubulin in large transporting complex is transported via kinesin in squid giant axons. Cell. 103:141–155. [DOI] [PubMed] [Google Scholar]
- 9.Köhler, R. H., P. Schwille, W. W. Webb, and M. R. Hanson. 2000. Active protein transport through plastid tubules: velocity quantified by fluorescence correlation spectroscopy. J. Cell Sci. 113:3921–3930. [DOI] [PubMed] [Google Scholar]
- 10.Yoshida, N., M. Kinjo, and M. Tamura. 2001. Microenvironment of endosomal aqueous phase investigated by the mobility of microparticles using fluorescence correlation spectroscopy. Biochem. Biophys. Res. Commun. 280:312–318. [DOI] [PubMed] [Google Scholar]
- 11.Saito, K., E. Ito, Y. Takakuwa, M. Tamura, and M. Kinjo. 2003. In situ observation of mobility and anchoring of PKCβI in plasma membrane. FEBS Lett. 541:126–131. [DOI] [PubMed] [Google Scholar]
- 12.Kamada, A., H. Nagaya, T. Tamura, M. Kinjo, H. Y. Jin, T. Yamashita, K. Jimbow, H. Kanoh, and I. Wada. 2004. Regulation of immature protein dynamics in the endoplasmic reticulum. J. Biol. Chem. 279:21533–21542. [DOI] [PubMed] [Google Scholar]
- 13.Haustein, E., and P. Schwille. 2004. Single-molecule spectroscopic methods. Curr. Opin. Struct. Biol. 14:531–540. [DOI] [PubMed] [Google Scholar]
- 14.Tokunaga, M., K. Kitamura, K. Saito, A. H. Iwane, and T. Yanagida. 1997. Single molecule imaging of fluorophores and enzymatic reactions achieved by objective-type total internal reflection fluorescence microscopy. Biochem. Biophys. Res. Commun. 235:47–53. [DOI] [PubMed] [Google Scholar]
- 15.Axelrod, D. 2001. Total internal reflection fluorescence microscopy in cell biology. Traffic. 2:764–774. [DOI] [PubMed] [Google Scholar]
- 16.Thompson, N. L., T. P. Burghardt, and D. Axelrod. 1981. Measuring surface dynamics of biomolecules by total internal-reflection fluorescence with photobleaching recovery or correlation spectroscopy. Biophys. J. 33:435–454. [DOI] [PMC free article] [PubMed] [Google Scholar]
- 17.Starr, T. E., and N. L. Thompson. 2001. Total internal reflection with fluorescence correlation spectroscopy: combined surface reaction and solution diffusion. Biophys. J. 80:1575–1584. [DOI] [PMC free article] [PubMed] [Google Scholar]
- 18.Lieto, A. M., R. C. Cush, and N. L. Thompson. 2003. Ligand-receptor kinetics measured by total internal reflection with fluorescence correlation spectroscopy. Biophys. J. 85:3294–3302. [DOI] [PMC free article] [PubMed] [Google Scholar]
- 19.Hassler, K., T. Anhut, R. Rigler, M. Gösch, and T. Lasser. 2005. High count rates with total internal reflection fluorescence correlation spectroscopy. Biophys. J. 88:L01–L03. [DOI] [PMC free article] [PubMed] [Google Scholar]
- 20.Hassler, K., M. Leutenegger, P. Rigler, R. Rao, R. Rigler, M. Gösch, and T. Lasser. 2005. Total internal reflection fluorescence correlation spectroscopy (TIR-FCS) with low background and high count-rate per molecule. Opt. Express. 13:7415–7423. [DOI] [PubMed] [Google Scholar]
- 21.Madin, K., T. Sawasaki, T. Ogasawara, and Y. Endo. 2000. A highly efficient and robust cell-free protein synthesis system prepared from wheat embryos: plants apparently contain a suicide system directed at ribosomes. Proc. Natl. Acad. Sci. USA. 97:559–564. [DOI] [PMC free article] [PubMed] [Google Scholar]
- 22.Schwille, P., J. Korlach, and W. W. Webb. 1999. Fluorescence correlation spectroscopy with single-molecule sensitivity on cell and model membranes. Cytometry. 36:176–182. [DOI] [PubMed] [Google Scholar]
- 23.Kusumi, A., Y. Sako, and M. Yamamoto. 1993. Confined lateral diffusion of membrane receptors as studied by single particle tracking (nanovid microscopy). Effects of calcium-induced differentiation in cultured epithelial cells. Biophys. J. 65:2021–2040. [DOI] [PMC free article] [PubMed] [Google Scholar]
- 24.Saxton, M. J., and K. Jacobson. 1997. Single-particle tracking: applications to membrane dynamics. Annu. Rev. Biophys. Biomol. Struct. 26:373–399. [DOI] [PubMed] [Google Scholar]
- 25.Chen, Y., J. D. Müller, Q. Ruan, and E. Gratton. 2002. Molecular brightness characterization of EGFP in vivo by fluorescence fluctuation spectroscopy. Biophys. J. 82:133–144. [DOI] [PMC free article] [PubMed] [Google Scholar]
- 26.Starr, T. E., and N. L. Thompson. 2002. Local diffusion and concentration of IgG near planar membranes: measurement by total internal reflection with fluorescence correlation spectroscopy. J. Phys. Chem. B. 106:2365–2371. [Google Scholar]
- 27.Parton, R. G., and J. F. Hancock. 2004. Lipid rafts and plasma membrane microorganization: insights from Ras. Trends Cell Biol. 14:141–147. [DOI] [PubMed] [Google Scholar]
- 28.Meder, D., and K. Simons. 2005. Ras on the roundabout. Science. 307:1731–1733. [DOI] [PubMed] [Google Scholar]
- 29.Lommerse, P. H., G. A. Blab, L. Cognet, G. S. Harms, B. E. Snaar-Jagalska, H. P. Spaink, and T. Schmidt. 2004. Single-molecule imaging of the H-ras membrane-anchor reveals domains in the cytoplasmic leaflet of the cell membrane. Biophys. J. 86:609–616. [DOI] [PMC free article] [PubMed] [Google Scholar]
- 30.Schwille, P. 2003. TIR-FCS: staying on the surface can sometimes be better. Biophys. J. 85:2783–2784. [DOI] [PMC free article] [PubMed] [Google Scholar]
- 31.Laurence, T. A., and S. Weiss. 2003. How to detect weak pairs. Science. 299:667–668. [DOI] [PubMed] [Google Scholar]