Abstract
The application of microarray hybridization theory to Affymetrix GeneChip data has been a recent focus for data analysts. It has been shown that the hyperbolic Langmuir isotherm captures the shape of the signal response to concentration of Affymetrix GeneChips. We demonstrate that existing linear fit methods for extracting gene expression measures are not well adapted for the effect of saturation resulting from surface adsorption processes. In contrast to the most popular methods, we fit background and concentration parameters within a single global fitting routine instead of estimating the background before obtaining gene expression measures. We describe a non-linear multi-chip model of the perfect match signal that effectively allows for the separation of specific and non-specific components of the microarray signal and avoids saturation bias in the high-intensity range. Multimodel inference, incorporated within the fitting routine, allows a quantitative selection of the model that best describes the observed data. The performance of this method is evaluated on publicly available datasets, and comparisons to popular algorithms are presented.
INTRODUCTION
Genome-wide expression analysis has become an increasingly important tool for identifying gene function, disease-related genes and transcriptional patterns related to drug treatments. The Affymetrix GeneChip technology, introduced in 1996, has become one of the most widely used platforms for whole-genome expression analysis. Each gene is represented on the GeneChip by 10–20 ‘perfect match’ (PM) probes, consisting of 25 bp complementary to different coding sequence regions of the gene in question. In addition, there is a corresponding set of ‘mismatch’ (MM) probes, where the middle base has been substituted with its complement.
Most software packages available for the calculation of gene expression levels from fluorescence intensities rely on algorithms of a purely statistical or empirical nature; Affymetrix Microarray Suite 5.0 is based on the Tukey biweight algorithm (1) (http://www.affymetrix.com), DNA-Chip Analyzer (dChip) implements a linear model for expression analysis of oligonucleotide arrays (2) and Bioconductor's RMA employs a log-additive robust multi-array analysis (3). More recently, several algorithms based on physical properties of the hybridization process have been introduced. GCRMA performs a background adjustment using sequence information (4) and Zhang et al. (5) implement a dependent nearest-neighbor model (PDNN).
It has been shown that the hyperbolic Langmuir isotherm describes the shape of GeneChip signal response to concentration (6). Most of the developed methods rely, however, on a linear fit, while in reality probe intensities often span outside the linear regime region of the isotherm within the working concentration range for commercial arrays. The availability of calibration experiments allows for the development and validation of statistical signal models for microarray data. We use three publicly available spike-in datasets (U95, U133 and wholly defined control spike-in datasets) to test and validate a novel multi-chip non-linear fitting algorithm (7,8) (http://www.affymetrix.com/support/technical/sample_data/datasets.affx).
The removal of non-specific background is a key issue in microarray data analysis. Several existing methods use MM probes to estimate the background signal. An underlying assumption of these approaches is that the majority of MM signal is non-specific (1,4). However, mismatch signal contains mostly specific signal in addition to a random non-specific component that is different from the non-specific component of PM. Hence direct subtraction of MM is unlikely to be useful. We therefore exclude MM information from our model.
MATERIALS AND METHODS
Langmuir isotherm
In this paper we propose to use a physical model of the hybridization process based on Langmuir adsorption theory. Previous work in this field was carried out by Halperin et al. (6), Peterson et al. (9), Vainrub and Pettitt (10) and Dai et al. (11). Attempts to match Langmuir adsorption isotherms to the Affymetrix spike-in experiment data include those of Held et al. (12), Hekstra et al. (13) and Zhang et al. (5). Langmuir adsorption theory is based on the assumption that there are two competing processes driving hybridization: adsorption, that is, the binding of target molecules to immobilized probes to form duplexes, and desorption, that is, the reverse process of duplexes dissociating into separate probe and target molecules. The form of the equation results in a non-linear concentration–intensity response, that is, decreased probe affinity with increase in concentration. In the absence of non-specific binding, the equation would be of the form
where c is a concentration, I a saturation intensity and k is an equilibrium constant.
It has been shown that the saturation intensity and equilibrium constants depend on numerous factors and differ greatly from probe to probe. Several attempts have been made to predict these constants from probe sequence content (5,13). For example, Hekstra et al. (13) used a Langmuir adsorption model with an additive background from non-specific binding. In this approach, parameters for the Langmuir model were first fit into the model using known concentration values provided in a spike-in experiment. Next, the resulting parameters were fit into linear combinations of the numbers of each nucleotide for each probe–target pair and estimates of concentrations were obtained for each probe by inverting the Langmuir equation. The averages of predicted concentrations across each probeset were then reported as expression measures. Burden et al. (14) demonstrated that such an approach returns poor estimates of concentration; up to 60% of predicted values had to be discarded according to the suggested truncation scheme.
Statistical model
Although duplex formation in solution has been extensively studied using a nearest-neighbor model, it has been difficult to apply those results to microarrays (5). Binding interactions on the microarray surface are complicated by many factors including steric hindrance on the surface, probe–probe interactions and RNA secondary structure formation. Hence, we avoid predicting physical parameters of the model. We use the notion of background as a probe-specific part of the signal that is introduced by all the genes in the sample pool other than the target gene. We propose the following statistical model:
where p is a probe index (p = 1,…,p), j a condition (concentration) index (j = 1,…,J), c a concentration, l a replicate (l = 1,…,L), I a saturation intensity, k an equilibrium constant and bg the background component of the signal. The ɛpjl are independent error terms, with mean 0 and constant variance. Thus, each probe is parameterized by three parameters and each experimental condition is characterized by one concentration.
The model described above allows us to utilize knowledge about the design of the experiment. If the experiment includes several technical replicates (i.e. hybridization was performed with identical samples) as it was in all the three datasets used in this study, then all observations within each condition should be characterized by the same concentration. In biological replicates, which are usually more common, samples from different individuals are collected and prepared separately. Thus, each intensity is characterized by its own RNA concentration even if they belong to the same biological condition.
Algorithm
Before fitting, the data were normalized. For Affymetrix spike-in datasets we used a probe-level quantile normalization (15), implemented in Bioconductor, an open source project for the analysis of genomic data (16). For the wholly defined control spike-in dataset, we adopted constantsubset invariant set normalization, proposed in the original paper (8).
We used an iterative non-linear procedure with a Newton-type optimization method to fit the model to the data. The first step of this method is to obtain estimates for initial concentrations by fitting log intensities to a linear model using a robust additive model that employs Tukey's median polish procedure:
The ‘medpolish()’ routine is available in R, a widely used open source language and environment for statistical computing and graphics (17).
Next, probe parameters I, k, bg and concentration terms c are iteratively refined according to the full non-linear model through ‘nlm()’, a non-linear least square optimization routine in the R statistical system. The search is carried out iteratively by minimizing the sum of squares of the residual matrix obtained in the previous fit. First, the estimators of probe parameters are updated using current concentration values. Then concentration estimates are optimized based on these new probe parameters. The iterative scheme continues until convergence is obtained, i.e. until fitted parameters from a current step are sufficiently close to the parameters of the previous step. Convergence was observed after 5–10 iterations.
Model selection
A goodness-of-fit test is an important step in any model fitting procedure. We address the quality of fit by using a modified F-test framework.
In the presence of a specific target gene, the model can be rewritten as
where p is a probe index, j a condition (concentration) index, SPpj the specific component of the signal and bgp the non-specific fraction of the signal. If gene expression does not change from condition to condition, then the signal model should be simplified to
Hence, a simplified model with fewer parameters is more appropriate when the target gene is not differentially expressed. In order to address this question, for each gene we perform a goodness-of-fit test and select the appropriate model based on formal model selection criteria using the statistic:
where RSS1 denotes the residual sum of squares from fitting the reduced model and RSS0 denotes the residual sum of squares from fitting the full model. The nested model is constructed so that the simpler one-concentration model can be obtained from the multi-concentration signal model as described above. Thus choosing among models reduces to determining the appropriateness of the additional concentration parameters. The significance of F-values is assessed by permutation analysis; randomization of the probe data for the genes that were not spiked in the test datasets was performed to establish a fixed cutoff level for P-values. Cutoff values were established by analysing the distribution of F-values for non-differentially expressed genes in the Choe dataset and non-spiked genes in the public Affymetrix datasets. Results were in rough agreement. We found that a cutoff of F < 1 eliminates 99% of non-expressed or unchanged genes in all these datasets. Further analysis such as assigning significance to expression changes in different biological conditions must be performed by high-level analysis routine, e.g. with the help of packages such as limma (18) and SAM (19).
The test datasets
Affymetrix human genome U95 dataset
In the course of developing and validating the Affymetrix Microarray Suite (MAS) 5.0 algorithm, Affymetrix produced data from a set of 59 arrays (HGU95) organized in a Latin square design. This dataset consists of 14 groups of human genes spiked in at known cRNA concentrations, arranged in a cyclicLatin square design, with each concentration appearing once in each row and column. The concentrations of the 14 gene groups in the first experiment are 0, 0.25, 0.5, 1, 2, 4, 8, 16, 32, 64, 128, 256, 512 and 1024 pM. Each experiment contains three replicates. The Affymetrix Human Genome U95 spike-in dataset is available at http://www.affymetrix.com/support/technical/sample_data/datasets.affx.
Affymetrix human genome U133 dataset
This dataset consists of 3 technical replicates of 14 separate hybridizations of 42 spiked transcripts in a complex human background at concentrations ranging from 0.125 to 512 pM. Thirty of the spikes are isolated from a human cell line, four spikes are bacterial controls and eight spikes are artificially engineered sequences believed to be unique in the human genome. The Affymetrix Human Genome U133 spike-in dataset is available at http://www.affymetrix.com/support/technical/sample_data/datasets.affx.
Wholly defined control spike-in dataset
Choe et al. (8) generated a new control dataset for the purpose of evaluating methods for identifying differentially expressed genes between two sets of replicated hybridizations to Affymetrix GeneChips. This dataset contains 1309 individual cRNAs that differ by known relative concentrations between the spike-in and control samples. This large number of defined RNAs provides accurate estimates of false-negative and false-positive rates at each fold-change level. The dataset includes low fold changes, beginning at only a 1.2-fold concentration difference, up to 4-fold. The dataset uses a defined background sample of 2551 RNA species present at identical concentrations in both sets of microarrays, rather than a biological RNA sample of unknown composition.
RESULTS
Langmuir adsorption model
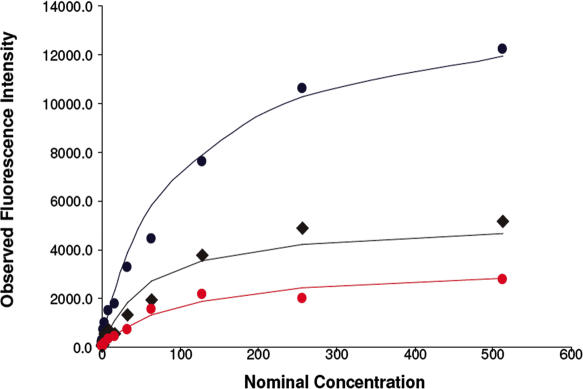
As noted earlier, the response curve is non-linear and it can be better characterized by a Langmuir isotherm (13). The resulting fluorescence signal versus target concentration data are shown in Figure 1, providing a demonstration that the Langmuir model captures the physical chemistry of GeneChip hybridization.
Figure 1.
Fluorescence intensity versus nominal concentration for three genes in the Affymetrix U133 dataset. Points represent experimental conditions and solid lines represent Langmuir isotherm fit.
Extraction of gene expression and estimates of differential expression
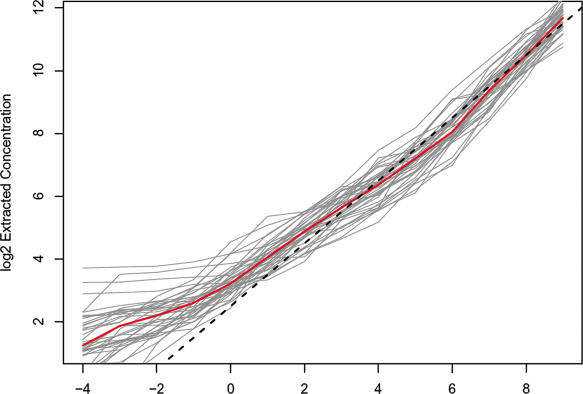
We fit our non-linear model to the U133 spike-in data without prior knowledge of the concentrations used in this experiment. Figure 2 shows the reconstructed concentration range plotted against the true mRNA concentration.
Figure 2.
Gene expression measures obtained using non-linear multi-chip fit for the 42 spike-in genes in the 14 experiments in AFFY HG-U133. Each curve represents extracted expression measures for a gene. Red line denotes the median and dashed line represents the identity line.
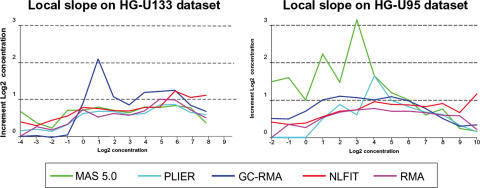
The sensitivity of the algorithm can be assessed by examining local slopes, i.e. the observed log fold-change for genes with true fold-change of 2. Since concentration groups in both datasets are arranged in a Latin Square design and thus differ by a factor of 2, the ideal local slope would be 1. Figure 3 shows the predicted concentration increments for the full concentration ranges.
Figure 3.
Extracted local slopes versus nominal concentration. The average over 42 probesets in shown in red. The identity line is also shown by the black dashed line.
Comparison with existing algorithms
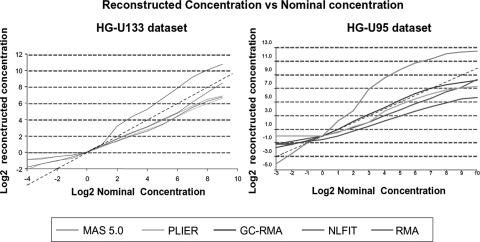
We compared the performance of our non-linear multi-chip fitting procedure to other popular algorithms that compute gene expression measures using the two Affymetrix spike-in datasets mentioned earlier. Algorithms selected for comparison included RMA (3), RMA's successor GCRMA (4), Affymetrix MAS 5.0 (1) and the latest Affymetrix algorithm, PLIER (Probe Logarithmic Intensity Error) (1). The results for MAS and PLIER methods were obtained using the Bioconductor implementation (16). Surprisingly, the performance of these algorithms varies greatly depending on the dataset used, e.g. GCRMA shows improved performance on the HG-U95 spike-in control dataset while performing significantly worse on the HG-U133 dataset (Figures 4 and 5). In contrast, MAS 5.0 shows improved reconstructed concentration curves on the U133 spike-in dataset and performs poorly on the U95 spike-in dataset. The non-linear multi-chip fit performs consistently on both U133 and U95 since it does not rely on pre-fitted parameters optimized for a particular dataset.
Figure 4.
Reconstructed concentration range versus nominal concentrations of U133 and U95 spike-in dataset for MAS 5.0 (green), PLIER (light blue), GCRMA (dark blue), RMA (fuchsia) and NLFIT (red), shifted to match 1 pM concentration. Averages taken over 42 probesets are shown. Reconstructed curves were shifted vertically to meet zero at 1 pM spike-in. The identity line is dashed.
Figure 5.
Reconstructed concentration increments versus nominal concentrations of U133 and U95 spike-in dataset for MAS 5.0 (green), PLIER (light blue), GCRMA (dark blue), RMA (fuchsia) and NLFIT (red). Averages taken over 42 probesets are shown. An ideal, y = 1, increment line is shown in dashed black.
We used the Affycomp benchmark (20) to evaluate, compare and display the performance of expression level estimators for proposed global multi-chip non-linear fit. Using controlled spike-in experiments and dilution series, Affycomp systematically assesses the performance of the methods at different biologically relevant spike-in concentrations. The results of the assessment have been submitted to the Affycomp website for comparison with other probe-level analysis algorithms.
Owing to the structure of NLFIT results, several assessment scores should not be considered for evaluation and comparison. For example, the proposed global non-linear multi-chip algorithm accounts for experimental design, and fits replicated data into a single measure. Thus, assessments that account for between-replication variation in expression level estimators should not be considered. In addition, the use of model selection and incorporation of experiment design within the fitting routine has advantages and in particular should lead to higher assessment scores. For the spike-in experiment using the HG-U133A and HG-U95 chip, our proposed global non-linear multi-chip algorithms achieved high scores in all relevant assessments. The complete assessment report is provided in Table 1. Additional comparisons of NLFIT performance, in particular excluding experimental design information, are provided in Supplementary Material.
Table 1.
The results from the Affycomp assessment of HG-U133A and HG-U95 spike-in data, processed with NLFIT (submitted August 19, 2005)
| Statistics | HG_U95 | HG_U133A |
|---|---|---|
| 1. [26] Median SD—median SD across replicates | — | — |
| 2. [18] Null log-fc IQR—Inter-quartile range of the log-fold-changes from genes that should not change | — | — |
| 3. [20] Null log-fc 99.9%—99.9% percentile of the log-fold-changes if from the genes that should not change | — | — |
| 4. [2] Signal detect R2—R-squared obtained from regressing expression values on nominal concentrations in the spike-in data | 0.89 | 0.85 |
| 5. [1] Signal detect slope–slope obtained from regressing expression values on nominal concentrations in the spike-in data | 0.65 | 0.7 |
| 6. [29] Low.slope–Slope from regression of observed log concentration versus nominal log concentraion for genes with low intensities | 0.25 | 0.22 |
| 7. [30] Med.slope—As above but for genes with medium intensities | 0.68 | 0.69 |
| 8. [31] High.slope—As above but for genes with high intensities | 0.68 | 1.07 |
| 9. [10] Obs-intended-fc slope–slope obtained from regressing observed log-fold-changes against nominal log-fold-changes | 0.64 | 0.7 |
| 10. [11] Obs-(low)int-fc slope–slope obtained from regressing observed log-fold-changes against nominal log-fold-changes for genes with nominal concentrations less than or equal to 2 | 0.34 | 0.29 |
| 11. [21] Low AUC—Area under the ROC curve (up to 100 false positives) for genes with low-intensity standardized so that optimum is 1 | 0.74 | 0.76 |
| 12. [22] Med AUC—As above but for genes with medium intensities | 0.92 | 0.95 |
| 13. [23] High AUC—As above but for genes with high intensities | 0.95 | 0.97 |
| 14. [24] Weighted avg AUC—A weighted average of the previous three ROC curves with weights related to amount of data in each class (low, medium, high) | 0.79 | 0.81 |
We also used the dataset of Choe et al. (8) to assess the performance of our non-linear multi-chip fitting procedure. This dataset was prepared to evaluate statistical inference methods. However, it has several experimental design issues that suggest caution when interpreting the results (21). One of the issues is that an unequal amount of RNA was hybridized to spiked and control chips. The total amount of RNA on spiked chips is ∼20% more than on control chips. This leads to a series of problems in the analysis of the data. Microarray modeling usually relies on several assumptions, including the equality of background levels and identity of signal distributions. The characteristics of this particular experimental design lead to custom routines such as post-normalization of summarized gene expression values (8). At the same time, this large dataset is a useful benchmark for the quality assessment of gene expression extraction algorithms that involve background correction as well as low-level summarization of probeset intensities into one gene expression measure.
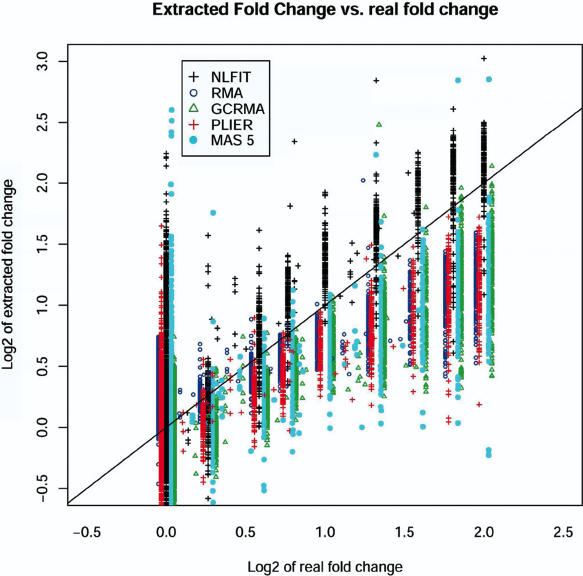
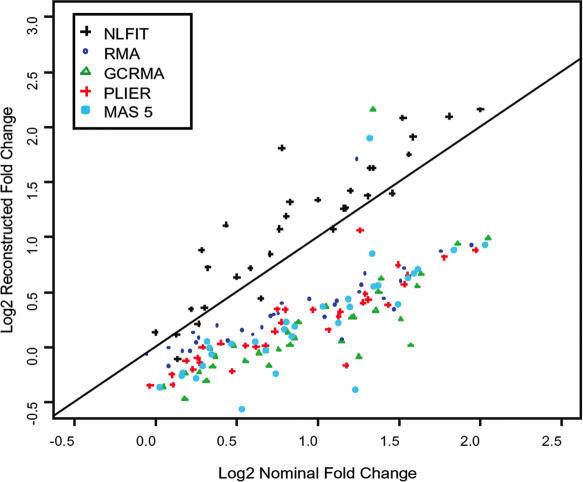
To perform a direct comparison of the popular methods to the proposed non-linear routine we reproduced all of the analysis steps described in Choe et al. (8). We generate the results of RMA, GCRMA, Affymetrix MAS 5.0 and PLIER, as well as our NLFIT routine. The results obtained for GCRMA, Affymetrix MAS 5.0 were in agreement with the ones reported in (8). We compared the observed fold changes with known fold changes and the resulting plots are shown in Figures 6 and 7. These figures demonstrate the advantage of NLFIT over other popular procedures like RMA, GCRMA, PLIER and MAS5 in its ability to reconstruct the fold change. The effect is more pronounced due to the increased number of spiked-in genes available in the wholly defined control dataset. We observe that these algorithms consistently underestimate fold changes by a factor of ∼2. In contrast, NLFIT reconstructs fold changes without significant distortion.
Figure 6.
Reconstructed log2 fold-change versus nominal log2 fold changes of wholly defined control spike-in dataset for MAS 5.0 (light blue closed circle), PLIER (red +), GCRMA (green open triangle), RMA (blue open circle) and NLFIT (black +). The x = y line is shown in solid black.
Figure 7.
Reconstructed log2 fold-change versus nominal log2 fold changes of wholly defined control spike-in dataset for MAS 5.0 (light blue closed circle), PLIER (red +), GCRMA (green open triangle), RMA (blue open circle) and NLFIT (black +). Median fold changes for each method are shown. The x = y line is shown in solid black.
DISCUSSION
Examining fluorescence intensity versus nominal concentration plots shows that the assumption of linearity between measured intensity and concentration is inaccurate in the case of Affymetrix GeneChips and results in curves saturating according to a hyperbolic Langmuir isotherm. By employing a physical model that accounts for chemical saturation we improve the accuracy in differential gene expression estimates, especially in high concentration ranges.
In addition, by implementing background and gene expressions estimation within the same fitting procedure, we are able to provide estimates of differential expression with a significant reduction in bias, without a concomitant decrease in the signal-to-noise ratio. This allows us to estimate background on each probe in the context of all experimental conditions. Other algorithms (RMA, GCRMA) subtract background estimates based on theoretical predictions before fitting expression measures. The suggested model is relatively complex in comparison to other popular algorithms. It requires a significant number of arrays to perform. However, performance of the algorithm on Choe's dataset (two experimental condition and three replicates per condition) shows satisfying performance and shows superior concentration reconstruction compared to GCRMA, RMA, MAS5 and PLIER.
Comparisons of the various algorithms are limited by the small number of available control datasets. The two Affymetrix spike-in datasets used in this study are among the few available for benchmarking Affymetrix GeneChip expression measures. Certain algorithms were trained on these datasets and, hence, a direct comparison of such results must be excluded.
Examination of Figures 4 and 5 reveals that both PLIER and GCRMA are fairly insensitive to low concentrations of less than 1 pM, whereas NL-FIT and MAS 5.0 are able to detect concentration changes at a level of 0.1 pm. Methods that use MM as a background predictor, i.e. MAS 5.0 and GCRMA, tend to overestimate concentration changes (Figure 5). It is also apparent that methods that rely on linear models (MAS 5.0, PLIER and GCRMA) become less sensitive in the high target concentration range, while NLFIT correctly estimates concentration changes across the entire range of values.
Acknowledgments
Funding to pay the Open Access publication charges for this article was provided by the University of Southern California. The authors were supported in part by NIH grant GM67243. ST is a Royal Society/Wolfson Research Award holder.
Conflict of interest statement. None declared.
REFERENCES
- 1.Affymetrix. Statistical Algorithms Description Document. 2001.
- 2.Li C., Wong W.H. Model-based analysis of oligonucleotide arrays: expression index computation and outlier detection. Proc. Natl Acad. Sci. USA. 2001;98:31–36. doi: 10.1073/pnas.011404098. [DOI] [PMC free article] [PubMed] [Google Scholar]
- 3.Gautier L., Cope L., Bolstad B.M., Irizarry R.A. Affy—analysis of Affymetrix Genechip data at the probe level. Bioinformatics. 2004;20:307–315. doi: 10.1093/bioinformatics/btg405. [DOI] [PubMed] [Google Scholar]
- 4.Wu Z., Irizarry R.A. Preprocessing of oligonucleotide array data. Nat. Biotechnol. 2004;22:656–658. doi: 10.1038/nbt0604-656b. [DOI] [PubMed] [Google Scholar]
- 5.Zhang L., Miles M.F., Aldape K.D. A model of molecular interactions on short oligonucleotide microarrays. Nat. Biotechnol. 2003;21:818–821. doi: 10.1038/nbt836. [DOI] [PubMed] [Google Scholar]
- 6.Halperin A., Buhot A., Zhulina E.B. Sensitivity, specificity, and the hybridization isotherms of DNA chips. Biophys. J. 2004;86:718–730. doi: 10.1016/S0006-3495(04)74150-8. [DOI] [PMC free article] [PubMed] [Google Scholar]
- 7.Affymetrix. Latin Square Data for Expression Algorithm Assessment. 2001.
- 8.Choe S., Boutros M., Michelson A., Church G., Halfon M. Preferred analysis methods for affymetrix genechips revealed by a wholly defined control dataset. Genome Biol. 2005;6:R16. doi: 10.1186/gb-2005-6-2-r16. [DOI] [PMC free article] [PubMed] [Google Scholar]
- 9.Peterson A.W., Heaton R.J., Georgiadis R.M. The effect of surface probe density on DNA hybridization. Nucleic Acids Res. 2001;29:5163–5168. doi: 10.1093/nar/29.24.5163. [DOI] [PMC free article] [PubMed] [Google Scholar]
- 10.Vainrub A., Pettitt B.M. Coulomb blockage of hybridization in two-dimensional DNA arrays. Phys. Rev. E Stat. Nonlin. Soft. Matter Phys. 2002;E66:041905. doi: 10.1103/PhysRevE.66.041905. [DOI] [PubMed] [Google Scholar]
- 11.Dai H., Meyer M., Stepaniants S., Ziman M., Stoughton R. Use of hybridization kinetics for differentiating specific from non-specific binding to oligonucleotide microarrays. Nucleic Acids Res. 2002;30:86. doi: 10.1093/nar/gnf085. [DOI] [PMC free article] [PubMed] [Google Scholar]
- 12.Held G.A., Grinstein G., Tu Y. Modeling of DNA microarray data by using physical properties of hybridization. Proc. Natl Acad. Sci. USA. 2003;100:7575–7580. doi: 10.1073/pnas.0832500100. [DOI] [PMC free article] [PubMed] [Google Scholar]
- 13.Hekstra D., Taussig A.R., Magnasco M., Naef F. Absolute mRNA concentrations from sequence-specific calibration of oligonucleotide arrays. Nucleic Acids Res. 2003;31:1962–1968. doi: 10.1093/nar/gkg283. [DOI] [PMC free article] [PubMed] [Google Scholar]
- 14.Burden C., Pittelkow Y.E., Wilson S. Statistical analysis of adsorption models for oligonucleotide microarrays. Stat. Appl. Genet. Mol. Biol. 2004;3:Article 35. doi: 10.2202/1544-6115.1095. [DOI] [PubMed] [Google Scholar]
- 15.Bolstad B.M., Irizarry R.A., Astrand M., Speed T.P. A comparison of normalization methods for high density oligonucleotide array data based on variance and bias. Bioinformatics. 2003;19:185–193. doi: 10.1093/bioinformatics/19.2.185. [DOI] [PubMed] [Google Scholar]
- 16.Gentleman R.C., Carey V.J., Bates D.M., Bolstad B., Dettling M., Dudoit S., Ellis B., Gautier L., Ge Y., Gentry J., et al. Bioconductor: open software development for computational biology and bioinformatics. Genome Biol. 2004;5:R80. doi: 10.1186/gb-2004-5-10-r80. [DOI] [PMC free article] [PubMed] [Google Scholar]
- 17.R Development Core Team. R: A Language and Environment for Statistical Computing. Vienna, Austria: R Foundation for Statistical Computing; 2005. [Google Scholar]
- 18.Smyth G.K., Michaud J., Scott H.S. Use of within-array replicate spots for assessing differential expression in microarray experiments. Bioinformatics. 2005;21:2067–2075. doi: 10.1093/bioinformatics/bti270. [DOI] [PubMed] [Google Scholar]
- 19.Tusher V.G., Tibshirani R., Chu G. Significance analysis of microarrays applied to the ionizing radiation response. Proc. Natl Acad. Sci. USA. 2001;98:5116–5121. doi: 10.1073/pnas.091062498. [DOI] [PMC free article] [PubMed] [Google Scholar]
- 20.Cope L.M., Irizarry R.A., Jaffee H.A., Wu Z., Speed T.P. A benchmark for Affymetrix GeneChip expression measures. Bioinformatics. 2004;20:323–331. doi: 10.1093/bioinformatics/btg410. [DOI] [PubMed] [Google Scholar]
- 21.Dabney A.R., Storey J.D. A reanalysis of a published Affymetrix GeneChip control dataset. Genome Biol. 2006;7:401. doi: 10.1186/gb-2006-7-3-401. [DOI] [PMC free article] [PubMed] [Google Scholar]


