Abstract
The anion exchanger protein 1 (AE1; band 3) is an abundant erythrocyte transmembrane protein that regulates chloride-bicarbonate exchange and provides an attachment site for the erythrocyte membrane skeleton on the cytoplasmic domain. We analyzed the function of the erythroid AE1 gene promoter by using run-on transcription, RNase protection, transient transfection, and transgenic mouse assays. AE1 mRNA was transcribed at a higher level and maintained at a higher steady-state level than either ankyrin or β-spectrin in mouse fetal liver cells. When linked to a human γ-globin gene, two different AE1 promoters directed erythroid-specific expression of γ-globin mRNA in 18 of 18 lines of transgenic mice. However, variegated expression of γ-globin was observed in 14 of 18 lines. While there was a significant correlation between transgene copy number and the amount of γ-globin mRNA in all 18 lines, the transgene mRNAs initiated upstream of the start site of the endogenous AE1 mRNA. Addition of the insulator element from 5′HS4 of the chicken β-globin cluster to the AE1/γ-globin transgene allowed position-independent, copy-number-dependent expression at levels similar to the AE1 transcription rate in six of six lines of transgenic mice. The mRNA from the insulated AE1/γ-globin transgene mapped to the start site of the endogenous AE1 mRNA, and γ-globin protein was expressed in 100% of erythrocytes in all lines. We conclude that the chicken β-globin 5′HS4 element is necessary for full function of the AE1 promoter and that position effect variegation is associated with RNA transcription from the upstream start sites.
The proteins of the erythrocyte membrane skeleton provide the flexibility that allows a red blood cell to deform to pass through small capillaries and to withstand wide fluctuations in osmolarity and pH (26). The four major components of the erythrocyte membrane skeleton are α- and β-spectrin, ankyrin, and band 3 (also known as the anion exchanger protein 1 [AE1] [4]). In a typical red cell, heterodimers of α- and β-spectrin (43) bind to ankyrin (4), which is bound to AE1, a 100-kDa transmembrane glycoprotein that is present at 106 copies per red cell (25). The C-terminal 55-kDa transmembrane portion of AE1 provides the major Cl− and HCO3− exchange channel in the red cell (24), while the 43-kDa cytoplasmic N-terminal domain of AE1 interacts with ankyrin (3, 14). During erythropoiesis, α- and β-spectrin, ankyrin, and AE1 mRNA and protein are produced asynchronously and at levels different from the level of each protein in the red cell membrane and skeleton (12, 22, 29, 42).
The mammalian AE1 gene is expressed at high levels in erythroid cells (25, 28). Preliminary studies demonstrated that the erythroid AE1 promoter was contained within 350 bp of the mRNA start site (20, 21, 35, 36). A truncated AE1 isoform originating from an alternate promoter located in exon 3 is expressed at high levels in kidney cells and at very low levels in erythroid cells (19, 21, 28, 35). Additional low-level AE1 transcripts have been detected in transformed lymphocytes and cardiac myocytes (17, 32), but the ends of these transcripts have not been identified.
We have previously analyzed the promoter regions of the β-spectrin (β-sp) and ankyrin-1 (ank) genes by using reporter assays in human erythroleukemia cell lines and transgenic mice (7-9, 33, 34). The minimal β-sp and ank promoters are contained in compact GC-rich sequences, similar to housekeeping promoters, and direct erythroid-specific expression in both transient-transfection assays and in transgenic mice (7-9, 33). In transgenic mice, the minimal β-sp promoter linked to a human γ-globin gene directed expression in 60% of transgenic lines with no correlation between transgene copy number and the level of γ-globin mRNA, demonstrating significant position effects (33). In contrast, the ank promoter directed uniform, position-independent, copy-number-dependent expression of the γ-globin transgene in reticulocytes (8, 34).
In this study we compared the expression of AE1 to that of β-sp and ank by using transient-transfection, nuclear run-on, RNase protection, and transgenic mouse assays. The AE1 gene was transcribed at the highest rate, and AE1 promoter sequences from −357 to + 9 or from −1738 to +9 (21, 35) fused to a γ-globin transgene directed erythroid-specific expression of γ-globin mRNA at higher levels than either the β-sp or ank promoters in transgenic mice. However, the AE1/γ-globin mRNAs mapped to multiple start sites located upstream of the start site used by the endogenous AE1 gene, and variegated expression of the AE1/γ-globin gene in red blood cells was observed in 14 of 18 transgenic lines.
Position effect variegation (PEV) has been well studied in Drosophila melanogaster models, and suppression of PEV has been shown to require the presence of several classes of boundary or insulator elements (10, 18, 41). Hypersensitive site 4 (5′HS4) of the chicken β-globin gene cluster has been shown to suppress variegated expression of a tyrosinase transgene in transgenic mice (30) or a green fluorescent protein gene introduced into primary hematopoietic cells by retrovirus-mediated gene transfer (6). The core of the 5′HS4 insulator contains binding sites for five protein complexes, including CTCF, an 11-zinc finger protein that is required for enhancer blocking (1, 2, 15), and a different protein complex that is required for the suppression of PEV (31). The suppression of PEV by 5′HS4 has been studied in cultured erythroid cells by using a chicken β-globin promoter/interleukin-2 receptor reporter construct (2, 5, 27, 31). The PEV suppression was associated with high levels of histone acetylation and specific protection of the β-globin promoter DNA from methylation. However, how these properties combine to suppress PEV is not clear (27).
When the chicken β-globin 5′HS4 was used to flank the AE1/γ-globin gene, the AE1/γ-globin mRNA mapped to the correct start site, and uniform, position-independent, copy-number-dependent expression of the transgene at levels that were ∼20% of the level of total mouse α-globin were observed in six of six transgenic lines. Our data demonstrate that the use of the correct mRNA initiation site is correlated with uniform expression of the AE1/γ-globin transgene and that the chicken β-globin insulator element is sufficient to overcome PEV and allow full activity of the AE1 promoter in primary mouse erythroid cells.
MATERIALS AND METHODS
Plasmid constructs.
The β-spectrin/luciferase (−504 to +77) and ank/luciferase (−296 to −15) expression vectors have been described previously (7, 9). To generate −357 AE1/luciferase, a 366-bp MscI/SacI (−357 to +9) fragment from the mouse AE1 promoter was cloned into pGL2. To generate −1738 AE1/luciferase, a 1,747-bp SacI fragment of the mouse AE1 promoter (−1738 to +9) was cloned into pGL2 (35).
The −357 AE1 transgene construct was made as a three-part ligation consisting of an 828-bp MscI and BamHI fragment of −1738 AE1/γ-globin containing the −357 AE1 promoter and exons 1 and 2 of the γ-globin gene, a 1,486-bp BamHI/HindIII fragment of −1738 AE1/γ-globin containing the 3′ end of the γ-globin gene, and pSP72 digested with SmaI and HindIII. The 2.3-kb construct was linearized for transfection with KpnI and excised for microinjection with KpnI and HindIII.
The −1738 AE1/γ-globin transgene construct was made as a three-part ligation consisting of a 1,832-bp KpnI/BglII fragment of −1738 AE1/luciferase containing the −1738 AE1 promoter, a 1,922-bp BglII/HindIII fragment containing the γ-globin gene, and pSP72 digested with KpnI and HindIII. The 3.8-kb construct was linearized for transfection with KpnI and excised for microinjection with KpnI and HindIII.
A 1.2-kb fragment containing HS4 of the chicken β-globin gene cluster has been shown to contain the insulator activity (2, 5). This fragment was excised from pJC 13-1 (2) as a KpnI fragment and cloned into pSP72 to generate pAC668. After screening for orientation, the insulator fragment was excised from pAC668 as an AatII/EcoRV fragment and cloned into pSP72/Aγ-globin plasmid (33) digested with HindIII (blunted) and AatII to generate pAC675. The insulated −1738 AE1 construct was generated from a three-part ligation involving plasmid pAC668 cut with BamHI and NdeI containing the vector and 5′ insulator, the −1738 AE1 promoter excised as a BglII/HincII fragment, and the γ-globin gene and 3′insulator, an EcoRV/NdeI fragment from pAC675. The 5.3-kb construct was linearized for transfection with EcoRV and excised by digestion with EcoRV and SalI for microinjection.
The AE1/γ-globin riboprobe was made by digesting the −1738 AE1/γ-globin construct with BamHI and HindIII, blunting the ends, and religating. This probe protects AE1/γ-globin exon 1 and γ-globin exon 2 (205 bp).
The human γ-globin/mouse α-globin riboprobe was the result of a three-part ligation consisting of a 609-bp PstI/KpnI fragment containing exon 2 and flanking sequence from the human γ-globin gene, a 298-bp HincII/KpnI fragment containing exon 2 and flanking sequence from the mouse α1 gene, and pSP72 digested with PstI and EcoRV (9). This probe protects γ-globin exon 2 (223 bp) and mouse α-globin exon 2 (204 bp) mRNA.
To generate the β-sp/mouse α-globin riboprobe, a 232-bp fragment from the 3′ end of the mouse β-spectrin cDNA was amplified by reverse transcription-PCR (RT-PCR) of fetal liver RNA (5′ primer, GCTTAAGGAACGCCAGACTCCAG; 3′ primer, CACACCCTGTCCTCGTCCTGGCC) and cloned into pCR2.1. After sequencing, this fragment was excised with HindIII and EcoRV and added to a three-part ligation that included EcoRV/KpnI-digested pSP72 and a 318-bp HindIII/KpnI fragment containing exon 2 and flanking sequence from the mouse α1 gene. This probe protects fragments of β-sp (232 bp) and mouse α-globin exon 2 (204 bp) mRNA.
To generate the AΕ1/mouse α-globin riboprobe, a 229-bp fragment from the 3′ end of the mouse AE1 cDNA was amplified by RT-PCR of fetal liver RNA (5′ primer, CACAGTGCCTCTCCGTCGTCTCATC; 3′ primer, CCTTCCCCACCCACAGCCATAACAC) and cloned into pCR2.1. After sequencing, this fragment was excised with KpnI and NsiI and added to a three-part ligation that included PstI/EcoRV-digested pSP72 and a 289-bp HincII/KpnI fragment containing exon 2 and flanking sequence from the mouse α1 gene. This probe protects fragments of AE1 (229 bp) and mouse α-globin exon 2 (204 bp) mRNA.
To generate the ank/mouse α-globin riboprobe, a 202-bp fragment from the 3′ end of the mouse ankyrin cDNA was amplified by RT-PCR of fetal liver RNA (5′ primer, CTCCAGCCGGACCTGATAGAG; 3′ primer, GAACACGTGCGACCCTTCAGTAG) and cloned into pCR2.1. After sequencing, this fragment was excised with HindIII and EcoRV and added to a three-part ligation that included EcoRV/KpnI-digested pSP72 and a 318-bp HindIII/KpnI fragment containing exon 2 and flanking sequence from the mouse α1 gene. A 142-bp fragment of the α-globin sequence was removed by digestion with MscI and SmaI and religating. This probe protects fragments of ank (202 bp) and mouse α-globin exon 2 (204 bp) mRNA.
Run-on transcription assays.
Run-on transcription assays were performed essentially as described by Hanson et al. (11). Fetal livers were collected from 13.5-day embryos and dispersed into a single-cell suspension in cold phosphate-buffered saline (4°C) by passage through a 21-gauge needle. Aliquots of 2.5 × 10⁷ cells were suspended in five volumes of cold (4°C) hypotonic lysis buffer (HLB; 10 mM HEPES [pH 8.0], 1.5 mM MgCl2, 10 mM KCl) and incubated on ice for 15 min. After five passages through a 22-gauge needle, nuclei were collected by centrifugation for 10 min at 2,000 × g at 4°C. The nuclei were resuspended in 2 ml of cold (4°C) HLB, and the nuclei were collected by centrifugation at 2,000 × g for 10 min at 4°C. The nuclei were resuspended in 220 μl of transcription buffer (20 mM Tris [pH 8.0], 84 mM KCl, 8 mM NH4OAC, 0.3 mM EDTA, 1 mM dithiothreitol, 10% glycerol, 12 μg of creatine phosphokinase [Sigma, St. Louis, Mo.]/ml, 12 mM creatine phosphate [Sigma], 250 μM ATP, 250 μM CTP, 250 μM GTP [all from Ambion Inc., Austin, Tex.], and 25 μM UTP [Amersham]). The nuclei were incubated for 30 min at 30°C. RNA was extracted with TriZol reagent according to the manufacturer's specifications (Gibco BRL, Life Technologies, Inc., Grand Island, N.Y.). The precipitated RNA was used as a probe on slot blot filters containing 5 μg of linearized plasmid DNA with similar-sized fragments from the mouse α-spectrin (α-sp), β-sp, ankyrin, AE1, α-globin, and β-globin genes along with empty plasmid vector sequences. The filters were hybridized overnight and washed before PhosphorImager (Molecular Dynamics) analysis.
Transient-transfection assays.
For the luciferase assays, all plasmids tested were purified using Qiagen columns (Qiagen, Inc., Chatsworth, Calif.) or cesium chloride plasmid purification, and at least two preparations of each plasmid were tested in triplicate. Aliquots of 107 K562 cells were transfected by electroporation with a single pulse of 300 V at 960 μF with 20 μg of test plasmid and 0.5 μg of pCMVβ, a mammalian reporter plasmid expressing β-galactosidase driven by the human cytomegalovirus immediate-early gene promoter (Clontech, Palo Alto, Calif.) (8, 10). Aliquots of 105 HeLa cells were transfected with 2.0 μg of test plasmid and 0.25 μg of the pCMVβ plasmid by lipofection using 4 μl of Lipofectamine (Gibco Invitrogen Corp., Carlsbad, Calif.). Twenty-four hours after transfection, cells were harvested and lysed, and the luciferase and β-galactosidase activities were determined in cell extracts. All assays were performed in triplicate. The level of β-galactosidase activity was used to correct for differences in transfection efficiency. For the analysis of the AE1 transgenes in K562 cells, all plasmids were purified from cesium chloride gradients. Aliquots of 107 K562 cells were transfected by electroporation with a single pulse of 300 V at 960 μF with 20 μg of test plasmid and 0.5 μg of pCMVβ. Forty-eight hours after transfection, cells were harvested and RNA was prepared using TriZol reagent according to the manufacturer's specifications (Gibco BRL, Life Technologies, Inc.). The level of β-galactosidase activity was used to confirm equivalent transfection in each group.
Generation of transgenic mice.
Transgenic mice were generated as described by Hogan et al. (16). Fertilized eggs were collected from superovulated FVB/N female mice (Taconic Farms, Germantown, N.Y.) approximately 9 h after mating to CBy6F1 male mice (Jackson Laboratory, Bar Harbor, Maine). Fragments for microinjection were separated on an agarose gel, electroeluted, and purified with an Elutip-d minicolumn (Schleicher & Schuell, Inc., Keene, N.H.). The fragments were diluted to a concentration of 2 ng/ml in 10 mM Tris, 0.25 mM EDTA (pH 7.5), and ∼2 pl was injected into the male pronucleus of fertilized eggs. The injected eggs were transferred to pseudopregnant CByB6/F1 foster mothers. Founder animals were identified by Southern analysis of DNA extracted from tail biopsies by probing with a γ-globin probe. Founder animals were crossed to FVB/N mice for propagation and developmental studies.
Analysis of transgene copy number.
Copy number was determined by comparing transgenic mouse DNA to K562 DNA and DNA from previously published ankyrin/γ-globin transgenic mice carrying 1, 4, and 12 copies of the transgene with Southern blotting (34). Copy numbers were determined using a Molecular Dynamics PhosphorImager. Statistical analysis of copy number and expression data was performed by linear regression with the Graph Pad Prism version 2.0 software.
Isolation of RNA.
Reticulocytes were obtained by collecting 200 μl of blood from phlebotomized animals. Tissues were collected from anesthetized animals perfused with 25 to 40 ml of saline and stored in liquid nitrogen. Total cellular RNA was extracted from adult reticulocytes, 10.5-day embryo blood cells, 13.5-day fetal livers, and tissues using TriZol reagent according to the manufacturer's specifications (Gibco BRL, Life Technologies, Inc.).
RNase protection assays.
Linear DNA templates for the RNase protection assay were prepared by BglII (human γ-globin/mouse α-globin, mouse β-spectrin/mouse α-globin, mouse ankyrin/mouse α-globin, and mouse AE1/mouse α-globin) or EcoRI (AE1/γ-globin) digestion of cesium chloride-purified plasmid preparations. The templates were purified by agarose gel electrophoresis and purified using a Geneclean II kit (Bio 101, Inc., Vista, Calif.). 32P-labeled RNA probes were transcribed using the MAXIscript in vitro transcription kit (Ambion, Inc.). The hybridization of the probe and the RNA (200 ng for analysis of reticulocyte, yolk sac, fetal liver, and spleen RNA; 10 μg of RNA from nonerythroid tissues; 15 μg of RNA from transfected K562 cells) was carried out overnight according to the standard procedure of RPA II of the RNase protection assay kit (Ambion, Inc.). Linear template for mouse actin mRNA was provided with the kit. RNase digestion was performed using an RNase A-RNase T1 mixture in RNase digestion buffer (Ambion, Inc.), and the protected fragments were separated on an 8% nondenaturing polyacrylamide gel (SEQUAGEL-8; National Diagnostics, Atlanta, Ga.).
Analysis of mRNA levels.
The level of ank/Aγ mRNA was estimated using a Molecular Dynamics PhosphorImager (Amersham Pharmacia Biotech, Piscataway, N.J.). The relative amounts of the bands for human γ-globin exon 2 (223 bp) and mouse α-globin exon 2 (204 bp) were calculated by the following formula: [(amount of γ-globin RNA/transgene copy number)/(amount of mouse α-globin RNA)] × 100.
Immunofluorescence analysis.
Peripheral blood cells were prepared as described previously (8, 37). Red blood cells were collected from transgene-positive animals and transgene-negative littermate controls in heparinized capillary tubes. Freshly collected cells were fixed in ice-cold (4°C) 4% formaldehyde solution. The cells were washed with 1:1 acetone-water (−20°C), acetone (−20°C), and 1:1 acetone-water (−20°C) and resuspended in Hank's balanced salt solution-2% fetal bovine serum at 4°C to which a fluorescein isothiocyanate (FITC)-conjugated human HbF antibody (Perkin-Elmer Life Science, Norton, Ohio) was added to a final dilution of 1:40. The cells were incubated with the antibody for 30 min at 4°C and washed two times in Hank's balanced salt solution-2% fetal bovine serum (4°C). The proportion of FITC-positive cells was determined by flow cytometry using a Becton Dickinson (Franklin Lakes, N.J.) FACSCalibur instrument.
RESULTS
Analysis of red cell membrane protein RNA transcription in mouse fetal liver nuclei.
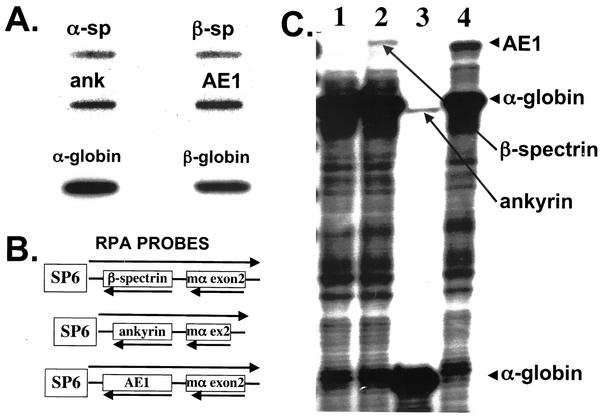
Mouse fetal liver cells at day 13.5 of gestation are greater than 80% erythroid cells at late stages of maturation (29). We labeled fetal liver nuclear RNA with 32P-labeled ribonucleosides and used the labeled RNA as a probe on slot blots containing sequences from the 3′ ends of the red cell membrane protein genes α-spectrin (α-sp), β-sp, ank, and AE1 as well as sequences from the mouse α- and β-globin genes. As expected, the nascent globin transcripts were present at the highest levels. The α-sp and β-sp transcripts were produced at similar levels, approximately 1 to 2% of either of the globin transcripts. The ankyrin transcripts were more abundant, approximately 6% of the level of either of the globin transcripts, while the AE1 transcript was present at approximately 20% of the level of either of the globin transcripts (Fig. 1A and Table 1).
FIG. 1.
Transcription and steady-state levels of erythroid mRNAs in 13.5-day mouse fetal liver cells. (A) Run-on transcription assay. Fetal liver nuclei were incubated with 32P-labeled nucleosides, and the mRNA was used as a probe for a slot blot containing 5 μg of the indicated plasmid DNA, followed by autoradiography. The exposure time for the panel depicting four membrane protein gene transcripts was approximately fivefold longer than the exposure time for the panel depicting the α- and β-globin transcripts. (B) Double RNase protection assay probes containing fragments of the β-spectrin, ankyrin, and AE1 genes fused to a fragment containing exon 2 of the mouse α-globin gene. (C) RNase protection analysis of the steady-state levels of β-spectrin, ankyrin, and AE1 mRNA in 13.5-day fetal liver RNA. In each assay, 400 ng of RNA was hybridized to labeled riboprobes for α-globin (lane 1), β-spectrin/α-globin (lane 2), ankyrin/α-globin (lane 3), and AE1/α-globin (lane 4). The band sizes are 204 bp for α-globin (lanes 1, 2, and 4), 114 bp for α-globin (lane 3), 232 bp for β-spectrin (lane 2), 202 bp for ankyrin (lane 3), and 229 bp for AE1 (lane 4).
TABLE 1.
Transcription and steady-state levels of erythroid mRNAs in 13.5-day mouse fetal liver cellsa
| Gene | Relative RNA level
|
|
|---|---|---|
| Run-on transcription assay | RNase protection assay | |
| α-Globin | 1.0 | 1.0 |
| α-Spectrin | 0.018 ± 0.003 | NDb |
| β-Spectrin | 0.020 ± 0.006 | 0.009 ± 0.001 |
| Ankyrin | 0.063 ± 0.011 | 0.016 ± 0.004 |
| AE1 | 0.196 ± 0.025 | 0.086 ± 0.011 |
The data are from three independent experiments.
ND, not determined.
Analysis of the steady-state levels of red cell membrane protein mRNA in mouse fetal liver cells.
To measure the steady-state levels of the endogenous AE1, β-sp, and ank mRNA, we generated a set of “double riboprobes.” These riboprobes contain DNA sequences from the 3′ ends of either the AE1, β-sp, or ank mRNAs fused to a DNA sequence containing exon 2 of the α-globin gene. Because the ankyrin sequence and mouse α-globin exon 2 are similar in size, 137 bp of mouse α-globin genomic sequence was deleted so that the protected mouse α-globin fragment was reduced to 114 bases (Fig. 1B). RNase protection analysis of mouse fetal liver RNA demonstrated that the β-sp mRNA was the least abundant, at approximately 1% of the level of mouse α-globin mRNA, while the ank mRNA was present at twofold-higher levels. The AE1 mRNA was present at levels that were approximately 10% of the level of α-globin mRNA (Fig. 1C and Table 1). We attribute the differences between the results of the run-on transcription and RNase protection assays to differences in posttranscriptional processing of the RNAs and the increased stability of α-globin mRNA (38, 39, 40).
Analysis of AE1 promoter activity in transient-transfection assays.
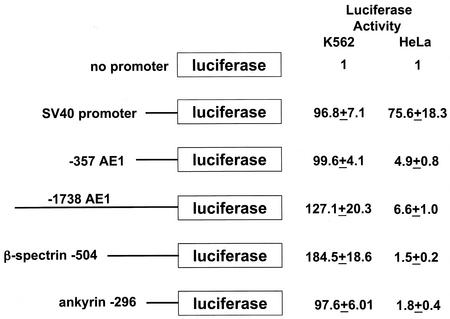
An AE1 promoter extending from −357 to +9 (−357 AE1) and an AE1 promoter extending from −1738 to +9 (−1738 AE1) were each fused to the luciferase reporter gene. We compared the level of luciferase expression from these two constructs to our previously characterized β-sp/luciferase and ank/luciferase constructs by transient-transfection assays in K562 cells. All promoters expressed 90-fold-higher levels of luciferase than a promoterless reporter gene in K562 cells (Fig. 2). In contrast to the results of the run-on transcription assays, the β-sp promoter directed the highest levels of luciferase expression (P < 0.03) (Fig. 2). The levels of luciferase expression from the −357 AE1, −1738 AE1, and ank promoters were not significantly different. When transfected into nonerythroid HeLa cells, the −357 AE1, −1738 AE1, β-sp, and ank promoters all directed significantly less luciferase expression than the simian virus 40 promoter (P < 0.001), indicating erythroid specificity for all four promoters (Fig. 2) (7, 9).
FIG. 2.
Comparison of the promoters of red cell membrane protein genes in K562 cell transient-transfection assays. The promoterless construct (top) was used to compare the activities of the indicated promoters. The 5′ ends of the promoters are indicated. The promoters were joined to the luciferase gene at positions +9 for AE1, +77 for β-spectrin, and −15 for ankyrin. The relative luciferase activities for each construct in K562 and HeLa cells are shown at the right. The data represent the mean and standard deviation from three independent experiments.
Analysis of AE1 promoter activity in transgenic mice.
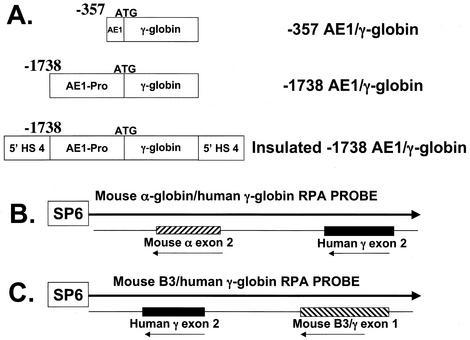
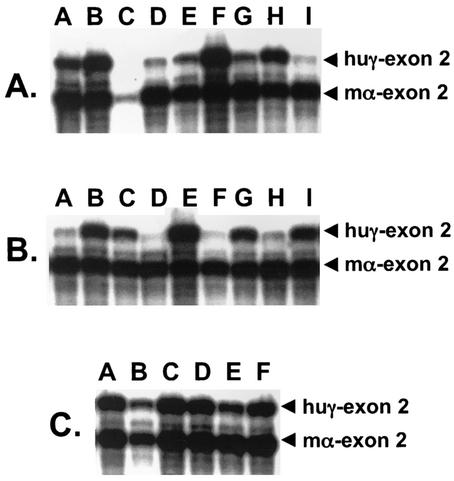
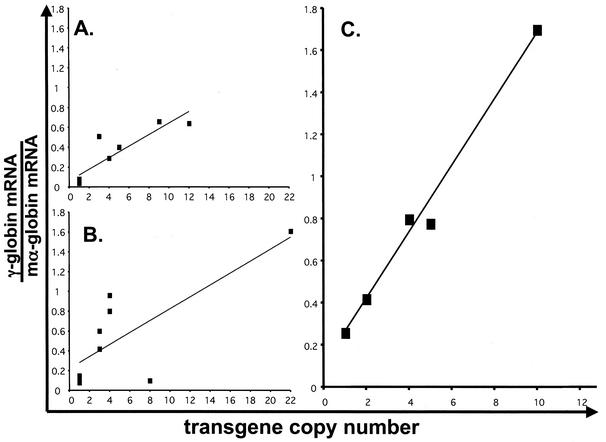
To evaluate the activity of the AE1 promoter in transgenic mice, the −357 AE1 and −1738 AE1 promoters were fused to the human γ-globin reporter gene (Fig. 3A). A total of nine lines of −357 AE1/γ-globin transgenic mice were generated with estimated transgene copy numbers ranging from 1 to 12. To compare the level of transgene mRNA directly to the level of total mouse α-globin mRNA, we generated a double riboprobe containing DNA sequences from human γ-globin exon 2 fused to DNA sequences from mouse α-globin exon 2 (Fig. 3B). RNase protection analysis of reticulocyte RNA from −357 AE1/γ-globin transgenic mice demonstrated transgene mRNA in all nine lines, averaging 7.33% ± 4.0% (mean ± standard deviation) of total mouse α-globin mRNA (Fig. 4A and Table 2). When the level of human γ-globin mRNA was plotted against the estimated transgene copy number, there was a significant correlation between transgene copy number and the level of transgene mRNA (Fig. 5A) (P = 0.001).
FIG. 3.
Constructs used to generate and analyze AE1 promoter activity in transgenic mice. (A) AE1/γ-globin transgenes were generated by fusing the long and short AE1 promoters to the γ-globin gene, preserving the γ-globin ATG initiation site. The 5′ ends of the AE1 promoter are indicated, and the 3′ end is +9. In the lower construct the −1738 AE1/γ-globin construct is flanked by the 1.2-kb insulator element from 5′HS4 of the chicken β-globin gene cluster. (B) Double RNase protection assay probe containing fragments of exon 2 from the human γ-globin and mouse α-globin genes. This probe protects fragments of 223 bp (γ-globin) and 204 bp (α-globin). (C) RNase protection assay probe containing a fragment of the −1738 AE1/γ-globin transgene. This probe protects a fragment of 205 bp (γ-globin exon 2) and maps exon 1 and the start sites in the AE1 promoter.
FIG. 4.
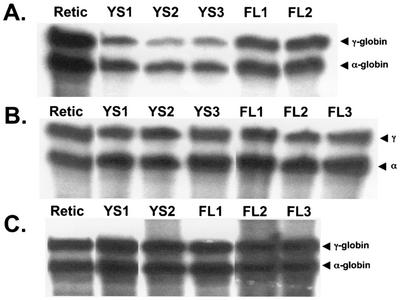
RNase protection analysis of transgene mRNA levels in reticulocytes of AE1/γ-globin transgenic mice using the γ-globin/mouse α-globin riboprobe (Fig. 3B). In each lane, 200 ng of RNA was analyzed. The bands corresponding to human γ-globin (223 bp) and mouse α-globin (204 bp) are indicated. (A) Analysis of RNA from −357 AE1/γ-globin transgenic mice. (B) Analysis of RNA from −1738 AE1/γ-globin transgenic mice. (C) Analysis of RNA from insulated −1738 AE1/γ-globin transgenic mice. The letters above the panels indicate the line of transgenic mice.
TABLE 2.
Analysis of transgene mRNA and protein expression in AE1/γ-globin transgenic miceb
| Construct and line | Transgene copy no. | γ-Globin mRNA/ α-globin mRNA per transgene copya | ∼% γ-globin- positive cells |
|---|---|---|---|
| −357 AE1 | |||
| A | 5 | 0.08 | 63 |
| B | 12 | 0.0533 | 100 |
| C | 1 | 0.05 | 35 |
| D | 1 | 0.04 | 100 |
| E | 4 | 0.0725 | 68 |
| F | 9 | 0.0733 | 100 |
| G | 1 | 0.08 | 100 |
| H | 3 | 0.17 | 45 |
| I | 1 | 0.04 | 53 |
| Mean | 0.0733 ± 0.04 | ||
| −1738 AE1 | |||
| A | 1 | 0.15 | 67 |
| B | 4 | 0.20 | 32 |
| C | 3 | 0.14 | 25 |
| D | 1 | 0.08 | 74 |
| E | 22 | 0.0733 | 23 |
| F | 1 | 0.12 | 18 |
| G | 4 | 0.24 | 86 |
| H | 8 | 0.0125 | 03 |
| I | 3 | 0.20 | 93 |
| Mean | 0.135 ± 0.07* | ||
| Insulated −1738 AE1 | |||
| A | 10 | 0.17 | 100 |
| B | 1 | 0.26 | 100 |
| C | 4 | 0.20 | 100 |
| D | 4 | 0.20 | 100 |
| E | 2 | 0.21 | 100 |
| F | 5 | 0.156 | 100 |
| Mean | 0.198 ± 0.03** |
*, significantly higher than −357 AE1 mRNA level (P = 0.04). **, significantly higher than −357 AE1 mRNA level (P = 0.0001); not significantly higher than −1738 AE1 mRNA level (P = 0.07).
All values represent analysis of at least two different RNA samples from each line.
FIG. 5.
Analysis of transgene mRNA level and transgene copy number. The x axis represents the transgene copy number determined by Southern blot analysis. The y axis represents the amount of γ-globin mRNA divided by the amount of mouse α-globin mRNA in reticulocytes, as determined by RNase protection. The lines represent the best-fit correlation. (A) Analysis of −357 AE1/γ-globin transgenic mice (R2 = 0.7866; P = 0.001). (B) Analysis of −1738 AE1/γ-globin transgenic mice (R2 = 0.6014; P = 0.03). (C) Analysis of insulated −1738 AE1/γ-globin transgenic mice (R2 = 0.9829; P = 0.0001).
A total of nine lines of −1738 AE1/γ-globin transgenic mice were generated with estimated transgene copy numbers ranging from 1 to 22. RNase protection analysis of reticulocyte RNA from −1738 AE1/γ-globin transgenic mice demonstrated higher levels of transgene mRNA in all nine lines compared to −357 AE1/γ-globin transgenic mice (Fig. 4B and Table 2), averaging 13.5% ± 7.0% of total mouse α-globin mRNA (P = 0.04). When the level of human γ-globin mRNA was plotted against the estimated transgene copy number, there was a significant correlation between transgene copy number and the level of transgene mRNA (Fig. 5B) (P = 0.03). Because we observed expression in all 18 lines, we conclude that the AE1 promoter is resistant to severe position effects.
Yolk sac-derived nucleated blood cells and fetal liver erythroid cells were collected from 10.5-day and 13.5-day transgenic embryos carrying the −357 AE1/γ-globin and −1738 AE1/γ-globin transgenes. RNase protection analysis demonstrated that mRNA from both the −357 AE1/γ-globin and −1738 AE1/γ-globin transgenes was detected in yolk sac- and fetal liver-derived red blood cells at levels similar to that observed in adult reticulocyte RNA in four lines of −357 AE1/γ-globin (Fig. 6A) and three lines of −1738 AE1/γ-globin (Fig. 6B) transgene groups analyzed. We conclude that the −357 AE1 and −1738 AE1 promoters are active at all developmental stages.
FIG. 6.
RNase protection analysis of transgene mRNA levels in yolk sac, fetal liver, and reticulocytes of AE1/γ-globin transgenic mice using the γ-globin/mouse α-globin riboprobe (Fig. 3B). In each lane, 200 ng of RNA was analyzed. The bands corresponding to human γ-globin (223 bp) and mouse α-globin (204 bp) are indicated. (A) Analysis of RNA from −357 AE1/γ-globin transgenic mice (line B). (B) Analysis of RNA from −1738 AE1/γ-globin transgenic mice (line G). (C) Analysis of RNA from insulated −1738 AE1/γ-globin transgenic mice (line D). Retic, reticulocyte RNA; YS, yolk sac RNA; FL, fetal liver RNA. The numbers refer to different animals in the same litter.
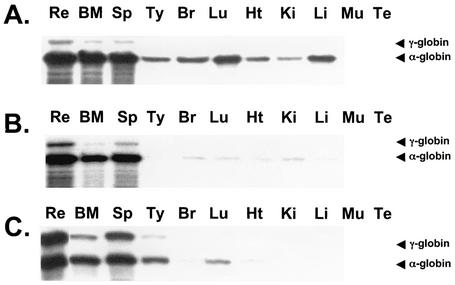
Transgene-positive adult mice from four lines of −357 AE1/γ-globin and three lines of −1738 AE1/γ-globin transgenic mice were perfused with saline to remove peripheral blood red cells before collection of tissues for RNA extraction. The human γ-globin/mouse α-globin riboprobe was used to analyze these RNA samples for γ-globin mRNA and the level of α-globin mRNA caused by red blood contamination. High levels of γ-globin mRNA were observed in the bone marrow and spleen of transgenic mice, but γ-globin mRNA was absent or detected at low levels in all other tissues (Fig. 7A and B). In those tissues where γ-globin mRNA was detected, mouse α-globin mRNA was also detected. The ratio of mouse α-globin to AE1/γ-globin mRNA was similar to that observed in reticulocyte RNA, indicating that the presence of the low levels of γ-globin mRNA was most likely due to residual contamination with red blood cells. β-Actin mRNA was detected in all tissues, including those in which γ-globin mRNA and/or mouse α-globin was not detected (data not shown).
FIG. 7.
RNase protection analysis of transgene mRNA levels in erythroid and nonerythroid tissues of AE1/γ-globin transgenic mice using the γ-globin/mouse α-globin riboprobe (Fig. 3B). Aliquots of 200 ng of reticulocyte (Re), bone marrow (BM), and spleen (Sp) RNA and 10 μg of RNA from thymus (Ty), brain (Br), lung (Lu), heart (Ht), kidney (Ki), liver (Li), and testes (Te) were analyzed. The bands corresponding to human γ-globin (223 bp) and mouse α-globin (204 bp) are indicated. (A) Analysis of RNA from a −357 AE1/γ-globin transgenic mouse (line D). (B) Analysis of RNA from a −1738 AE1/γ-globin transgenic mouse (line B). (C) Analysis of RNA from an insulated −1738 AE1/γ-globin transgenic mouse (line C).
Analysis of γ-globin protein in individual red blood cells of transgenic mice.
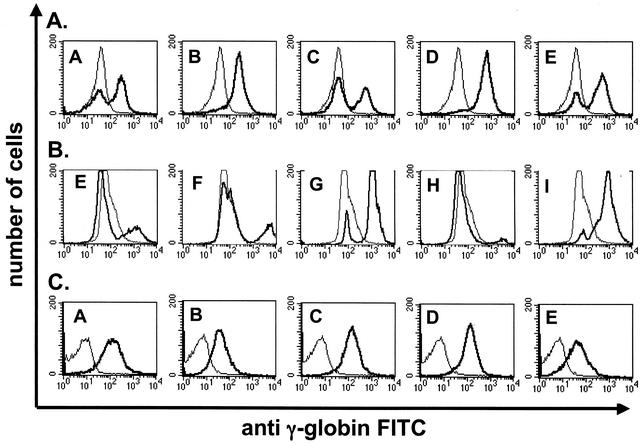
A monoclonal antibody against human γ-globin was used to estimate the relative number of red blood cells expressing γ-globin protein in transgene-positive animals from all nine lines of −357 AE1/γ-globin transgenic mice. We observed that five of nine lines of −357 AE1/γ-globin transgenic mice expressed the transgene in a variegated fashion (Fig. 8A and Table 2). The relative number of γ-globin-positive cells ranged from 22 to 100% of circulating erythrocytes (Fig. 8A and Table 2). Fluorescence-activated cell sorter (FACS) analysis of antibody-stained red blood cells demonstrated that nine of nine lines of −1738 AE1/γ-globin transgenic mice expressed the transgene in a variegated fashion, with the relative number of γ-globin-positive cells ranging from 3 to 93% of circulating erythrocytes (Fig. 8B and Table 2).
FIG. 8.
FACS analysis of γ-globin protein in red blood cells from AE1/γ-globin transgenic mice. Erythrocytes were stained with a FITC-conjugated monoclonal antibody against human γ-globin. The x axis represents the level of FITC detected in individual cells. The y axis represents the number of cells. The narrow lines represent analysis of erythrocytes from a negative control mouse. The heavy lines represent analysis of erythrocytes from AE1/γ-globin transgenic mice. (A) Analysis of −357 AE1/γ-globin transgenic mice. (B) Analysis of −1738 AE1/γ-globin transgenic mice. (C) Analysis of insulated −1738 AE1/γ-globin transgenic mice. The letters in the individual panels indicate the transgenic mouse line.
Analysis of transgenic mice containing the −1738 AE1/ γ-globin transgene flanked by the chicken β-globin insulator element.
In Drosophila models, PEV can be suppressed by flanking the reporter gene with insulator elements (reviewed in references 10 and 41). We hypothesized that the addition of an insulator element to the −1738 AE1/γ-globin transgene would suppress the PEV associated with the AE1/γ-globin transgenes. Since the chicken β-globin insulator element suppresses PEV of transgenes in cultured erythroid cells (31), we flanked the −1738 AE1/γ-globin transgene with a 1.2-kb fragment of the chicken β-globin HS4 containing the insulator activity (2, 5) (Fig. 3A). A total of six lines of −1738 AE1/γ-globin transgenic mice were generated with estimated transgene copy numbers ranging from 1 to 10. RNase protection analysis of reticulocyte RNA from the insulated −1738 AE1/γ-globin transgenic mice demonstrated high levels of transgene mRNA in all six lines, averaging 19.8% ± 0.03% of total mouse α-globin mRNA (Fig. 4C and Table 2). While this mRNA level was significantly higher than that of −357 AE1/γ-globin transgenic mice (P = 0.0001), the difference in the level of γ-globin mRNA between the insulated and uninsulated −1738 AE1/γ-globin transgenic mice was not significant (P = 0.07). When the level of human γ-globin mRNA was plotted against the estimated transgene copy number, there was a significant correlation between transgene copy number and the level of transgene mRNA (P = 0.0001) (Fig. 5C).
The insulated −1738 AE1/γ-globin mRNA was present in erythroid cells of 10.5- and 13.5-day embryos from all three lines examined at levels similar to those observed in adult reticulocyte RNA (Fig. 6C). Only background levels of γ-globin mRNA were detected in the nonerythroid tissues of three lines of insulated −1738 AE1/γ-globin transgenic mice examined (Fig. 7C). All six lines of insulated −1738 AE1/γ-globin transgenic mice expressed γ-globin protein in 100% of circulating red blood cells (Fig. 8C and Table 2). We conclude that the chicken insulator element confers uniform, copy-number-dependent expression on the AE1 promoter.
Effects of the 5′HS4 insulator on mRNA initiation sites.
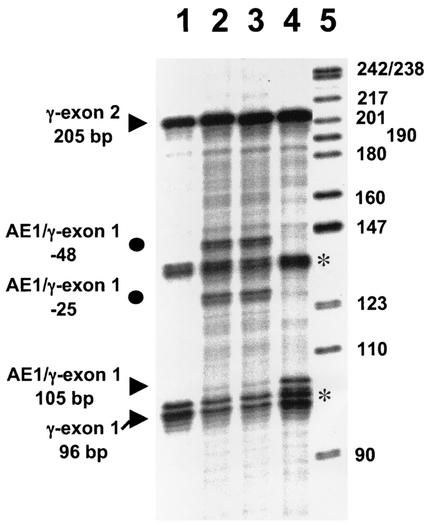
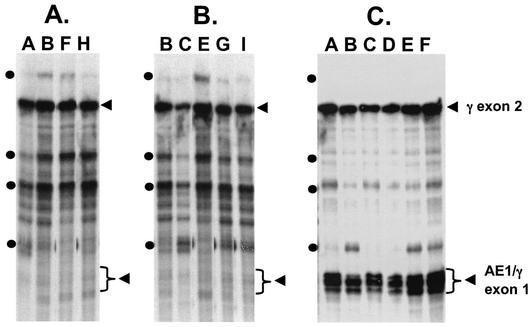
Using a riboprobe spanning exons 1 and 2 of the AE1/γ-globin gene (Fig. 3B), we analyzed the splicing and initiation of the AE1/γ-globin mRNA in transiently transfected K562 cells and in transgenic mice. In both K562 cells and in transgenic mice, intron 1 of RNA transcribed from either the uninsulated −357 AE1/γ-globin or −1738 γ-globin genes was appropriately spliced. However, the 5′ end of the −357 AE1/γ-globin and −1738 AE1/γ-globin mRNAs mapped to positions −48 and −25 and positions −145, −48, −25, and −7 relative to the major +1 initiation site previously identified by Kopito et al. (21) in either K562 cells (Fig. 9, lanes 2 and 3) or in reticulocyte mRNA of transgenic mice (Fig. 10A and B), respectively. No transcripts from the uninsulated transgenes were initiated at the +1 initiation site in either K562 cells or transgenic mice. In contrast, RNase protection analysis demonstrated that the insulated −1738 AE1/γ-globin mRNA was spliced appropriately and initiated at the +1 initiation site in both K562 cells (Fig. 9, lane 4) and reticulocyte mRNA from transgenic mice (Fig. 10C). We conclude that the chicken 5′HS4 insulator element is required for the efficient use of the +1 AE1 transcription initiation site.
FIG. 9.
Mapping the transcription initiation sites in mRNA extracted from K562 cells 48 h after transfection with the AE1/γ-globin transgenes used to generate transgenic mice, using the AE1/γ-globin riboprobe (Fig. 3C). In lanes 1 to 4, 15 μg of RNA was analyzed. The bands corresponding to human γ-globin exon 2 (205 bp) from both the transgene and the endogenous γ-globin mRNA in K562 cells and endogenous γ-globin exon 1 (96 bp) are indicated by arrowheads along with the expected length of exon 1 from the AE1/γ-globin gene (105 bp). Additional bands consistent with initiation at positions −48 and −25 in the AE1/γ-globin transgene are indicated by circles. The asterisks indicate bands that are present when RNA from untransfected K562 cells is analyzed. Lane 1, analysis of RNA from untransfected K562 cells; lane 2, analysis of RNA from K562 cells transfected with −357 AE1/γ-globin; lane 3, analysis of RNA from K562 cells transfected with −1738 AE1/γ-globin, lane 4, analysis of RNA K562 cells transfected with insulated −1738 AE1/γ-globin; lane 5, size markers.
FIG. 10.
Mapping the transcription initiation sites in reticulocyte mRNA from AE1/γ-globin transgenic mice using the AE1/γ-globin riboprobe (Fig. 3C). In each lane, 400 ng of RNA was analyzed. The band corresponding to human γ-globin exon 2 (205 bp) and the expected length of AE1/γ-globin exon 1 (105 bp) are indicated by arrowheads. Circles represent bands consistent with initiation at positions −145, −48, −25, and −7 of the AE1/γ-globin gene from top to bottom, respectively. (A) Analysis of RNA from −357 AE1/γ-globin transgenic mice. (B) Analysis of RNA from −1738 AE1/γ-globin transgenic mice. (C) Analysis of RNA from insulated −1738 AE1/γ-globin transgenic mice. The length of exon 1 predicts that the major transcription initiation site is position +1 of the AE1 promoter. The letters above the panels indicate the line of transgenic mice.
DISCUSSION
Peters et al. (29) have shown that greater than 80% of 12- to 14-day fetal liver cells are late-stage erythroblasts, which allowed us to compare RNA transcription and the steady-state levels of α- and β-spectrin, ankyrin, and AE1 mRNA in late-stage erythroid cells. Several studies of cultured virus-infected cells or enriched human erythroid progenitor cells have shown that α- and β-spectrin mRNA and protein appear at the earliest stages of erythropoiesis and that the levels of these mRNAs and proteins decline as the cells mature. In contrast, the levels of the mRNA and protein for ankyrin and AE1 increase during the middle stages of erythropoiesis, reaching their highest levels at the terminal stages of erythroid maturation (12, 13, 22, 42). Similar to the in vitro studies, we found that the levels of ankyrin and AE1 mRNA transcription are higher than those of α- and β-spectrin in primary late-stage erythroid cells in vivo. These data support the interpretation that regulation of the α- and β-spectrin, ankyrin, and AE1 mRNA levels occurs at the transcriptional level (12, 13, 22).
Two promoters for the AE1 gene have been described, the erythroid promoter utilized in our studies and a second promoter located between exon 3 and exon 4 of the AE1 gene that directs a kidney-specific transcript (19, 21, 23). Our investigators have previously shown that the ankyrin promoter directs uniform, position-independent, copy-number-dependent expression of the γ-globin transgene (34). By attaching a γ-globin transgene to the erythroid AE1 promoter, we controlled for differences in mRNA stability and could directly compare the output of the ankyrin and AE1 promoters in transgenic mice to the transcription rate of the endogenous genes. Our results show that the levels of both ank/γ-globin (8, 34) and insulated AE1/γ-globin mRNA correlate closely with the transcription rate of the endogenous ankyrin and AE1 genes. Our data indicate that the sequences between −357 and +9 of the erythroid AE1 promoter are sufficient to direct erythroid-specific expression of the AE1 gene. Although the −1738 promoter directed higher levels of mRNA, it may be that the extreme variegation observed in the −1738 AE1/γ-globin animals, or the uniform expression in some −357 AE1/γ-globin transgenic lines and the less extreme variegation observed among the other −357 AE1/γ-globin transgenic lines, may be responsible for the significant difference in mRNA levels.
The level of transgene mRNA from the uninsulated −357 and −1738 AE1/γ-globin as well as the insulated −1738 AE1/γ-globin transgenes showed a significant correlation with transgene copy number. However, when the slopes of the regression analyses were compared, only the insulated −1738 AE1/γ-globin construct showed a doubling (98.3% increase) of the mRNA level when the transgene copy number doubled. In contrast, the −357 and −1738 AE1/γ-globin constructs showed approximately 79 and 60% increases, respectively, as the transgene copy number doubled. In addition, there was no correlation between the amount of AE1/γ-globin mRNA and the relative number of cells expressing γ-globin. We attribute the lack of strict copy-number-dependent mRNA levels and the lack of correlation between mRNA level and the relative number of γ-globin-positive cells to the wide degree of variation caused by position effects. We conclude that the strict correlation between the transgene mRNA level and transgene copy number and the uniform expression of γ-globin observed in the insulated −1738 AE1/γ-globin transgenic mice is due to the suppression of PEV by the 5′HS4 insulator element. Our data also suggest that the endogenous mouse AE1 locus would contain one or more insulator elements. We are currently screening the endogenous AE1 locus for DNase I-hypersensitive sites, which we intend to evaluate in insulator assays (2, 5, 31).
Of the two insulator properties of chicken 5′HS4, enhancer blocking (2, 5, 15) and suppression of PEV (31), we were able to demonstrate highly effective suppression of PEV associated with the −1738 AE1 promoter in transgenic mice. Although the ability of insulator elements to suppress PEV and the proteins required to suppress PEV are well documented in both model organisms (10) and vertebrate systems (27, 31), the mechanism by which insulators suppress PEV is not clear. The suppression of PEV in cultured erythroid cells is associated with hyperacetylation of histones and suppression of DNA methylation in the promoter region of the reporter gene, but the transcriptional start sites have not been examined. Four lines of −357 AE1/γ-globin mice showed uniform expression with multiple upstream start sites. It is possible that low-level, properly initiated transcripts allow γ-globin to be present in all cells, but we were unable to demonstrate any significant levels of properly initiated AE1/γ-globin mRNA in any of the uninsulated lines. Our data indicate that at least for the AE1 promoter, PEV strongly correlates with the initiation of the AE1/γ-globin mRNA transcripts upstream of the transcription initiation site of the endogenous AE1 mRNA. It is hypothesized that histone acetylation and hypomethylation increase transcription factor binding to the promoter of the reporter gene (27). Taken together, the data suggest that increased transcription factor binding facilitates the use of the endogenous AE1 start site, thereby increasing the probability that the transgene will be expressed in all cells.
Because we observed that 5′HS4 increased the use of the endogenous mRNA transcription start site in both transient-transfection assays and in transgenic mice, we feel that the effects of 5′HS4 on the use of the transcription start sites were not dependent on the reporter gene being inserted into chromatin. To our knowledge, these results represent the first example of insulator-mediated changes in the transcription initiation site associated with the suppression of PEV.
Acknowledgments
We thank Kenneth Sahr for the gift of the AE1 promoter fragment. We thank Bernard G. Forget for helpful discussions and Douglas Nilson for expert technical assistance.
This work was supported in part by HL65448 (P.G.G.).
REFERENCES
- 1.Bell, A. C., and G. Felsenfeld. 2000. Methylation of a CTCF-dependent boundary controls imprinted expression of the Igf2 gene. Nature 405:482-485. [DOI] [PubMed] [Google Scholar]
- 2.Bell, A. C., A. G. West, and G. Felsenfeld. 1999. The protein CTCF is required for the enhancer blocking activity of vertebrate insulators. Cell 98:387-396. [DOI] [PubMed] [Google Scholar]
- 3.Bennett, V., and P. J. Stenbuck. 1980. Association between ankyrin and the cytoplasmic domain of AE1 isolated from the human erythrocyte membrane. J. Biol. Chem. 255:6424-6432. [PubMed] [Google Scholar]
- 4.Benz, E. J., Jr. 1994. The erythrocyte membrane and cytoskeleton: structure, function, and disorders, p. 257-292. In G. Stamatoyannoloulos, A. W. Nienhuis, P. W. Majerus, and H. Varmus (ed.), The molecular basis of blood diseases, 2nd ed. Saunders, Philadelphia, Pa.
- 5.Chung, J. H., M. Whiteley, and G. Felsenfeld. 1993. A 5′ element of the chicken beta-globin domain serves as an insulator in human erythroid cells and protects against position effect in Drosophila. Cell 74:505-514. [DOI] [PubMed] [Google Scholar]
- 6.Emery, D. W., E. Yannaki, J. Tubb, and G. Stamatoyannopoulos. 2000. A chromatin insulator protects retrovirus vectors from chromosomal position effects. Proc. Natl. Acad. Sci. USA 97:9150-9155. [DOI] [PMC free article] [PubMed] [Google Scholar]
- 7.Gallagher, P. G., M. Romana, W. T. Tse, S. E. Lux, and B. G. Forget. 2000. The human ankyrin-1 gene is selectively transcribed in erythroid cell lines despite the presence of a housekeeping-like promoter. Blood 96:1136-1143. [PubMed] [Google Scholar]
- 8.Gallagher, P. G., D. E. Sabatino, D. S. Basseres, D. M. Nilson, C. Wong, A. P. Cline, L. J. Garrett, and D. M. Bodine. 2001. Erythrocyte ankyrin promoter mutations associated with recessive hereditary spherocytosis cause significant abnormalities in ankyrin expression. J. Biol. Chem. 276:41683-41689. [DOI] [PubMed] [Google Scholar]
- 9.Gallagher, P. G., D. E. Sabatino, M. Romana, A. P. Cline, L. J. Garrett, D. M. Bodine, and B. G. Forget. 1999. A human beta-spectrin gene promoter directs high level expression in erythroid but not muscle or neural cells. J. Biol. Chem. 274:6062-6073. [DOI] [PubMed] [Google Scholar]
- 10.Gdula, D. A., T. I. Gerasimova, and V. G. Corces. 1996. Genetic and molecular analysis of the gypsy chromatin insulator of Drosophila. Proc. Natl. Acad. Sci. USA 93:9378-9383. [DOI] [PMC free article] [PubMed] [Google Scholar]
- 11.Hanson, R. D., N. L. Connolly, D. Burnett, E. J. Campbell, R. M. Senior, and T. J. Ley. 1990. Developmental regulation of the human cathepsin G gene in myelomonocytic cells. J. Biol. Chem. 265:1524-1530. [PubMed] [Google Scholar]
- 12.Hanspal, M., J. S. Hanspal, R. Kalraiya, S. C. Liu, K. E. Sahr, D. Howard, and J. Palek. 1992. Asynchronous synthesis of membrane skeletal proteins during terminal maturation of murine erythroblasts. Blood 80:530-539. [PubMed] [Google Scholar]
- 13.Hanspal, M., and J. Palek. 1987. Synthesis and assembly of membrane skeletal proteins in mammalian red cell precursors. J. Cell Biol. 105:1417-1424. [DOI] [PMC free article] [PubMed] [Google Scholar]
- 14.Hargreaves, W. R., K. N. Giedd, A. Verkleij, and D. Branton. 1980. Reassociation of ankyrin with AE1 in erythrocyte membranes and in lipid vesicles. J. Biol. Chem. 255:11965-11972. [PubMed] [Google Scholar]
- 15.Hark, A. T., C. J. Schoenherr, D. J. Katz, R. S. Ingram, J. M. Levorse, and S. M. Tilghman. 2000. CTCF mediates methylation-sensitive enhancer-blocking activity at the H19/Igf2 locus. Nature 405:486-489. [DOI] [PubMed] [Google Scholar]
- 16.Hogan, B. L. M., F. Costantini, and E. Lacy. 1986. Manipulating the mouse embryo: a laboratory manual. Cold Spring Harbor Laboratory, Cold Spring Harbor, N.Y.
- 17.Kay, M. M., C. H. Vollard, and C. H. Vollaard. 1996. Human erythroid AE1 “anion exchanger 1” is expressed in transformed lymphocytes. Cell. Mol. Biol. 42:945-952. [PubMed] [Google Scholar]
- 18.Kellum, R., and P. Schedl. 1992. A group of SCS elements function as domain boundaries in an enhancer-blocking assay. Mol. Cell. Biol. 12:2424-2431. [DOI] [PMC free article] [PubMed] [Google Scholar]
- 19.Kim, H. R., B. S. Kennedy, and J. D. Engel. 1989. Two chicken erythrocyte AE1 mRNAs are generated by alternative transcriptional initiation and differential RNA splicing. Mol. Cell. Biol. 9:5198-5206. [DOI] [PMC free article] [PubMed] [Google Scholar]
- 20.Kopito, R. R., M. Andersson, and H. F. Lodish. 1987. Structure and organization of the murine band 3 gene. J. Biol. Chem. 262:8035-8040. [PubMed] [Google Scholar]
- 21.Kopito, R. R., M. A. Andersson, and H. F. Lodish. 1987. Multiple tissue-specific sites of transcriptional initiation of the mouse anion antiport gene in erythroid and renal cells. Proc. Natl. Acad. Sci. USA 84:7149-7153. [DOI] [PMC free article] [PubMed] [Google Scholar]
- 22.Koury, M. J., M. C. Bondurant, and S. S. Rana. 1987. Changes in erythroid membrane proteins during erythropoietin-mediated terminal differentiation. J. Cell. Physiol. 133:438-448. [DOI] [PubMed] [Google Scholar]
- 23.Kudrycki, K. E., and G. E. Shull. 1993. Rat kidney band 3 Cl−/HCO3− exchanger mRNA is transcribed from an alternative promoter. Am. J. Physiol. 264:540-547. [DOI] [PubMed] [Google Scholar]
- 24.Low, P. S. 1986. Structure and function of the cytoplasmic domain of AE1: center of erythrocyte membrane-peripheral protein interactions. Biochim. Biophys. Acta 864:145-167. [DOI] [PubMed] [Google Scholar]
- 25.Lux, S. E., K. M. John, R. R. Kopito, and H. F. Lodish. 1989. Cloning and characterization of AE1, the human erythrocyte anion-exchange protein (AE1). Proc. Natl. Acad. Sci. USA 86:9089-9093. [DOI] [PMC free article] [PubMed] [Google Scholar]
- 26.Morrow, J. S., D. L. Rimm, S. P. Kennedy, C. D. Cianci, J. H. Sinard, and S. A. Weed. 1997. Of membrane stability and mosaics: the spectrin cytoskeleton, p. 485-540. In J. F. Hoffman and J. D. Jamieson (ed.), Handbook of physiology, section 14: cell physiology. Oxford University Press, Oxford, United Kingdom.
- 27.Mutskov, V. J., C. M. Farrell, P. A. Wade, A. P. Wolffe, and G. Felsenfeld. 2002. The barrier function of an insulator couples high histone acetylation levels with specific protection of promoter DNA from methylation. Genes Dev. 16:1540-1554. [DOI] [PMC free article] [PubMed] [Google Scholar]
- 28.Peters, L. L., R. A. Shivdasani, S. C. Liu, M. Hanspal, K. M. John, J. M. Gonzalez, C. Brugnara, B. Gwynn, N. Mohandas, S. L. Alper, S. H. Orkin, and S. E. Lux. 1996. Anion exchanger 1 (AE1) is required to prevent erythrocyte membrane surface loss but not to form the membrane skeleton. Cell 86:917-927. [DOI] [PubMed] [Google Scholar]
- 29.Peters, L. L., R. A. White, C. S. Birkenmeier, M. L. Bloom, S. E. Lux, and J. E. Barker. 1992. Changing patterns in cytoskeletal mRNA expression and protein synthesis during murine erythropoiesis in vivo. Proc. Natl. Acad. Sci. USA 89:5749-5753. [DOI] [PMC free article] [PubMed] [Google Scholar]
- 30.Potts, W., D. Tucker, H. Wood, and C. Martin. 2000. Chicken beta-globin 5′HS4 insulators function to reduce variability in transgenic founder mice. Biochem. Biophys. Res. Commun. 273:1015-1018. [DOI] [PubMed] [Google Scholar]
- 31.Recillas-Targa, F., M. J. Pikaart, B. Burgess-Beusse, A. C. Bell, M. D. Litt, A. G. West, M. Gaszner, and G. Felsenfeld. 2002. Position-effect protection and enhancer blocking by the chicken beta-globin insulator are separable activities. Proc. Natl. Acad. Sci. USA 99:6883-6888. [DOI] [PMC free article] [PubMed] [Google Scholar]
- 32.Richards, S. M., M. E. Jaconi, G. Vassort, and M. Puceat. 1999. A spliced variant of AE1 gene encodes a truncated form of AE1 in heart: the predominant anion exchanger in ventricular myocytes. J. Cell Sci. 112:1519-1528. [DOI] [PubMed] [Google Scholar]
- 33.Sabatino, D. E., A. P. Cline, P. G. Gallagher, L. J. Garrett, G. Stamatoyannopoulos, B. G. Forget, and D. M. Bodine. 1998. Substitution of the human β-spectrin promoter for the human Aγ-globin promoter prevents silencing of a linked human β-globin gene in transgenic mice. Mol. Cell. Biol. 18:6634-6640. [DOI] [PMC free article] [PubMed] [Google Scholar]
- 34.Sabatino, D. E., C. Wong, A. P. Cline, L. Pyle, L. J. Garrett, P. G. Gallagher, and D. M. Bodine. 2000. A minimal ankyrin promoter linked to a human gamma-globin gene demonstrates erythroid specific copy number dependent expression with minimal position or enhancer dependence in transgenic mice. J. Biol. Chem. 275:28549-28554. [DOI] [PubMed] [Google Scholar]
- 35.Sahr, K. E., B. P. Daniels, and M. Hanspal. 1996. Identification of the proximal erythroid promoter region of the mouse anion exchanger gene. Blood 88:4500-4505. [PubMed] [Google Scholar]
- 36.Sahr, K. E., W. M. Taylor, B. P. Daniels, H. L. Rubin, and P. Jarolim. 1994. The structure and organization of the human erythroid anion exchanger (AE1) gene. Genomics 24:491-501. [DOI] [PubMed] [Google Scholar]
- 37.Thorpe, S. J., S. L. Thein, M. Sampietro, J. E. Craig, B. Mahon, and E. R. Huehns. 1994. Immunochemical estimation of haemoglobin types in red blood cells by FACS analysis. Br. J. Haematol. 87:125-132. [DOI] [PubMed] [Google Scholar]
- 38.Wang, X., M. Kiledjian, I. M. Weiss, and S. A. Liebhaber. 1995. Detection and characterization of a 3′ untranslated region ribonucleoprotein complex associated with human α-globin mRNA stability. Mol. Cell. Biol. 15:1769-1777. [DOI] [PMC free article] [PubMed] [Google Scholar]
- 39.Weiss, I. M., and S. A. Liebhaber. 1995. Erythroid cell-specific mRNA stability elements in the alpha 2-globin 3′ nontranslated region. Mol. Cell. Biol. 15:2457-2465. [DOI] [PMC free article] [PubMed] [Google Scholar]
- 40.Weiss, I. M., and S. A. Liebhaber. 1994. Erythroid cell-specific determinants of α-globin mRNA stability. Mol. Cell. Biol. 14:8123-8132. [DOI] [PMC free article] [PubMed] [Google Scholar]
- 41.West, A. G., M. Gaszne, and G. Felsenfeld. 2002. Insulators: many functions, many mechanisms. Genes Dev. 16:271-288. [DOI] [PubMed] [Google Scholar]
- 42.Wickrema, A., S. T. Koury, C. H. Dai, and S. B. Krantz. 1994. Changes in cytoskeletal proteins and their mRNAs during maturation of human erythroid progenitor cells. J. Cell. Physiol. 160:417-426. [DOI] [PubMed] [Google Scholar]
- 43.Winkelmann, J. C., and B. G. Forget. 1993. Erythroid and nonerythroid spectrins. Blood 81:3173-3185. [PubMed] [Google Scholar]


