

Abstract
During the transition from darkness to light, a suite of light sensors guides gene expression, biochemistry, and morphology to optimize acclimation to the new environment. Ultraviolet, blue, red, and far-red light all have demonstrated roles in modulating light responses, such as changes in gene expression and suppression of stem growth rate. However, green wavebands induce stem growth elongation, a response not likely mediated by known photosensors. In this study, etiolated Arabidopsis (Arabidopsis thaliana) seedlings were treated with a short, dim, single pulse of green light comparable in fluence and duration to that previously shown to excite robust stem elongation. Genome microarrays were then used to monitor coincident changes in gene expression. As anticipated, phytochrome A-regulated, nuclear-encoded transcripts were induced, confirming proper function of the sensitive phytochrome system. In addition, a suite of plastid-encoded transcripts decreased in abundance, including several typically up-regulated after phytochrome and/or cryptochrome activation. Further analyses using RNA gel-blot experiments demonstrated that the response is specific to green light, fluence dependent, and detectable within 30 min. The response obeys reciprocity and persists in the absence of known photosensors. Plastid transcript down-regulation was also observed in tobacco (Nicotiana tabacum) with similar temporal and fluence-response kinetics. Together, the down-regulation of plastid transcripts and increase in stem growth rate represent a mechanism that tempers progression of early commitment to the light environment, helping tailor seedling development during the critical process of establishment.
In the developing seedling, the transition from growth in darkness to growth in light is ushered by changes in gene expression, biochemistry, and morphology that support acclimation to the new light environment. The early events of light-mediated development are orchestrated by a suite of photoreceptors that monitor ambient light conditions and appropriately tune gene expression profiles to those that best support seedling emergence. These changes prepare the developing seedling for autotrophy and guide the process of establishment in a given environmental context (Chen et al., 2004).
One of the conspicuous indications of photomorphogenic development is a decrease in stem elongation rate. Ultraviolet, blue, red, and far-red light rapidly and strongly suppress early stem growth rate (Parks et al., 2001). To the contrary, narrow-bandwidth green light (GL) causes a dramatic, rapid, yet transient increase in stem growth rate (Folta, 2004). Growth promotion was observed in the etiolated seedling after 15 min when grown under dim GL (10−1 μmol m−2 s−1) or in response to a short, single pulse of GL (>100 μmol m−2). The increase peaked at approximately 140% of the dark growth rate. Photophysiological and genetic tests indicated that GL-induced growth promotion is likely mediated by an undefined light sensor, as the response persists in all photomorphogenic mutants tested and is an opposite outcome from that observed after activation of known light sensory systems (Folta, 2004).
This GL-specific phenomenon is consistent with classic and recent reports demonstrating effects of GL that counter light-mediated growth, development, or physiology. GL specifically inhibits seedling mass (Went, 1957), plant cell culture growth (Klein, 1964), and elongation during gravitropic stimulation (Klein, 1979) among other responses (Klein, 1992). Contemporary studies have shown that GL can reverse blue and UV-B-induced stomatal opening (Frechilla et al., 2000; Eisinger et al., 2003; Talbott et al., 2003). In all of these cases, the response to GL is in direct opposition to the normal progression of light-mediated processes. These findings are especially curious because phytochromes and cryptochromes readily absorb GL to activate changes consistent with a normal forward photomorphogenic progression (Mandoli and Briggs, 1981; Lin et al., 1995; Shinomura et al., 1996). A compelling hypothesis is that GL simultaneously activates a separate photosensory system that balances photomorphogenic development initiated through excitation of phytochromes and cryptochromes.
This hypothesis is tested in this study using microarray analysis. Because a short, single pulse of GL has a robust and rapid effect on stem elongation, it is likely that the same subtle treatment will induce a limited, specific, and possibly diagnostic change in the etiolated seedling transcriptome. Because the inductive stimulus is slight and the response is rapid, accompanying transcriptome alterations will likely be few, first order, and directly relevant to the coincident physiology or the signaling entities that drive them.
In this report, Affymetrix Arabidopsis GeneChip genome oligonucleotide microarrays were used to monitor gene expression changes that occurred in response to the elongation-exciting GL pulse. The results indicate that GL-induced stem growth is coincident with predictable accumulation of phytochrome A (phyA)-induced nuclear-encoded transcripts, while a suite of plastid-based transcripts normally induced by light is now repressed by light. The microarray results were validated and expanded using RNA gel-blot analyses. Genetic analyses demonstrate that the unique GL effect on plastid transcripts is not excited by blue, red, or far-red light, and the phenomenon persists in the absence of known light sensors. GL induces patterns of gene expression that suggest an active role of a GL-sensing system in balancing the effect of other light sensors, shaping photomorphogenic commitment through the transition from darkness to light.
RESULTS
Gene Expression Is Affected by a Short, Single Pulse of GL
GL-induced stem growth promotion is a rapid and robust response that appears to antagonize the suppressive effects of light on stem growth rate (Folta, 2004). The response is initiated by a short, single pulse of GL and is active within 15 min. The subtle light treatment and precipitant time course allow for temporally focused transcriptome assessment, coincident with the establishment of a rapidly induced growth response. The hypothesis was that very few transcripts would be affected by a short, single, narrow-bandwidth, low-fluence (102 μmol m−2) GL pulse over a short time course. If correct, it would be possible to utilize a small number of arrays and experimental replicates to identify specifically affected transcripts that then could be studied using other traditional methods of expression analysis. Using the Affymetrix ATH1 Arabidopsis Genome GeneChip containing more than 24,000 features (22,746 noncontrol targets), 18,089 transcripts were detected as “present” on at least one of the four microarrays used in these trials. Of these, 1,044 exhibited significant treatment effect (P = 0.01). Two independent replicates provided a robust dataset where significant trends were apparent. As expected, over 96% (P = 0.01) of all transcripts did not exhibit a treatment effect. Of the subset where GL induced a change, the first expectation was that transcripts induced by phytochrome should be detected, as phytochromes are readily activated by low-fluence GL treatment (Mandoli and Briggs, 1981). This prediction was confirmed when these data were compared against previous studies of phytochrome-mediated gene induction (Tepperman et al., 2001, 2004). A synthesis of this analysis is presented in Figure 1A, which represents the phytochrome-inducible transcripts 1 h after a GL pulse. A similar profile is induced by 1 h of far-red or red light treatment (Tepperman et al., 2001, 2004). The plot includes transcripts representing the Hy5, Elip, and Spa1 genes (P < 0.0008). Other transcripts of note are a number of Constans-like transcripts, Fh3, Rpt2, as well as transcripts encoding bHLH and AP2 transcription factors previously shown to be light induced through phyA (Tepperman et al., 2001). Table I presents a sample of the transcripts induced by the GL pulse. The entire set may be observed in Supplemental Data S1.
Figure 1.

Average microarray results from two independent replicates, representing transcripts induced or repressed by GL in 3-d-old, dark-grown seedlings. The relative signal in darkness is compared to the signal detected 1 h after a 102 μmol m−2 pulse of GL, the time and fluence rate previously shown to optimally stimulate stem elongation. For clarity, only phytochrome-inducible (A) and plastid-encoded transcripts (B) are shown.
Table I.
A sample of 14 transcripts induced 1 h after a short 102 μmol m−2 pulse of GL that have been shown to be induced by red or far-red light acting through the phytochrome system (based on Tepperman et al., 2001, 2004)
“Fold change” represents the ratio of signal following the GL pulse relative to the dark signal.
| Probe Set ID | Fold Change | P Value | Transcript |
|---|---|---|---|
| log2 | |||
| 252123_at | 4.56 | 0.003 | Flavanone 3-hydroxylase |
| 258321_at | 4.05 | 0.001 | Elip |
| 266720_s_at | 2.58 | 0.016 | Toc1 |
| 263739_at | 2.55 | 0.001 | CONSTANS B-box zinc-finger family protein |
| 250420_at | 2.26 | 0.001 | bZIP protein Hy5 |
| 266719_at | 2.21 | 0.002 | MYB-related transcription factor (Cca1) |
| 258497_at | 2.13 | 0.003 | CONSTANS-like 2 |
| 255694_at | 2.00 | 0.004 | bHLH T-16 |
| 264057_at | 1.92 | 0.001 | AP2 domain protein RAP2.7 |
| 252917_at | 1.90 | 0.001 | ZF4 |
| 259970_at | 1.87 | 0.020 | cab |
| 257262_at | 1.82 | 0.027 | CONSTANS |
| 261319_at | 1.55 | 0.001 | Spa1 |
| 264211_at | 1.34 | 0.001 | Gigantea |
This finding demonstrates that the treatments, seedlings, and arrays behave as anticipated, consistent with data by Tepperman et al. (2001, 2004) as well as the generally recognized contributions of the well-characterized phytochrome system. These data establish an experimental baseline that supports the validity of the GL-specific photoresponses next presented, as they occur in synchrony with typical and predictable photomorphogenic gene expression patterns. Some induced transcripts appear to be specific to the GL treatment. These are strongly and reproducibly induced between replicates, yet have not been reported as phytochrome or cryptochrome regulated.
When the total down-regulated transcript (>2-fold) set was examined, it was shown that of 450 transcripts repressed by GL (P < 0.01), approximately 10% represent transcripts from plastid-resident genes. The corresponding plot of this subset is shown in Figure 1B. A subset of the plastid-transcript data is presented in Table II, and the entire set is available online as Supplemental Data S1. Curiously, several of these have previously been shown to be light inducible, such as psaA (Nakamura et al., 2003), psbD (Christopher and Mullet, 1994), and rbcL (Folta and Kaufman, 2003). The majority of plastid transcripts exhibited no significant change, and only three increased by more than 2-fold in abundance, indicating that the decrease in steady-state transcript level is a specific response affecting a subset of plastid transcripts. The degree of statistical significance varies greatly between samples, and this can be attributed to the small number of experimental replicates. The data do, however, indicate a clear trend within the plastid transcript class, and the photophysiological parameters of the GL response were further explored and the phenomenon validated using RNA gel-blot analyses against candidate transcripts.
Table II.
A sample of 14 plastid transcripts down-regulated 1 h after a 102 μmol m−2 GL pulse
“Fold change” represents the ratio of signal following the GL pulse relative to the dark signal.
| Probe Set ID | Fold Change | P Value | Transcript |
|---|---|---|---|
| log2 | |||
| 244912_at | −3.81 | 0.173 | Cytochrome c biogenesis orf382 |
| 245024_at | −2.48 | 0.113 | ATPase α-subunit |
| 245002_at | −2.4 | 0.001 | PSII D2 protein |
| 245007_at | −2.39 | 0.171 | PSI P700 apoprotein A1 |
| 245009_at | −2.34 | 0.188 | Ribosomal protein S4 |
| 244940_at | −2.24 | 0.155 | Ribosomal protein S12 (trans-splice part 2 of 2) |
| 245025_at | −2.23 | 0.136 | ATPase I subunit |
| 245003_at | −2.19 | 0.001 | PSII 43-kD protein |
| 244939_at | −2.17 | 0.130 | Ribosomal protein S12 (trans-splice part 1 of 2) |
| 244937_at | −2.16 | 0.060 | NADH dehydrogenase 49-kD protein |
| 244998_at | −2.15 | 0.227 | RNA polymerase β-subunit-1 |
| 245017_at | −2.07 | 0.197 | PSI I protein |
| 245047_at | −1.96 | 0.172 | PSII 32-kD protein |
| 245015_at | −1.95 | 0.176 | rbcL |
Verification of Microarray Findings with RNA Gel-Blot Analysis
Analysis of microarray data suggested a trend in the down-regulation of plastid transcripts, yet due to the lack of strong statistical significance, it was necessary to verify these microarray results through analysis of specific transcripts using RNA gel-blot analysis against hybridized probes. A subset of the transcripts was chosen for further analysis, including psaA, psbD, rbcL, rpoC, and rps2, which encode proteins of PSI, PSII, a stromal protein, and other housekeeping genes. The response of phytochrome-induced nuclear genes was verified via detection of Elip and Lhcb transcripts. The results are presented in Figure 2 and agree with the trends observed in the microarray analyses, except that the amplitude of the plastid transcript response is generally lower for all transcripts when quantified on the phosphoimager (data not shown). The basis of this discrepancy may be that while the RNA gel-blot utilizes a probe targeted at the entire transcript, the microarray assesses transcript abundance using a series of oligonucleotides targeted to specific portions of the transcript. In the cases of psaA and psbD, it was clear by transcript size that the probe was detecting the polycistronic, unprocessed message (data not shown). No clear evidence of specific processing was seen in these or any subsequent experiments. A single GL pulse induces accumulation of Elip and Lhcb transcripts, consistent with the microarray data. Neither the Elip nor the Lhcb transcript was detectable in darkness or following a GL pulse in the phyAphyB mutant background. This experiment was performed only once, as it represents an independent replicate of the conditions utilized in the microarray experiments.
Figure 2.
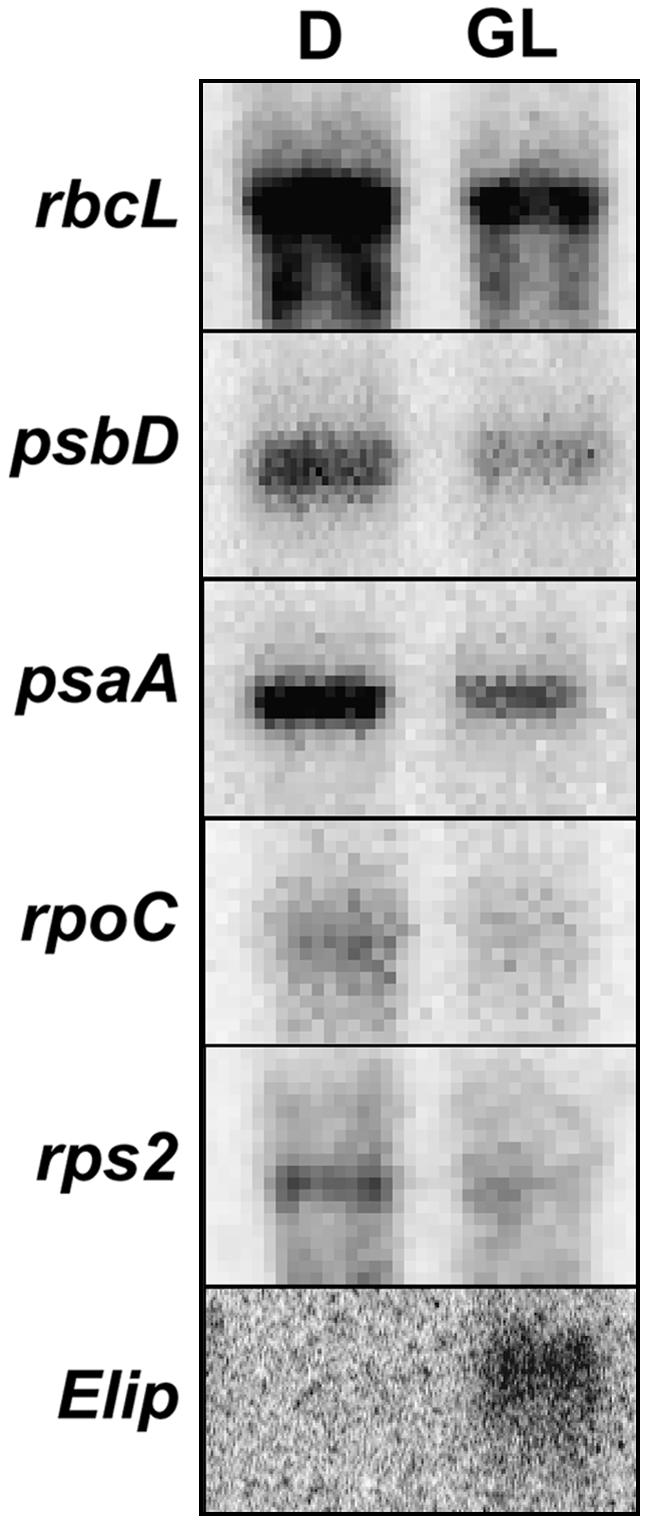
Verification of microarray data with RNA gel-blot analysis. The 3-d-old, dark-grown seedlings were treated with a 102 μmol m−2 GL pulse (GL) or a mock pulse (D). Tissue was harvested after 1 h, and RNA was isolated, fractionated, blotted, and probed with radiolabeled PCR products corresponding to various chloroplast or nuclear genes. Experiments were repeated at least twice with similar results, and ethidium bromide staining of gels confirmed even loading (not shown).
The GL Response Persists throughout Early Skotomorphogenic Development
The microarray was performed on 2-d-old etiolated seedlings, corresponding with the developmental stage used to define the novel acceleration of stem growth rate (Folta, 2004). It was important to assess seedling competence for the down-regulation of plastid transcript accumulation to determine the optimal time to perform further analyses, as 3- to 4-d-old seedlings are more amenable to manipulation and RNA purification. Seedlings were tested for the GL response after 2, 3, and 4 d of dark growth after stratification. The response was not statistically different in any of the three experimental conditions (data not shown). The response was less robust in 5- to 6-d-old seedlings, but this may be due to prolonged growth on minimal media. All consequent tests were performed on 2- to 3-d-old seedlings.
Fluence Response, Time Course, and Reciprocity
The unusual down-regulation of plastid transcripts occurs in plants treated with a single pulse of GL where fluence and time course were defined by study of GL-induced stem growth kinetics. To further understand this response, the photophysiological parameters were explored using candidate plastid transcripts. The psaA, psbD, and rbcL transcripts were chosen for further analysis, representing transcripts associated with PSI, PSII, and a stromal protein, respectively. In the microarray trials, psaA decreased by approximately 5-fold (P = 0.1712), psbD decreased approximately 5-fold (P = 0.0013), and rbcL decreased approximately 4-fold (P = 0.1494). Furthermore, all three have been studied previously with respect to light regulation (Klein et al., 1988; Kim et al., 1993; Christopher and Mullet, 1994; Thum et al., 2001; Dhingra et al., 2004a; Mochizuki et al., 2004). Defining the photophysiological parameters of the GL response is important, as this information will define the relationship, if any, between GL-induced rapid stem growth promotion and the decrease in plastid transcript abundance. For instance, if the two processes obey a similar time course and fluence response, it may be inferred that both of these novel processes are activated by the same sensory system.
To test the fluence-response parameters of the response, 3-d-old, dark-grown seedlings were treated with a short, single pulse of GL with a total fluence between 10−3 and 103 μmol m−2 or a mock pulse. Based on initial trials, it was apparent that the response was not occurring at very low fluence rates, so further trials were conducted at 10−1 μmol m−2 and above. The results of one individual replicate are shown in Figure 3A, and the normalized results of four independent trials are presented in Figure 3B. The results show that the threshold of the response is between 100 and 101 μmol m−2, and the decrease in transcript is maximal for psaA and rbcL at 102 μmol m−2, while the maximum decrease in psbD occurred following a 103 μmol m−2 pulse.
Figure 3.

The fluence-response characteristics of the decrease in plastid transcript abundance following a GL pulse. Three-day-old, dark-grown seedlings were treated with either a short, single pulse of GL ranging from 10−1 to 104 μmol m−2 or a mock pulse (D), and tissue was harvested 1 h after irradiation. Total RNA was isolated and probed with radiolabeled PCR products corresponding to psaA, psbD, rbcL, or 18S rRNA for normalization. A and B, The results of a single experiment (A), and the average results of four independent experimental replicates showing relative accumulation of psaA (black circles), psbD (squares), and rbcL (white circles) transcripts (B). Dark levels were arbitrarily set to 1 and error bars represent the se of the mean.
Time-course experiments were designed to test the timing of the onset and progression of the response. Dark-grown, 3-d-old seedlings were treated with a single 102 μmol m−2 GL pulse. Seedlings were harvested at 0 (immediately after the pulse), 5, 15, 30, and 60 min. A dark control (seedlings receiving no GL pulse) was included for reference, yielding comparable results to the 0-min time point (data not shown). The results of one individual experiment are shown in Figure 4A, and the mean experimental data from four independent replicates are shown in Figure 4B. The data indicate that the transcripts from psaA, psbD, and rbcL are present in darkness and decrease in abundance within 15 min, reaching the trough of accumulation at 60 min. Transcript accumulation is also substantially reduced 120 min after irradiation.
Figure 4.

The time course of down-regulation of plastid transcripts in response to a single GL response. Etiolated 3-d-old seedlings were treated with a single 9-s pulse of GL with a fluence of 102 μmol m−2, and tissue was harvested immediately (0 min) or at 5, 15, 30, 60, or 120 min after the treatment. RNA was isolated, blotted, and probed with radiolabeled PCR products corresponding to psaA, psbD, and rbcL. 18S rRNA was probed to ensure even loading. A and B, The results of one experimental trial (A), and the average results of at least three independent experimental replicates showing relative accumulation of psaA (black circles), psbD (squares), and rbcL (white circles; B). The transcript present at time 0 was set to 1 and error bars depict the se of the mean.
Experiments were performed to test the Bunsen-Roscoe Law of Reciprocity. The principle states that a given total fluence of light will induce a similar photochemical effect if delivered over different amounts of time (Bunsen and Roscoe, 1862). In other words, if the total number of photons is kept constant, the net effect should remain the same, independent of treatment duration or fluence rate. To test if reciprocity is valid for the GL response, 3-d-old etiolated seedlings were treated with single 102 μmol m−2 pulse delivered over 5, 50, or 500 s. RNA was isolated and the accumulation of plastid transcripts was assessed using RNA gel-blot analysis. The results of one experiment are shown in Figure 5A, and the mean results of three independent experiments are shown in Figure 5B. The results indicate that a 102 μmol m−2 pulse causes a similar decrease in transcript accumulation after a 5- or 50-s pulse for psaA, psbD, and rbcL. However, when the pulse is delivered over 500 s, the magnitude of the decrease in psaA and rbcL transcripts is lower.
Figure 5.

The GL response obeys the law of reciprocity. Dark-grown, 3-d-old seedlings were irradiated with a single pulse of GL with a total fluence of 102 μmol m−2 of varying duration. Seedlings were irradiated for 5, 50, or 500 s, and then tissue was harvested 1 h after the treatment. Transcripts were blotted and probed with labeled PCR products corresponding to psaA, psbD, rbcL, or 18S ribosomal RNA as a loading control. A and B, The results of one experiment (A), and the mean results of three independent experimental replicates showing relative amount of psaA (black circles), psbD (squares), and rbcL (white circles) observed after a pulse of varying duration (B). Dark levels were set to 1. Error bars represent se of the mean.
Genetic Analyses
GL-stimulated growth promotion cannot be eliminated with mutation of any characterized photosensor (Folta, 2004), and like light-induced stem elongation, the down-regulation of plastid transcripts in these trials is counter to the normal light induction of plastid transcripts. The time-course and fluence-response characteristics of GL-induced stem elongation and plastid transcript down-regulation are remarkably similar. These findings suggest that the responses are governed by the same light receptor and that it is not likely one of the described plant light sensors. However, because phytochrome and cryptochrome receptors are sensitive to GL (Mandoli and Briggs, 1981; Lin et al., 1995; Shinomura et al., 1996, 2000), the role, if any, of known light sensors in the GL-induced decrease of select plastid transcripts must be formally assessed using photomorphogenic mutants.
To measure the role of known photoreceptors in the GL response, transcript levels of psaA were measured in cry1cry2, phyAphyB, and phot1phot2 double mutants, as well as phyA, hy1, and npq1 single mutants. Three-day-old, dark-grown plants were treated with a single 102 μmol m−2 GL pulse, and tissue was harvested 1 h later. RNA was isolated, fractionated, blotted, and probed as described in “Materials and Methods.” The blots were probed with radiolabeled PCR product corresponding to the coding region of psaA. The same blots were subsequently probed to detect 18S rRNA to verify even loading. The results of one individual replicate are shown in Figure 6A, and the normalized results of three or four independent trials are presented in Figure 6B. The results indicate that the GL response is persistent in all mutant backgrounds tested.
Figure 6.

The GL response persists in Arabidopsis photoreceptor mutants. Dark-grown, 3-d-old seedlings were treated with either a 102 μmol m−2 GL pulse (G) or a mock pulse (D). Tissue was harvested after 1 h, and RNA was isolated, fractionated, and probed with a radiolabeled psaA probe. The same blots were reprobed with a radiolabeled 18S sequence as a loading control. A, The accumulation of transcripts hybridizing to psaA in wild-type seedlings and photomorphogenic mutants from one experimental replicate. B, The mean results of at least three normalized experimental replicates. In all cases, the transcript level in the mock-pulse treated seedlings has been set to 1, and only the results for the green pulse treatment are presented. Error bars represent se of the mean.
Wavelength Specificity of the Response
Microarray and RNA gel-blot analyses confirmed that a short, single GL pulse leads to a decrease in a suite of transcripts resident to the plastid genome. Genetic evidence suggests that known light sensors are likely not required for the response. However, cryptochrome and phytochrome photosensors are certainly activated by a GL pulse, and there is no way to eliminate all phytochrome activity. It is possible that known receptors could redundantly transmit the GL signal or that an extremely small pool of phytochromes in hy1 mutants is sufficient to initiate the GL response. A potential role for phytochromes cannot be ruled out by far-red reversal of the GL response because very low fluence phytochrome responses are not photoreversible (Mandoli and Briggs, 1981). However, it is possible to test the participation of known receptors in the GL response by measuring the accumulation of transcripts in response to irradiation with various light qualities. Because GL inefficiently affects cryptochrome and phytochrome receptors, application of a more optimally excitatory waveband may lead to an augmented effect on transcript induction or repression. In other words, the effect should be equally, if not more, visible following a red or blue pulse. Likewise, if the GL response is only an effect of low-level coaction between blue and red sensing systems, a combination of blue and red together should generate a strong down-regulation of relevant transcripts. psbD transcripts were chosen as representative reporters for further analyses because of the extensive literature base detailing transcript stability and light induction (Christopher and Mullet, 1994; Thum et al., 2001; Nakamura et al., 2003).
Dark-grown, 3-d-old seedlings were treated with a 102 μmol m−2 pulse of blue, green, red, or far-red light or co-irradiation with red and blue light. The results are shown in Figure 7. In all cases, only a GL pulse leads to down-regulation of plastid transcripts. Blue, red, and far-red have no effect. The combination of red and blue light consistently leads to a slight induction of psaA and psbD transcripts, consistent with earlier reports of regulation through coactivation of multiple sensory systems (Thum et al., 2001).
Figure 7.

Down-regulation of plastid transcripts is specific to GL treatment. Three-day-old, etiolated seedlings were treated with a single 102 μmol m−2 pulse of blue (B), green (G), red (R), far-red (FR), blue and red light together (B+R), or a mock pulse (D). Tissue was harvested after 1 h, and RNA was analyzed by RNA gel-blot analysis using a radiolabeled psaA PCR fragment as probe. A and B, The results of a single experiment (A) and the combined data from three independent experiments (B). All blots were normalized to 18S rRNA as a loading control. Error bars represent se of the mean.
It is possible that the GL response is a consequence of very low fluence activation of phytochrome. To test this possibility, the psaA transcript accumulation was measured in at least three duplicate experiments where seedlings were irradiated with a pulse of red light ranging from 10−3 to 103 μmol m−2. The resulting transcript levels were comparable to dark levels and indicate that irradiation with very low fluences of red light do not activate the down-regulation of the psaA transcript (data not shown). Moreover, sequential treatment with red and GL indicate that red light does not affect the GL response. Dark-grown seedlings were treated with a 102 μmol m−2 pulse of red light, immediately followed by a 102 μmol m−2 pulse of green. The results from three independent experimental replicates show that the red pretreatment does not affect the magnitude of the GL response at the 1-h time point (data not shown).
The Response in Tobacco
Although Arabidopsis (Arabidopsis thaliana) offers outstanding genetic tools, tobacco (Nicotiana tabacum) presents an excellent system for chloroplast isolation, biochemistry, and genetic manipulation and is a candidate system for future studies of the GL response. Furthermore, it was important to test if this response is maintained by other plant species.
Tobacco seeds were planted and treated in the manner described for Arabidopsis seeds. However, where experiments in Arabidopsis were best performed at 3 d after a germinating light pulse, tobacco seedlings were grown in complete darkness for 6 d without prior stratification. The response was tested on days 5 to 7, and the 6-d time point produced the most dramatic and reproducible results (data not shown). The fluence-response and time-course characteristics of the response in tobacco were tested. The results are presented in Figure 8 and show that the response of tobacco seedlings is very similar to the response in Arabidopsis seedlings.
Figure 8.

The GL response persists in etiolated tobacco seedlings. A, Six-day-old, etiolated tobacco seedlings were treated with a single pulse of GL of varying fluence or a mock pulse (D). Tissue was harvested after 1 h. B, Etiolated seedlings were treated with a single 102 μmol m−2 pulse, and tissue was harvested at various time points after treatment. RNA was analyzed by RNA gel-blot analysis using a radiolabeled psaA, psbD, or rbcL PCR fragment as probe. 18S rRNA was hybridized as a loading control. Experiments were repeated at least twice with similar results.
DISCUSSION
Evolution does not typically ignore a conditional signal. An overarching theme distilled from over a century of research in photomorphogenesis is that light quantity, quality, and duration dovetail intricately to carefully guide the initial biochemical, molecular, and morphological events coincident with seedling establishment. Because seedlings certainly will find themselves in contexts of enriched green irradiation, such as in a dense stand of plants or under a canopy, it stands to reason that plants would evolve mechanisms to correctly interpret this potentially important environmental information. The results of this study indicate that the green component of reflected or transmitted light also contains information that induces specific plant responses. Treatment of dark-grown seedlings with a short pulse of narrow-bandwidth, 525-nm irradiation apparently generates a response that complicates normal light development models, yet does so in a manner consistent with plant biology. In other words, GL, like far-red light, may inform the developing seedling that ambient light conditions are not optimal for normal growth and development. In the absence of significant input from red and blue signals, the information contained within green and far-red wavebands may be especially meaningful.
Examination of the literature reveals sporadic reports for almost 50 years of specific GL effects on plant development and physiology. The work described in this report initiated with a study that characterized the antagonistic effects of GL on stem growth inhibition (Folta, 2004). The study charted the minute-to-minute growth kinetics of developing seedlings using computer-assisted, infrared image capture (Parks and Spalding, 1999; Folta and Spalding, 2001). The high-resolution growth study defined a specific and robust effect GL on seedling elongation that peaked 30 to 45 min after the pulse. This rapid response occurred independently of known light sensors and defined the optimal light treatments to test for possible GL-specific effects on global gene expression. Microarray analyses were then performed on seedlings exhibiting the GL-induced rapid growth response. As anticipated, the GL pulse-induced, phytochrome-controlled nuclear transcripts were induced, consistent with the set described in phytochrome/far-red microarray studies (Tepperman et al., 2001). The general trend is that primary phytochrome-induced gene expression changes consist of the accumulation (and in some cases disappearance) of specific transcription factors that regulate a cascade of photomorphogenic responses (Tepperman et al., 2001, 2004).
Unexpectedly, there was a clear decrease in the transcripts within the developing plastid. A suite of plastid transcripts encoding polycistronic messages for products of PSI, PSII, and ATPases, as well as single open reading frames, such as rbcL, decreased in abundance following the GL pulse. Many of these have been previously described as light inducible, and down-regulation of these plastid transcripts was not reported in other microarray analyses for far-red (Tepperman et al., 2001), red (Tepperman et al., 2004), or blue light (Ma et al., 2001; Folta et al., 2003) effects.
Although two microarray experimental replicates did not provide robust statistical support of the plastid transcript down-regulation response, a trend was apparent and was investigated further with high rigor using RNA gel-blot analysis. Figure 2 verifies the phenomenon using a subset of plastid transcripts (including psaA, psbD, and rbcL). These transcripts encode proteins of PSI, PSII, and the stroma, and their light-induced accumulation has been well documented. Because their response on the microarray was the opposite of what has been previously observed, these transcripts were most appropriate to implement in further investigation of the GL dependent down-regulation of plastid transcript accumulation.
The fluence-response and time-course characteristics of the down-regulation of plastid transcripts are remarkably similar to those of the stem elongation response previously described (Folta, 2004). Transcripts present in darkness decrease to approximately one-half following a pulse of light between 100 and 104 μmol m−2. Transcripts begin to accumulate above dark levels following a 104 μmol m−2 pulse. Genetic tests show that this is almost entirely due to a contribution from phyA and indicate that sufficient irradiation can overcome the GL-response. Time-course experiments in Arabidopsis show that the decrease is apparent after only 15 min. The response is as least as rapid in tobacco seedlings. Reciprocity holds for short-term irradiations (<500 s), indicating that the response is initiated by first-order photochemistry. Together, the photophysiological parameters of the GL-induced decrease in plastid transcript accumulation are extremely similar to those of green-induced stem elongation, suggesting that both are initiated via the same photoreceptor(s).
Genetic tests were performed to identify the receptor or receptors mediating this unusual response to light. The GL-mediated down-regulation of psaA and psbD transcripts persisted in all photosensory mutant lines tested (phyA, phyB, hy1, cry1cry2, phot1phot2, and npq1), indicating that the cognate receptors/products are not solely required for normal transcript down-regulation. Although the hy1 strongly suppresses the activity of all phytochromes, the mutant contains a small photoconvertable pool of phytochrome (Chory et al., 1989), so the GL response could be maintained through the action of a minor fraction of phytochrome. These experiments also do not eliminate the possibility that different receptor families act redundantly to mediate the response. For instance, if cryptochrome is absent, phytochrome may complete the action and vice versa.
To address this possibility, the experiment was conducted with different light qualities, qualities that match the peak absorption of the candidate receptors. It was hypothesized that if GL induces transcript disappearance, then red light should be more effective if the response is phytochrome mediated. Disappearance after a far-red pulse would suggest phyA to be the receptor, and blue light-induced degradation would suggest the involvement of cryptochromes and/or phototropins. However, treatment of etiolated seedlings with the same quanta of blue light led to a slight increase of psaA and psbD transcripts, while red and far-red had no effect. It remained a formal possibility that the GL response requires activation of multiple sensory systems. Although blue light efficiently photoconverts phytochrome alone, seedlings were irradiated simultaneously with red and blue light. As with a blue pulse alone, the treatment was slightly inductive. Although not formally tested, the response is unlikely a property of phyC, phyD, or phyE, as all absorb in the red and blue portions of the spectrum and all would be negatively affected by the hy1 mutation. Together with the genetic data, these findings support that the down-regulation of psaA and psbD is unique to GL and is not likely mediated by known photosensors. Genetic and photophysiological assays strongly suggest that this is not a phytochrome-mediated activity, yet there is no way that phytochrome can be definitively excluded as the primary photosensor mediating the response using the current set of genetic tools.
The observed GL-mediated decrease in transcript levels of otherwise light-regulated plastid transcripts may be attributed to a change in plastid transcript stability, a decrease in transcription rate, or both. Transcriptional regulation of plastid transcripts is complicated by the existence of both nuclear-encoded RNA polymerase (NEP) and a plastid-encoded RNA polymerase (PEP). It has been shown that NEP's activity predominates during early developmental stages and transcribes housekeeping genes and rpoB genes (Hajdukiewicz et al., 1997). As a plant develops competence for autotrophy, PEP starts transcribing plastid-encoded genes, while NEP-derived transcripts are less stable (Cahoon et al., 2004). The experiments described here in Arabidopsis and tobacco reflect the plastid transcript level in a proplastid and/or etioplast and thus are attributable to NEP activity. Because PEP activity makes a negligible contribution to net transcript accumulation at this stage, involvement of nucleus-derived sigma factors is unlikely. These mechanisms remain to be formally tested. Based on time-course experiments, the best interpretation of the data is that NEP-based transcription is likely not affected and that the resulting transcripts are destabilized by the light treatment. These studies will be conducted in etiolated tobacco, where the response is more sensitive and rapid than witnessed in Arabidopsis. Additionally, tobacco affords the possibility of plastid transformation (Dhingra et al., 2004b), so transplastomic constructs may be used to test the effect of specific sequence elements in the promoters and transcripts themselves.
The aforementioned GL-induced stem growth promotion is a process contrary to the normal progression of photomorphogenic development, as light normally inhibits stem elongation. Similarly, GL down-regulation of light-inducible plastid transcripts also appears to be counterintuitive to preparation for autotrophic exploitation of an illuminated environment. In both cases, a pulse of GL seems to augment familiar characters of the etiolate program. Taken together, these effects suggest the existence of a separate genetic program, a state that may best be described as hyperskotomorphogenic. One interpretation is that the GL system instructs the developing plastid to reserve the extensive resources required to load the thylakoids with photosynthetic protein complexes. This system is possibly complementary to that of the nucleus, where phyA and far-red light adjust the transcriptome for growth in a less favorable environment. Perhaps these two systems work together to coordinate transcript accumulation in two separate compartments in response to dim and/or nonphotosynthetically favorable wavebands. The interplay between the green and far-red system will be tested.
In conclusion, careful monitoring of a rapid and early response to GL (Folta, 2004) provided information that was used to pinpoint the timing of microarray experiments. These experiments unveiled a surprising trend, a decrease in the abundance of key plastid transcripts that is contrary to logical progression of light-mediated development. The response is GL specific and cannot be attributed to the class of known photoreceptors. Taken together, these observations may suggest that subthreshold, redundant activation of phytochrome, cryptochrome, or phototropin receptors may initiate a novel reverse response to light. More likely, these data suggest that the plant light sensorium is more complicated than previously expected. Certainly the presence of five phytochromes, two cryptochromes, two phototropins, and three other LOV domain receptors suggest the plant light sensor collection coordinates a complex circuit of integrated responses that are dependent upon plant developmental state, tissue, or cell type. Add to this the noted and potential light-sensing roles for zeaxanthin (Frechilla et al., 2000; Talbott et al., 2003), cry-DASH (Brudler et al., 2003), G proteins (Warpeha et al., 1991), and possibly flavin-binding aquaporins (Lorenz et al., 2003) and it is clear that there are many additional candidates that may be modulating the GL plastid response. It also is of interest to determine how the developmentally contrary GL effects integrate with the inductive photomorphogenic responses associated with blue and red wavebands. This GL-plastid response also provides a basis for testing candidate receptors and putative transduction molecules via reverse genetics, as the extensive suite of photomorphogenic mutants does not always fit conveniently into characterized pathways. Together, all of these next activities will further describe how the previously uncharacterized antagonistic responses to an early GL signal intermesh with those of other sensory systems to shape early plant growth and development.
MATERIALS AND METHODS
Plant Materials
The genotypes tested are identical to those previously assessed for responses to blue and GL: cry1-304, cry2-1, phot1-5 (nph1-5), phot2-1, phyB-5, and hy1-100 (Folta, 2004). The phytochrome mutants are in the Landsberg erecta ecotype, all others are in the Columbia background. The phyA allele used was a previously uncharacterized allele isolated from a Salk SIGNAL T-DNA pool as a seedling with a long hypocotyl under far-red light. For generation of RNA, 100 μL of Arabidopsis (Arabidopsis thaliana) seeds were surface sterilized by shaking for 5 min in sterile water with 0.1% Tween 20, followed by 5 min in 50% commercial bleach and then 1 min in 95% ethanol followed by three rinses with sterile distilled water. The seeds were resuspended in 0.7% agarose containing 1 mm KCl and 1 mm CaCl2 and were distributed onto media composed of 1 mm KCl and 1 mm CaCl2 solidified with 1% Difco agar (Beckton Dickinson). Some replicates were performed using 15 μL of seeds distributed in 400 μL of 0.7% agarose on 2 mL of 1 mm KCl and 1 mm CaCl2 solidified with 1% Difco agar. Similar results were obtained when seedlings were grown on 0.5× Murashige and Skoog medium containing 3.5 mm MES and solidified with 1.0% phytoagar. The planted seeds were stratified in absolute darkness for 48 h followed by a 1-h pulse of fluorescent white light (16 μmol m−2 s−1) to synchronize germination. The hy1 seeds required longer white light treatment (<4 h) for complete germination. Seedlings were grown in absolute darkness at 23°C for 72 h (±2 h) prior to experimental light treatment. For generation of RNA from tobacco (Nicotiana tabacum), 20 mg of Petite Havana seeds were surface sterilized as described above. The seeds were resuspended in 0.7% agarose containing 0.5× Murashige and Skoog medium containing 3.5 mm MES and were grown on 0.5× Murashige and Skoog medium containing 3.5 mm MES and solidified with 1.0% phytoagar. Seedlings were grown in absolute darkness at 23°C for 5, 6, or 7 d prior to experimental light treatment. Tobacco seeds were not stratified or provided with white light treatment for synchronization of germination.
Light Sources and Treatments
GL was supplied by a green LED array (S10-30 or R30-123 bulb; Ledtronics) filtered through transparent green plastic filter, resulting in a peak emission at 525 nm and a 16-nm half-bandwidth. Blue and red light treatments were given using Norlux Hex-Array LED light modulated with a custom controller as described (Folta et al., 2005). Fluence rate was attenuated with neutral density filters (layers of M-209 and/or M-211; Cinemills). The emission spectrum of all light sources and the design of the Norlux Hex-Array controller are viewable online at www.arabidopsisthaliana.com/lightsources. Fluence rates were assessed with a LI-COR LI-250 photometer using a PAR sensor (LI-COR) or an International Light IL-1400A with an SEL033 sensor for far-red light quantification.
Microarray Assays and Analyses
A total of 100 μL of Arabidopsis seeds was planted, stratified, and grown as described above for 48 h at 23°C in complete darkness. The seedlings were irradiated from above with a single 102 μmol m−2 GL pulse (11.1 μmol m−2 s−1 for 9 s) and returned to darkness. This time point and fluence were chosen because the GL effect on stem growth promotion was maximal at this point without invoking growth inhibition through the phototropins (Folta, 2004). Seedlings were harvested in liquid nitrogen after 1 h, and RNA was isolated as described (Anderson et al., 1999) except that diisopropylnaphthalenesulfonic acid was substituted for triisopropylnaphthalenesulfonic acid (Bies and Folta, 2004). Preparation of the cRNA probe, hybridization, and detection were performed as described (Folta et al., 2003), only using the Superscript Choice system (Invitrogen) for cDNA synthesis and the Affymetrix Cleanup module (Affymetrix). Quality assessment metrics were derived from internal standards, and comparisons to empirical data for all scanned microarrays and all arrays used in this study passed assessment.
Generation of Expression Values, Analyses, and Annotation
Microarray Suite Version 5 (Affymetrix) was used to produce a *.cel file, and Probe Profiler Version 1.3.11 (Corimbia) was used to convert intensity data to quantitative estimates of transcript presence in each probe set. A probability statistic was generated for each probe set based on the null hypothesis that the expression level is equal to zero (background). Transcripts not expressed above background (P > 0.05) were deemed absent and were not considered in further analyses.
Gene expression levels were subjected to one-way ANOVA over two replicates using the custom AnalyzeIt Tools software developed by the Interdisciplinary Center for Biotechnology Research at the University of Florida (http://genomics3.biotech.ufl.edu/AnalyzeIt/AnalyzeIt.html). Genes were considered to have a significant treatment effect if the probability for ANOVA analysis was <0.01. The probe sets associated with the treatment were determined using the NetAffx database (Affymetrix) and were merged with the expression data using AnalyzeIt Tools. The annotated data from these analyses are presented online as supplemental data in Excel format.
Tests of Fluence Response, Time Course, Reciprocity, and Light Quality
All experiments were performed over a 60-min time course, as defined by stem growth experiments (Folta, 2004). For red light and GL fluence-response experiments, 3-d-old, dark-grown, wild-type seedlings were treated with a short, single pulse of light with a total fluence ranging from 10−3 μmol m−2 s−1 to 103 μmol m−2 s−1, followed by incubation in complete darkness for 60 min prior to tissue harvest. Time-course experiments were performed by irradiating seedlings with a single 102 μmol m−2 pulse, followed by harvests at 0 (immediately following pulse), 5, 15, 30, and 60 min. A dark control received a mock pulse, and tobacco experiments included the addition of a 45-min time point. Reciprocity was tested by monitoring the GL response in dark-grown, wild-type seedlings after irradiation with a 102 μmol m−2 pulse delivered over 1, 10, or 100 s. Plant material was harvested 60 min after light treatment. Tests of light quality were performed with the aforementioned light sources. A 102 μmol m−2 pulse was delivered, and tissue was harvested after 60 min. All plant materials were harvested into liquid nitrogen with minimal exposure to an extremely dim green “safelight” (<0.01 μmol m−2 s−1). Several replicates were wrapped tightly in aluminum foil following irradiation and then were directly submerged into liquid nitrogen after 1 h in darkness to test for possible effects of the safelight. No safelight effect was observed (data not shown).
RNA Preparation
The 3-d-old, dark-grown seedlings were treated with a single 100 μmol m−2 pulse of GL, and tissue was harvested into liquid nitrogen after 1 h in darkness. This time point and fluence were chosen because the GL effect on stem growth promotion was maximal at this point without invoking growth inhibition through the phototropins (Folta, 2004). RNA was generated using protocols described previously (Anderson et al., 1999), except that diisopropylnaphthalenesulfonic acid was substituted for triisopropylnaphthalenesulfonic acid as described (Bies and Folta, 2004). RNA was labeled for use with the Affymetrix Arabidopsis GeneChip as described (Folta et al., 2003). All treatments, harvesting, labeling, and hybridizations were performed independently on three to six independent sets of seedlings except for the materials used in Figure 2, which were performed once but represent reiteration of microarray results. A subset of RNA isolations from Arabidopsis and all RNA isolated from tobacco were performed from frozen tissue using the Qiagen RNA kit.
RNA Gel Blots
RNA gel-blot analyses were performed by fractionating total RNA on formaldehyde/agarose gels, followed by blotting to nylon membranes and hybridization, following protocols described (Anderson et al., 1999). Hybridization probes were derived from PCR amplification of total DNA (chloroplast; psaA, psbD, rbcL) or cDNA (nuclear genes; Lhcb, Elip). Hybridization and washes were performed as described (Anderson et al., 1999), and the signals were quantified and analyzed on a Bio-Rad Fluor-S Max phosphorimager (Bio-Rad). All signals were normalized to the 18S rRNA hybridization signal.
Supplemental Data
The following materials are available in the online version of this article.
Supplemental Data S1. Dark versus green light pulse.
Supplementary Material
Acknowledgments
The authors thank Dr. Mick Popp at the Interdisciplinary Center for Biotechnology Resources at the University of Florida for his expertise in the analysis of microarray data. The authors also thank Maureen Clancy and Thelma Madzima or their careful and critical evaluation of this manuscript.
This work was supported by the National Science Foundation (to K.M.F.) and by the University of Florida University Scholars Program (to K.R.L.).
The author responsible for distribution of materials integral to the findings presented in this article in accordance with the policy described in the Instructions for Authors (www.plantphysiol.org) is: Kevin M. Folta (kfolta@ifas.ufl.edu).
The online version of this article contains Web-only data.
References
- Anderson MB, Folta K, Warpeha KM, Gibbons J, Gao J, Kaufman LS (1999) Blue light-directed destabilization of the pea Lhcb1*4 transcript depends on sequences within the 5′ untranslated region. Plant Cell 11: 1579–1590 [DOI] [PMC free article] [PubMed] [Google Scholar]
- Bies DH, Folta KM (2004) An effective substitute for triisopropylnaphthalenesulfonic acid (TIPS) for preparation of plant RNA. Anal Biochem 333: 201–203 [DOI] [PubMed] [Google Scholar]
- Brudler R, Hitomi K, Daiyasu H, Toh H, Kucho K, Ishiura M, Kanehisa M, Roberts VA, Todo T, Tainer JA, et al (2003) Identification of a new cryptochrome class. Structure, function, and evolution. Mol Cell 11: 59–67 [DOI] [PubMed] [Google Scholar]
- Bunsen R, Roscoe H (1862) Photochemische untersuchungen. Ann Phys Chem 117: 517–562 [Google Scholar]
- Cahoon AB, Harris FM, Stern DB (2004) Analysis of developing maize plastids reveals two mRNA stability classes correlating with RNA polymerase type. EMBO Rep 5: 801–806 [DOI] [PMC free article] [PubMed] [Google Scholar]
- Chen M, Chory J, Fankhauser C (2004) Light signal transduction in higher plants. Annu Rev Genet 38: 87–117 [DOI] [PubMed] [Google Scholar]
- Chory J, Peto CA, Ashbaugh M, Saganich R, Pratt L, Ausubel F (1989) Different roles for phytochrome in etiolated and green plants deduced from characterization of Arabidopsis thaliana mutants. Plant Cell 1: 867–880 [DOI] [PMC free article] [PubMed] [Google Scholar]
- Christopher DA, Mullet JE (1994) Separate photosensory pathways co-regulate blue light/ultraviolet-A-activated psbD-psbC transcription and light-induced D2 and CP43 degradation in barley (Hordeum vulgare) chloroplasts. Plant Physiol 104: 1119–1129 [DOI] [PMC free article] [PubMed] [Google Scholar]
- Dhingra A, Khurana JP, Tyagi AK (2004. a) Involvement of G-proteins, calmodulin and tagetitoxin-sensitive RNA polymerase in light-regulated expression of plastid genes (psbA, psaA and rbcL) in rice (Oryza sativa L.). Plant Sci 166: 163–168 [Google Scholar]
- Dhingra A, Portis AR, Daniell H (2004. b) Enhanced translation of a chloroplast-expressed RbcS gene restores small subunit levels and photosynthesis in nuclear RbcS antisense plants. Proc Natl Acad Sci USA 101: 6315–6320 [DOI] [PMC free article] [PubMed] [Google Scholar]
- Eisinger WR, Bogomolni RA, Taiz L (2003) Interactions between a blue-green reversible photoreceptor and a separate UV-B receptor in stomatal guard cells. Am J Bot 90: 1560–1566 [DOI] [PubMed] [Google Scholar]
- Folta KM (2004) Green light stimulates early stem elongation, antagonizing light-mediated growth inhibition. Plant Physiol 135: 1407–1416 [DOI] [PMC free article] [PubMed] [Google Scholar]
- Folta KM, Kaufman LS (2003) Phototropin 1 is required for high-fluence blue-light-mediated mRNA destabilization. Plant Mol Biol 51: 609–618 [DOI] [PubMed] [Google Scholar]
- Folta KM, Koss L, McMorrow R, Kim H-H, Kenitz JD, Wheeler R, Sager JC (2005) Design and fabrication of LED-based light arrays for plant research. BMC Plant Biol 5: 17–28 [DOI] [PMC free article] [PubMed] [Google Scholar]
- Folta KM, Pontin MA, Karlin-Neumann G, Bottini R, Spalding EP (2003) Genomic and physiological studies demonstrate roles for auxin and gibberellin in the early phase of cryptochrome 1 action in blue light. Plant J 36: 203–214 [DOI] [PubMed] [Google Scholar]
- Folta KM, Spalding EP (2001) Unexpected roles for cryptochrome 2 and phototropin revealed by high-resolution analysis of blue light-mediated hypocotyl growth inhibition. Plant J 26: 471–478 [DOI] [PubMed] [Google Scholar]
- Frechilla S, Talbott LD, Bogomolni RA, Zeiger E (2000) Reversal of blue light-stimulated stomatal opening by green light. Plant Cell Physiol 41: 171–176 [DOI] [PubMed] [Google Scholar]
- Hajdukiewicz PT, Allison LA, Maliga P (1997) The two RNA polymerases encoded by the nuclear and the plastid compartments transcribe distinct groups of genes in tobacco plastids. EMBO J 16: 4041–4048 [DOI] [PMC free article] [PubMed] [Google Scholar]
- Kim M, Christopher DA, Mullet JE (1993) Direct evidence for selective modulation of psbA, rpoA, rbcL and 16S RNA stability during barley chloroplast development. Plant Mol Biol 22: 447–463 [DOI] [PubMed] [Google Scholar]
- Klein RM (1964) Repression of tissue culture growth by visible and near visible radiation. Plant Physiol 39: 536–539 [DOI] [PMC free article] [PubMed] [Google Scholar]
- Klein RM (1979) Reversible effects of green and orange-red radiation on plant cell elongation. Plant Physiol 63: 114–116 [DOI] [PMC free article] [PubMed] [Google Scholar]
- Klein RM (1992) Effects of green light on biological systems. Biol Rev Camb Philos Soc 67: 199–284 [DOI] [PubMed] [Google Scholar]
- Klein RR, Mason HS, Mullet JE (1988) Light-regulated translation of chloroplast proteins. I. Transcripts of psaA-psaB, psbA, and rbcL are associated with polysomes in dark-grown and illuminated barley seedlings. J Cell Biol 106: 289–301 [DOI] [PMC free article] [PubMed] [Google Scholar]
- Lin C, Ahmad M, Gordon D, Cashmore AR (1995) Expression of an Arabidopsis cryptochrome gene in transgenic tobacco results in hypersensitivity to blue, UV-A, and green light. Proc Natl Acad Sci USA 92: 8423–8427 [DOI] [PMC free article] [PubMed] [Google Scholar]
- Lorenz A, Kaldenhoff R, Hertel R (2003) A major integral protein of the plant plasma membrane binds flavin. Protoplasma 221: 19–30 [DOI] [PubMed] [Google Scholar]
- Ma L, Li J, Qu L, Hager J, Chen Z, Zhao H, Deng XW (2001) Light control of Arabidopsis development entails coordinated regulation of genome expression and cellular pathways. Plant Cell 13: 2589–2607 [DOI] [PMC free article] [PubMed] [Google Scholar]
- Mandoli DF, Briggs WR (1981) Phytochrome control of two low-irradiance responses in etiolated oat seedlings. Plant Physiol 67: 733–739 [DOI] [PMC free article] [PubMed] [Google Scholar]
- Mochizuki T, Onda Y, Fujiwara E, Wada M, Toyoshima Y (2004) Two independent light signals cooperate in the activation of the plastid psbD blue light-responsive promoter in Arabidopsis. FEBS Lett 571: 26–30 [DOI] [PubMed] [Google Scholar]
- Nakamura T, Furuhashi Y, Hasegawa K, Hashimoto H, Watanabe K, Obokata J, Sugita M, Sugiura M (2003) Array-based analysis on tobacco plastid transcripts: preparation of a genomic microarray containing all genes and all intergenic regions. Plant Cell Physiol 44: 861–867 [DOI] [PubMed] [Google Scholar]
- Parks BM, Folta KM, Spalding EP (2001) Photocontrol of stem growth. Curr Opin Plant Biol 4: 436–440 [DOI] [PubMed] [Google Scholar]
- Parks BM, Spalding EP (1999) Sequential and coordinated action of phytochromes A and B during Arabidopsis stem growth revealed by kinetic analysis. Proc Natl Acad Sci USA 96: 14142–14146 [DOI] [PMC free article] [PubMed] [Google Scholar]
- Shinomura T, Nagatani A, Hanzawa H, Kubota M, Watanabe M, Furuya M (1996) Action spectra for phytochrome A- and B-specific photoinduction of seed germination in Arabidopsis thaliana. Proc Natl Acad Sci USA 93: 8129–8133 [DOI] [PMC free article] [PubMed] [Google Scholar]
- Shinomura T, Uchida K, Furuya M (2000) Elementary processes of photoperception by phytochrome A for high-irradiance response of hypocotyl elongation in Arabidopsis. Plant Physiol 122: 147–156 [DOI] [PMC free article] [PubMed] [Google Scholar]
- Talbott LD, Shmayevich IJ, Chung Y, Hammad JW, Zeiger E (2003) Blue light and phytochrome-mediated stomatal opening in the npq1 and phot1 phot2 mutants of Arabidopsis. Plant Physiol 133: 1522–1529 [DOI] [PMC free article] [PubMed] [Google Scholar]
- Tepperman JM, Hudson ME, Khanna R, Zhu T, Chang SH, Wang X, Quail PH (2004) Expression profiling of phyB mutant demonstrates substantial contribution of other phytochromes to red-light-regulated gene expression during seedling de-etiolation. Plant J 38: 725–739 [DOI] [PubMed] [Google Scholar]
- Tepperman JM, Zhu T, Chang HS, Wang X, Quail PH (2001) Multiple transcription-factor genes are early targets of phytochrome A signaling. Proc Natl Acad Sci USA 98: 9437–9442 [DOI] [PMC free article] [PubMed] [Google Scholar]
- Thum KE, Kim M, Christopher DA, Mullet JE (2001) Cryptochrome 1, cryptochrome 2, and phytochrome a co-activate the chloroplast psbD blue light-responsive promoter. Plant Cell 13: 2747–2760 [DOI] [PMC free article] [PubMed] [Google Scholar]
- Warpeha KM, Hamm HE, Rasenick MM, Kaufman LS (1991) A blue-light-activated GTP-binding protein in the plasma membranes of etiolated peas. Proc Natl Acad Sci USA 88: 8925–8929 [DOI] [PMC free article] [PubMed] [Google Scholar]
- Went FW (1957) The Experimental Control of Plant Growth. Chronica Botanica, Waltham, MA
Associated Data
This section collects any data citations, data availability statements, or supplementary materials included in this article.