

Abstract
Livestock movements in Great Britain (GB) are well recorded and are a unique record of the network of connections among livestock-holding locations. These connections can be critical for disease spread, as in the 2001 epidemic of foot-and-mouth disease (FMD) in the UK. Here, the movement data are used to construct an individual-farm-based model of the initial spread of FMD in GB and determine the susceptibility of the GB livestock industry to future outbreaks under the current legislative requirements. Transmission through movements is modelled, with additional local spread unrelated to the known movements. Simulations show that movements can result in a large nationwide epidemic, but only if cattle are heavily involved, or the epidemic occurs in late summer or early autumn. Inclusion of random local spread can considerably increase epidemic size, but has only a small impact on the spatial extent of the disease. There is a geographical bias in the epidemic size reached, with larger epidemics originating in Scotland and the north of England than elsewhere.
Keywords: modelling, epidemiology, foot-and-mouth disease
1. Introduction
Control of the 2001 epidemic of foot-and-mouth disease (FMD) in the UK resulted in approximately 8.5 million livestock culled, and is estimated to have cost 4–6 billion pounds (Anderson 2002). Since 2001, policies have been introduced to reduce the possible impact of reintroduction of FMD, such as movement standstills for holdings in receipt of animal movements (Anon 2003). However, the extent to which the UK is at risk of disease transmission facilitated by livestock movements at present is not well characterized.
Many models of FMD transmission exist; however, most have considered transmission and control after the imposition of movement restrictions, when transmission was dominated by local spread (e.g. Ferguson et al. 2001; Keeling et al. 2001; Kao 2003) rather than the initial outbreak, prior to detection of disease, where livestock movements were the critical factors (Gibbens et al. 2001; Kao 2002).
This initial spread can now be more readily studied, since the network of livestock movements is now well recorded. The UK has established schemes for monitoring the movements of cattle at the individual level (cattle tracing system, CTS) and for batches of pigs, sheep, goats and deer (Scottish Animal Movement System and Animal Movements Licensing System). Using these data, Kao et al. (in press) have shown that the basic reproductive ratio R0 alone is not a good predictor of whether an epidemic is likely, or of its eventual size. ‘Small world’ properties of the industry for both cattle (Christley et al. 2005) and sheep (Kiss et al. in press) allow widespread dissemination of disease, and seasonal trading patterns result in large variation in epidemic risk (Kiss et al. in press).
Kao et al. (in press) introduced a static network-based framework for analysing epidemic spread and corroborated the results with a stochastic model of epidemic spread, where the record of livestock movements between individual holdings was replayed, with stochastic transmission of disease weighted according to the movement characteristics. While the network analysis has greater analytical tractability, a simulation approach allows us to examine in unprecedented detail the question of ‘what would have happened if…?’. Here, we use the simulation framework to analyse the relationships among livestock movements and the temporal and spatial patterns of pre-detection FMD spread, including both the exact replay of animal movements and ‘local spread’ (Gibbens et al. 2001; Keeling et al. 2001) owing to undocumented contacts among geographically proximate holdings. This approach allows consideration of the relative timings of movements and the geographical distribution of at-risk areas.
We consider the seasonal, geographical and between-species variation in the susceptibility of the UK livestock industry to a large outbreak of FMD, under current legislative requirements for livestock movements. We also consider whether local or movement-related transmission is the most responsible for disease spread, and whether a simple measure of transmission is sufficient to determine potential epidemic size. Through sensitivity analysis, we determine the model parameters for which accurate determination will be important.
2. Model
(a) Data sources
Holdings were uniquely identified by their county/parish/holding (CPH) codes from the June Agricultural Census for 2003, and classified as either ‘market’ or ‘other’. Presence of each species (cattle, pigs and sheep) and location (eastings and northings data) were similarly identified. Of the 509 975 holdings (137 809 with reported stock), 61 121 were missing coordinate data (2311 with stock) and estimated as located at their parish centroids (plus jitter within 1 km2), where at least five holdings shared a parish code. Holdings sited more than 30 km from the parish centroids (17 041; 2177 with stock) were similarly assumed erroneous and relocated. A remaining 4127 holdings (1871 with stock) without coordinate data were considered only for movement-related spread. Holdings are also identified by sole occupancy authority (SOA), which represents a set of linked CPH codes, certain movements between which are exempt of reporting. With an average of 3.5 holdings per SOA, 93 616 holdings were thus linked to at least one other.
Individual CTS movement records were consolidated into batches. When there were multiple movements of a single cow on the same day, all possible combinations of routes of intra-day movement were allowed. The movement data were then merged into a single database. Movements were then identified by date, number and species of animal moved, and the CPH codes of source and destination. Only movements with valid (and different) CPH codes, which matched with the codes found in the census data were considered for the model.
(b) Simulation algorithms
The model was individual based at the level of the holdings, and stochastic. Holdings were described by their dates of becoming exposed, infectious via movements, infectious via local spread, and removed, determined by the timings of movements and local spread events. Based on these dates, the holdings could be classed into one of the four states:
S. These are holdings without exposed or infectious animals.
H. These are farms containing animals exposed to infection, but with all these animals subject to isolation until the movement restriction period has elapsed, triggered by the movement of animals onto the farm. The movement restriction period is 20 days for pigs, whereas for sheep and cattle, it is 6 days for England and Wales, and 13 days for Scotland (Anon 2004). These holdings do not constitute a source of further infection by either movement or local spread.
E. These holdings are similar to H, except with exposed animals not under movement restriction (e.g. it was infected by local spread), thus constituting a risk of further infection through off-movements. These holdings are not yet infectious by local spread, but off-movements can carry exposed animals. A latent period of 3 days was used, within the range given by Gibbens et al. (2001).
I. These are holdings containing infectious animals, after the latent period, which are a source of infection by both off-movement and local spread. FMD can spread rapidly within a population, infecting whole herds of cattle or pigs within one cycle of infection (ca 3 days). Therefore, we consider the entire holding as potentially infectious within this period after exposure (Alexandersen et al. 2003).
Once infected, farms are assumed to remain infectious until the end of the simulation. Markets, however, are disinfected and not continually occupied by livestock. In the model, infected markets re-enter the S state at the end of the day following any off-movement, to allow for single overnight stays of livestock.
Epidemics were seeded by selecting a fixed small number of holdings from those with off-movements on the first day of the simulation. These are set to be infectious on this day. Consistent with the 2001 epidemic (Gibbens et al. 2001), the simulations were run for 28 days, beyond which it is assumed unlikely that an epidemic could persist without being identified. For the Pan Asia strain of FMD, clinical signs in cattle and pigs are typically detected quickly; it is more difficult to detect infection in sheep, but these are also less susceptible (Davies 2002).
(c) Infection through animal movements
For each day of epidemic simulation, each possible infectious movement is considered in turn, followed by infection through local spread. Movements from markets were considered after movements to markets; thus, all onward movements via an ‘infected’ market within 1 day are assumed to be potentially infectious.
Only movements from holdings in the E or I state can cause infection and the risk of infection is assumed higher for movements of larger numbers of livestock. We assume that the probability of each batch of b animals containing at least one infected animal, m, can be approximated by the binomial distribution, with each animal infected with probability μ, i.e.
| 2.1 |
On-movements from infected holdings cause the destination holding to therefore enter the H state with probability m.
Values for the μ parameters were estimated from the 2001 UK epidemic data collected before the first identification of an infectious premises (IP): lists of IPs and premises culled as dangerous contacts (DCs) are available from DEFRA (2004). On or before 23 February 2001, 78 IPs were infected, of which 41 IPs might have been infected through livestock movements (29 sheep movements, 6 pigs, 1 cattle and 6 unspecified) including six through movements from Longtown market. Of the DCs traced from IPs infected before the movement ban, 31 were identified as DCs owing to animal movements, but were not infected. This suggests that over half of the movements caused transmission (41 out of 75), many of which were owing to farm-to-farm sheep movements (23 out of 58). Therefore, we assume here that approximately 40% of sheep movements from IPs may cause transmission. It is believed that there was no transmission from infected sheep at Hexham market (the first to be exposed) owing to the short interval between the infection of these sheep and their sale at Hexham, which would not occur under the current 6-day movement standstill regime (Anon 2003). More representative of transmission under the current regime are the six IPs and one slaughter-on-suspicion case spread from Longtown market. Movements from Longtown also triggered 61 DCs. Therefore, we assume that 1 in 10 outward movements from markets causes transmission. Given the known distribution of movement batch sizes, the values of μ were adjusted such that the desired proportion of batches infected was obtained. Thus, for movements off a market (in the E or I state), μ was set at μm_sheep=0.004 for sheep and μm_other=0.02 for cattle and pigs. For other movements, we assumed a value of μother=1.0 for cattle and pigs (all movements are potentially infectious) and μsheep=0.02 for sheep.
(d) Infection through local spread
Local spread unrelated to known movements was modelled using a constant rate of generation of new cases per day per infectious holdings, β. A value of β of 0.065 produced approximately equal numbers of cases through local and movement spreads at the epidemic peak period in sheep holdings, as was seen with the UK 2001 FMD epidemic (Gibbens et al. 2001). On each simulation day, a number of infectious contacts were selected for each infectious holdings from a Poisson distribution with mean β, without replacement, considering only holdings reported as containing livestock in the census. Contacts were limited to a 10 km radius, and weighted according to distance d by . A value of a=0.5 km−1 was chosen, producing a similar probability of being infected at distance d to that used by Kao (2003). Model output was found insensitive to changes in a across the range 0.3–0.7 km−1. Susceptible contacts become exposed on the current day of simulation. Infection by local spread negated the effect of any imposed standstill, and off-movements from infected holdings were considered to potentially contain exposed animals.
Since not all the movements within an SOA need to be reported, if one member of an SOA is infected, the rest may be too. Upon infection of a holding, the model (optionally) identifies any holding in the same SOA. These then gain the dates of exposure, becoming infectious, and removal of the source holding, but only become a source of further infection on the subsequent day, to allow time for distribution of animals within the SOA.
(e) Epidemic simulations
Epidemic simulations were carried out with starting times varied across the 2-year period of data available at 14-day intervals and repeated simulation at each starting point. The exact start day used in each simulation was subject to up to 14 days of jitter. The distribution and prevalence of each 28-day simulated epidemic were recorded and divided by the number of seeds used. The ‘full model’ is defined as a simulation including all movements data, plus local- and within-SOA spread. The potential spread through sheep movements alone is also considered, as this is a more likely route by which an epidemic might spread undetected. Where simulations were performed at a single time point, this was chosen as the time of peak activity and potential transmission through sheep movements from September to October 2004.
(f) Community analysis
The UK livestock industry might be partitioned by geographical region; however, a more natural approach is to divide locations into groupings that trade animals within themselves more often than between. These ‘communities’ may be geographical or may represent particular sectors of the industry (Pollott 1998). Communities were identified based on movements data from the epidemic peak using the ‘Q algorithm’ (Newman 2004), considering the movements as a static, undirected network over this period modified with network connections doubly weighted, where movements in both the directions exist (Kao et al. in press). Each holding belongs to a single community.
The ‘transmission potential’ or (May & Lloyd 2001) represents the expected number of secondary infections caused by the introduction of a single infectious case entirely at random (without consideration of the likelihood of it being infected) in an otherwise susceptible population. It is equivalent to R0 in a homogeneously mixed population. Each holding's contribution to was estimated by first calculating the probability of infection m (equation (2.1)) for all those k movements that occurred between premises i and j during a 14-day period beginning on the mean start day of the simulations. Probability of infection Mij from i to j was then calculated in a manner analogous to m, and for holding i as the sum of these across all holdings:
| 2.2 |
If and epidemic size are closely correlated, then may be used as a predictor of the relative severity of outbreaks regardless of starting location.
3. Results
(a) Temporal and sectoral variation in outbreak risk
Epidemics were simulated starting at intervals throughout 2003–2004 for sheep movements alone, without SOA or local spread. These results are shown in figure 1 and demonstrate the large temporal variation in the risk of FMD epidemics being maintained by movements in sheep alone, with an autumn spike and low risk throughout the rest of the year. It is unlikely that an epidemic could persist in cattle and pig populations for four weeks without being identified. However, if this should happen, then simulations including cattle and pig movements show an epidemic size some 10 times higher than in sheep alone (figure 2a), with no time of year free from epidemic risk.
Figure 1.

Number of infection events per seed for 28-day epidemics with the default parameter set. Infection occurs through sheep movements only. Means are shown for 400 epidemics each with five seeds.
Figure 2.

Number of infection events per seed for 28-day epidemics with the default parameter set. (a) Model with infection through movements only (total infections, grey solid line). Model with additional SOA spread (total infections (black solid line), composed of infections caused by movement (crosses) and infections from SOAs (open circles)). (b) Full model (total infections (black solid line), composed of infections caused by movement (crosses), infections caused by local spread (no symbol) and infections from SOAs (open circles)). Means are shown for 400 epidemics each with five seeds.
Inclusion of the intra-SOA spread has only a minor effect on epidemic size (figure 2a); however, the effect of including local spread is much larger (figure 2b). These transmission mechanisms have less effect upon the spatial extent of epidemic as measured by the number of 10×10 km2 squares affected (table 1). These results are consistent with few long-range infections through intra-SOA spread and little short-range spread through animal movements, as also shown by the average distance (di) between IPs and their parent cases in the four models (table 1). For sheep movements, some seasonal variations in di were found, with lengths of 60–80 km throughout the year, and peaks at 80 km in January to April and August.
Table 1.
Ratio of epidemic size to epidemic extent under various models. (Means of 1500 index cases, three per simulation, at the 2004 peak in sheep activity.)
| number of infection events | number of 100 km2 grid cells infected (after index case) | mean distance between IPs and their parent IPs di (km) | |
|---|---|---|---|
| sheep movements | 11.8 | 11.5 | 85.6 |
| all movements | 61.5 | 52.4 | 86.1 |
| +SOA spread | 65.9 | 52.5 | 78.7 |
| +local spread | 114 | 68.0 | 52.7 |
The importance of markets for movement transmission is shown in table 2, where mean epidemic size is shown for epidemics with different numbers of infected markets. Only small epidemics are possible without the infection of at least one market, and there is a close correlation between infected markets and epidemic size (r2=0.7; see also figure A1 in the electronic supplementary material).
Table 2.
Epidemic size versus numbers of markets infected. (Means of 1600 index cases, one per simulation, through sheep movements only, at the 2004 peak in sheep activity; s.e. shown in parentheses.)
| markets infected | 0 | 1 | 2 | 4 | 8 |
| mean epidemic size | 0.4 (0.04) | 3.8 (0.18) | 9.4 (0.55) | 32.0 (2.7) | 61.1 (4.9) |
(b) Geographical and community variation in outbreak risk
Figure 3 maps the density of animal movements across the country (both on- and off-movements). Pig movements were concentrated in the east; cattle and sheep movements were more similarly distributed, though sheep were more concentrated in upland areas.
Figure 3.
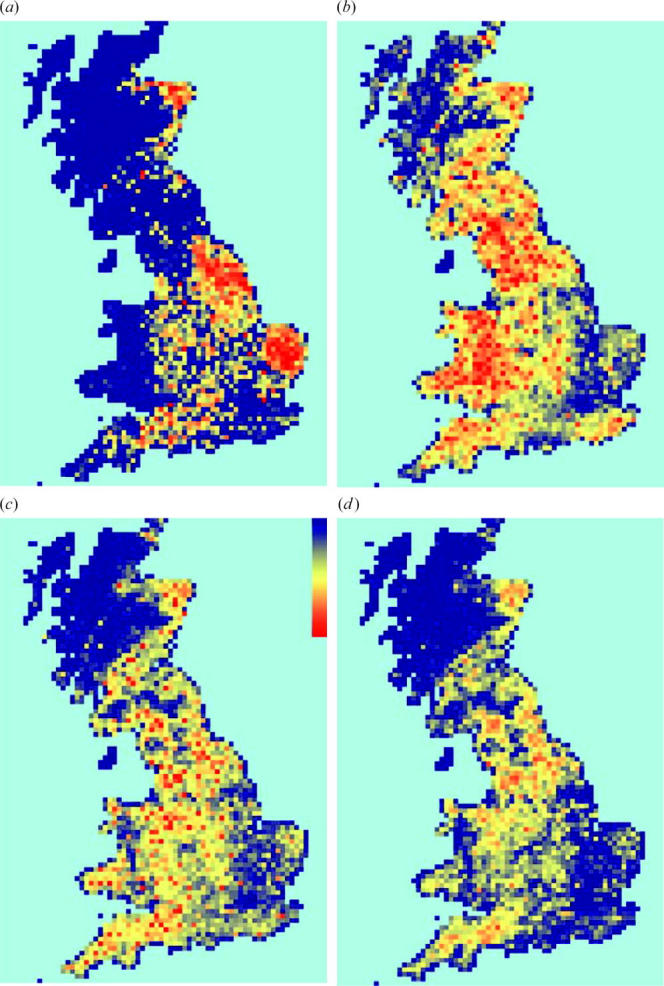
(a–c) Distributions of the numbers of animals moved across the whole 2003–2004 movements data: (a) pigs (26×106), (b) sheep (51×106) and (c) cattle (24×106). (d) IP distribution at the autumn 2004 peak in sheep trading (full model). Blue indicates low density and red, high.
As might be expected from figure 2, the distribution of infectious cases closely matches the distribution of the cattle movements themselves (figure 3), since sheep movements alone support only small epidemics, and the long standstill period in pigs precludes fast epidemic spread.
Here, we further consider the relative risk of an epidemic arising in various sections of the UK livestock industry. The network communities corresponding to the epidemic peak in 2004 are shown in figure 4, indicating a large variation in sizes and a strong geographical basis. The largest communities cover extensive sections of the country.
Figure 4.

Communities of holdings linked by livestock movements at the 2004 peak in sheep trading based on four weeks of movements data.
Simulations were seeded in each of the largest seven communities, with three seeds in each model run. The epidemic size achieved over 28 days, when seeded in a single community, is shown in figure 5, indicating a large variation in the size of epidemics among communities. For sheep movements only, epidemic size was greatest for Scotland (community 4) and the north of England (3), and lowest for the east of England (5).
Figure 5.

(a, b) Total epidemic size (y-axis) versus measured across the seeds at the 2004 peak in sheep trading: (a) sheep movements and (b) full model. Each point represents epidemics seeded in one community, coded as in figure 4, and seeded at random across all communities (*). Confidence intervals of 99% on the mean size of 20 sets of epidemics, each over 600 seeds are shown. (c) Median and interquartile range of epidemic size (y-axis) versus for 40 simulations of epidemics from specific seeds (sheep movements).
In figure 5, epidemic size is plotted against for each community. For sheep movements only, the value of is strongly correlated with epidemic size (r2=0.96), indicating that the expected number of infections generated by an index case gives a good indication of the severity of a resulting epidemic. The correlation is similar, but weaker for the full model (figure 5b; r2=0.83). Though estimates of can be used to identify at-risk communities, owing to the stochastic nature of the epidemic process, its power for predicting the resultant epidemic size from a single seed is low (figure 5c). Though mean varies between communities, there is no clustering of at smaller spatial scales. This is demonstrated in the electronic supplementary material A1, which presents spatial statistics for .
The rankings of epidemic severity across communities are similar for sheep movements and the full model, though the two northerly communities are more susceptible to large epidemics through sheep movements alone, as might be expected given the large numbers of sheep in these communities (figure 1). Considering sheep movements alone, the two northern communities also have a longer mean length of infectious connection di: 81 km for community 3 and 93 km for community 4, compared with means close to 50 km for the other communities.
The key model parameters in these simulations that must be inferred from data are the three transmission probabilities μm_sheep, μm_other and μsheep, and the local transmission rate β. The sensitivity of epidemic size to these parameters is explored in the electronic supplementary material A2. Close to the default values described in §2c, parameter sensitivity is high and the epidemic size is proportional to the values of μ used. The temporal and community patterns of epidemic sizes are robust to parameter changes around the default values.
4. Discussion
The model shows that a large epidemic confined to the sheep industry is only likely during the autumn peak of trading. This is encouraging, as it is within the sheep population that the possibility of an undetected epidemic is the greatest: in cattle and pigs, symptoms are more clearly visible (Gibbens et al. 2001), and therefore, early detection of disease is more likely. It also suggests that policy changes since 2001 have successfully reduced the likelihood of a similar epidemic occurring again. Initial spread in 2001 was via sheep movements, and simulations predict that no similar spread through spring sheep trading would occur now. The introduced standstill periods effectively slow the progress of disease. For example, the East of England, dominated by a pig industry with a 20-day standstill, suffered smaller simulated epidemics, despite numbers of pigs moved being comparable to numbers of cattle moved (figure 3).
Identification of at-risk parts of the livestock industry may further benefit biosecurity; surveillance effort can be prioritized where and when it is most needed, both routinely, and reactively in the event of an epidemic. Here, markets are important surveillance targets; though small in number, they allow fast dissemination of livestock across large areas, and the simulations indicate that infection of markets is a prerequisite for a large epidemic.
Movements can quickly spread FMD spatially, as indicated by the relatively large mean distance of infectious movements and the large geographical extent of the communities. However, an implicit assumption discussed earlier is that all the long-range transmission occurs through animal movements. Though there is no evidence for extensive long-range transmission of FMD by other routes in 2001 (Gibbens et al. 2001), this assumption ignores other possible long-range transmission routes, such as fomite transfer through vehicle or personnel movements or windborne spread across long distances. As windborne spread was an important factor in the 1967 UK epidemic, this is an important consideration (Tinline 1970). Inclusion of spread through unreported movements within an SOA in our simulations does not greatly increase either epidemic size or spatial extent. Omission of these movements then is unlikely to substantially bias epidemiological conclusions made in this analysis. Sensitivity analysis shows that model results are highly sensitive to small changes in the transmission parameters around the values used in these simulations, and hence accurate parametrization will be important if quantitative measures of epidemic size are to be obtained.
Though the above results represent many model realizations, they are all based on the same sample of data. Any predictions made about future epidemic risk are therefore conditional on the current and the future livestock movement patterns resembling those from 2003 to 2004. The close resemblance between the results from 2003 to 2004 suggests, however, that trading structure is currently similar across years.
The spatial distribution of suggests that though is highly variable between holdings, there are no trends at regional scales. Measured is therefore a good indicator of regional epidemic risk. It is also well correlated with the epidemic size between communities. The only distinct outlier in figure 5a,b is community 5, a community dominated by the pig industry, where longer standstill periods apply.
FMD might enter the country through many routes. The most appropriate method of seeding a simulation would depend on the route of entry. Holdings vary in size, species held and the numbers of animals traded, and are neither equally susceptible nor equally likely to be the source of an epidemic. Earlier, we account for much of this heterogeneity by seeding only holdings that trade livestock. Nevertheless, there are limitless ways in which an epidemic simulation might be seeded depending on the assumptions made as to its origin. The choice of seeding will in turn affect epidemic size.
Our model provides a framework where livestock movements data can be used to predict the spread of disease through trading. The empirical approach used represents an advance over simpler measures of modelling transmission at a distance, made possible by the development of comprehensive movements databases. Though here, we consider FMD, movement-related spread has been considered for other diseases, such as bovine tuberculosis (BTB; Gilbert et al. 2005). With appropriate parametrization, the model could be adapted to simulate BTB or any disease, where movement-related spread is a substantial risk factor.
Acknowledgements
Community membership data are kindly provided by Leon Danon. R.R.K. and I.Z.K. are funded by the Wellcome Trust. D.G. is funded by DEFRA.
Supplementary Material
Figures A1 and A2; Appendix A1, spatial statistics of, figures A3 and A4; Appendix A2, model sensitivity analysis, further references, figures A5–A11.
References
- Alexandersen S, Quan M, Murphy C, Zhang Z. Studies of quantitative parameters of virus excretion and transmission in pigs and cattle experimentally infected with foot-and-mouth disease virus. J. Comp. Pathol. 2003;129:268–282. doi: 10.1016/S0021-9975(03)00045-8. [DOI] [PubMed] [Google Scholar]
- Anderson I. The Stationary Office; London, UK: 2002. Foot & mouth disease 2001: lessons to be learned inquiry report. [Google Scholar]
- Anon. National Audit Office; London, UK: 2003. Identifying and tracking livestock in England. [Google Scholar]
- Anon. 2004 Scottish executive: the disease control (interim measures) (Scotland) Order 2002. The disease control (interim measures) (England) Order 2003. Digest March 2004. See http://www.scottishexecutive.gov.uk/Resource/Doc/915/0007505.pdf.
- Christley R.M, Robinson S.E, Lysons R, French N.P. Network analysis of cattle movement in Great Britain. In: Mellor D.J, Russell A.M, Wood J.L.N, editors. Proc. Soc. for Veterinary Epidemiology and Preventive Medicine. Nairn; Scotland, UK: 2005. pp. 234–244. [Google Scholar]
- Davies G. The foot and mouth disease (FMD) epidemic in the United Kingdom 2001. Comp. Immunol. Microbiol. Infect. Dis. 2001;25:331–343. doi: 10.1016/S0147-9571(02)00030-9. [DOI] [PubMed] [Google Scholar]
- DEFRA 2004. Confirmed cases of FMD in 2001 epidemic. See http://www.defra.gov.uk/footandmouth/cases/index.htm.
- Ferguson N.M, Donnelly C.A, Anderson R.M. The foot-and-mouth epidemic in Great Britain: pattern of spread an impact of interventions. Science. 2001;292:1155–1160. doi: 10.1126/science.1061020. [DOI] [PubMed] [Google Scholar]
- Gibbens J.C, Sharpe C.E, Wilesmith J.W, Mansley L.M, Michalopoulou E, Ryan J.B.M, Hudson M. Descriptive epidemiology of the 2001 foot-and-mouth disease epidemic in Great Britain: the first five months. Vet. Rec. 2001;149:729–743. [PubMed] [Google Scholar]
- Gilbert M, Mitchell A, Bourn D, Mawdsley J, Clifton-Hadley R, Wint W. Cattle movements and bovine tuberculosis in Great Britain. Nature. 2005;435:419–496. doi: 10.1038/nature03548. [DOI] [PubMed] [Google Scholar]
- Kao R.R. The role of mathematical modelling in the control of the 2001 FMD epidemic in the UK. Trends Microbiol. 2002;10:279–286. doi: 10.1016/S0966-842X(02)02371-5. [DOI] [PubMed] [Google Scholar]
- Kao R.R. The impact of local heterogeneity on alternative control strategies for foot-and-mouth disease. Proc. R. Soc. B. 2003;270:2557–2564. doi: 10.1098/rspb.2003.2546. [DOI] [PMC free article] [PubMed] [Google Scholar]
- Kao, R. R., Danon, L., Green, D. M. & Kiss, I. Z. In press. Demographic structure and pathogen dynamics on the network of livestock movements in Great Britain. Proc. R. Soc. B. ( 10.1098/rspb.2006.3505) [DOI] [PMC free article] [PubMed]
- Keeling M.J, et al. Dynamics of the 2001 UK foot and mouth epidemic: stochastic dispersal in a heterogeneous landscape. Science. 2001;294:813–817. doi: 10.1126/science.1065973. [DOI] [PubMed] [Google Scholar]
- Kiss, I. Z., Kao, R. R. & Green, D. M. In press. The network of sheep movements with Great Britain: network properties and their implications for infectious disease spread. J. R. Soc. Interface. ( 10.1098/rsif.2006.0129) [DOI] [PMC free article] [PubMed]
- May R.M, Lloyd A.L. Infection dynamics on scale-free networks. Phys. Rev. E. 2001;66:066 112. doi: 10.1103/PhysRevE.64.066112. [DOI] [PubMed] [Google Scholar]
- Newman M.E.J. Fast algorithm for detecting community structure in networks. Phys. Rev. E. 2004;66:066 133. doi: 10.1103/PhysRevE.69.066133. [DOI] [PubMed] [Google Scholar]
- Pollott, G. E., 1998. Sheep breeds and breeding in Britain 1996–1997. In Sheep yearbook 1998, pp. 37–53. Milton Keynes, UK: Meat and Livestock Commission.
- Tinline R. Lee wave hypothesis for initial pattern of spread during 1967–68 foot and mouth epizootic. Nature. 1970;227:860–862. doi: 10.1038/227860b0. [DOI] [PubMed] [Google Scholar]
Associated Data
This section collects any data citations, data availability statements, or supplementary materials included in this article.
Supplementary Materials
Figures A1 and A2; Appendix A1, spatial statistics of, figures A3 and A4; Appendix A2, model sensitivity analysis, further references, figures A5–A11.