Abstract
The Stanford Microarray Database (SMD; http://genome-www.stanford.edu/microarray/) serves as a microarray research database for Stanford investigators and their collaborators. In addition, SMD functions as a resource for the entire scientific community, by making freely available all of its source code and providing full public access to data published by SMD users, along with many tools to explore and analyze those data. SMD currently provides public access to data from 3500 microarrays, including data from 85 publications, and this total is increasing rapidly. In this article, we describe some of SMD's newer tools for accessing public data, assessing data quality and for data analysis.
INTRODUCTION
DNA microarrays have become an increasingly common tool for massively parallel measurements of gene expression (1,2), DNA copy number (3,4), protein–DNA interaction (5,6), and other genomic investigations (7,8). A single experiment may involve dozens of microarrays, each containing tens of thousands of spots for which dozens of measurements are recorded, resulting in millions of pieces of information. The point is quickly reached at which a full-featured database is necessary to efficiently deal with the information produced in microarray experimentation.
The Stanford Microarray Database (SMD; http://genome-www.stanford.edu/microarray/), a research database for Stanford-affiliated and other registered users, makes freely available the data for over 3500 two-colour, spotted DNA microarrays. The number of publicly accessible arrays is increasing by about 1000 per year. These public data include experiments on twelve distinct organisms, including Homo sapiens, Caenorhabditis elegans, Arabidopsis thaliana, Saccharomyces cerevisiae, Drosophila melanogaster and Escherichia coli. SMD provides online tools for browsing and selecting experimental data, assessing data quality, filtering by individual spot characteristics and by expression pattern and analyzing data via hierarchical clustering or self-organizing maps, as well as extensive help and tutorials on how to use these tools (http://genome-www.stanford.edu/microarray/helpindex.html). SMD's software is open source and has been installed at a dozen institutions worldwide, and its schema and table definitions are browsable on the web (http://genome-www.stanford.edu/microarray/doc/db_specifications.html). Here, we discuss some of our newer tools for data access and quality assessment, which, like most of our tools, are available for use with our public data.
Data selection by array: publications
Data in SMD are always made available to the public upon publication in a peer-reviewed forum, or earlier at the discretion of the experimenter, because public access to all published data is crucial for re-analysis and further exploration. SMD currently makes available more public microarray data than any other microarray database or repository in the world.
All data contained within SMD for a published experiment set are available through the publication interface (http://genome-www.stanford.edu/microarray/publication.html). For each publication, links are provided to the full text journal article (when available), to the NCBI PubMed record, to any supplemental website and to the data within SMD. Data from individual microarrays from the publication are organized into appropriate experimental sets, and the raw data are fully available for either download via FTP or online analysis using all of SMD's tools. This facilitates both re-examination for quality assessment and independent analysis of the data.
SMD also provides other search functions and an FTP site, organized by organism, from which data from all public microarrays in SMD may be easily retrieved (ftp://genome-ftp.stanford.edu/pub/smd/organisms/).
Data selection by gene: expression history
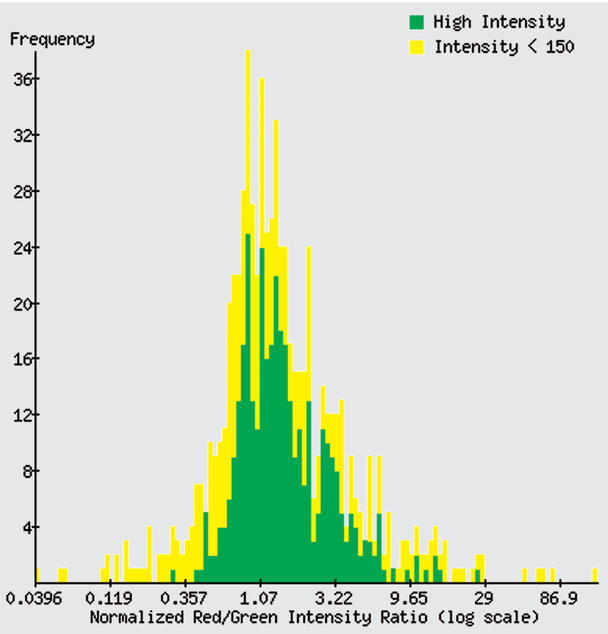
Users may survey the behaviour of a gene or clone of interest across all microarrays in which it appears using the Expression History tool (Fig. 1). This facilitates a ‘gene-centric’ rather than ‘array-centric’ approach to microarray results. Users from the general research community may use this tool, but the results displayed are restricted to the arrays whose data have been made public. To enter the Expression History tool, a user can first use the ‘Name Details’ search, which allows wild-card searches for gene name, clone ID and other systematic identifiers or descriptions. The resulting list of matches provides links to Expression History, which is an interactive, graphical display showing the frequency distribution of measured ratio values for a single gene across all arrays to which the user has access. Microarrays may be selected across user-determined ranges of ratio values by clicking on the image; those experiments may then be examined in detail, downloaded, or clustered. The full data set used to generate the distribution may also be downloaded.
Figure 1.
Frequency distribution of ratio results for human clone cDNA image: 461759 (OLR1), from the Expression History tool. Ratios derived from 683 distinct spots, from 863 public arrays on which the clone was printed, are displayed on a log scale (spots ‘flagged’ as unreliable are omitted). Spots that have a high intensity in each channel are more likely to be reliable; these are indicated by the green bars. The yellow bars represent less reliable measurements, with intensity below a threshold value in at least one channel. The user may set the threshold intensity value.
Data visualization: array color
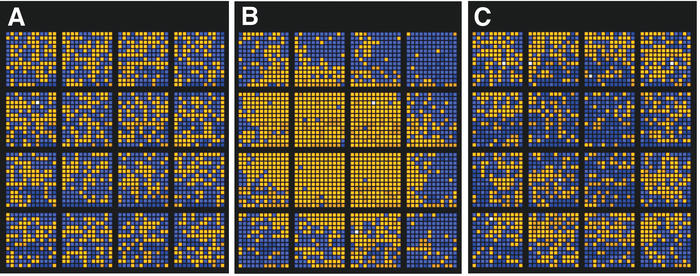
Microarray data are often difficult to assess for quality. To complement various quality assessment tools included in microarray image analysis suites such as GenePix (Axon Instruments, Union City, California), SMD provides a variety of utilities. The Array Color tool provides a simplified view of the ratio data for a given microarray, allowing the user to quickly examine the microarray for evidence of global effects such as systematic biases corresponding to spatial location or printing plate of origin (Fig. 2). This tool can be used to assess the quality of arrays that SMD researchers have made public.
Figure 2.
Simplified views of three microarray slides, from the Array Color tool. Spots are shown in topologically correct positions, but not to scale. Sectors (each printed by an individual pin) are distinct blocks of spots. Spots with a ratio of channel 2 (red) intensity to channel 1 (green) intensity of greater than 1.0 are represented by an orange square; spots with ratio less than 1.0 are blue. White spots have a ratio of 1.0. Spots with a low intensity in either channel are slightly darker. The tool allows the user to set the ratio and intensity thresholds and choose raw or normalized data for display. Also presented are ANOVA calculations for dependence of ratio on sector or printing plate, and a mean-variance plot of ratio by sector. Flagged (poorly measured) spots are shown as black and omitted from the ANOVA calculations. (A) This array shows no strong dependence of ratio on sector [F(15, 2471)=2.18, R2=0.01] or printing plate [F(6, 2480)=9.69, R2=0.02]. (B) This array shows a strong dependence of ratio on location [F(15, 2480)=72.52, R2=0.31] and weak to moderate dependence on printing plate [F(15, 2480)=22.48, R2=0.05]. (C) This array shows weak dependence of ratio on sector [F(15, 2464)=5.36, R2=0.03], but somewhat stronger dependence on printing plate [F(6, 2473)=35.56, R2=0.08]. The dependence on printing plate is difficult to pick out by visual inspection alone.
In addition to the graphical display, the Array Color tool provides two simple one-way analysis of variance (ANOVA) calculations (9), measuring the dependence of per-spot ratio on printing plate of spot origin, and on sector (printing pin) as a proxy for spatial location. ANOVA is a common statistical method for assessing the significance and strength of the relationships of results to categorical variables. Arrayed DNA is typically printed by a rectangular array of pins, which make sequential ‘dips’ into a series of 384-well microtiter plates; each sector, printed by an individual pin, contains spots from all plates. Given a typical, randomized layout of spots, no relationship would ordinarily be expected between ratio values and spatial location or printing plate of origin. Dependence upon printing plate may indicate problems with the PCR or other DNA-generation steps employed. Dependence upon sector usually indicates problems with the hybridization process, such as evaporation of the hybridization solution.
FUTURE DIRECTIONS
SMD continues to develop as a resource to the microarray community. A desired improvement in public data access is the capacity to link directly to the Expression History tool from external genomic and sequence databases, allowing users of those databases to find microarray expression data for their genes of interest easily and quickly. The focus of SMD's current development efforts is to make SMD a MIAME-supportive database. MIAME (10) defines the Minimal Information About a Microarray Experiment that should be recorded. Further, we intend to develop the ability to output MIAME-compliant information in MAGE-ML (11), which provides a standardized XML-based vocabulary for exchanging microarray data. SMD strongly supports and is involved in efforts to define further these standards for microarray experiment annotation and transmission (http://www.mged.org/), which are now being adopted by major journals (12,13).
REFERENCES
- 1.Schena M., Shalon,D., Davis,R.W. and Brown,P.O. (1995) Quantitative monitoring of gene expression patterns with a complementary DNA microarray. Science, 270, 467–470. [DOI] [PubMed] [Google Scholar]
- 2.Wen X., Fuhrman,S., Michaels,G.S., Carr,D.B., Smith,S., Barker,J.L. and Somogyi,R. (1998) Large-scale temporal gene expression mapping of central nervous system development. Proc. Natl Acad. Sci. USA, 95, 334–339. [DOI] [PMC free article] [PubMed] [Google Scholar]
- 3.Forozan F., Mahlamaki,E.H., Monni,O., Chen,Y., Veldman,R., Jiang,Y., Gooden,G.C., Ethier,S.P., Kallioniemi,A. and Kallioniemi,O.P. (2000) Comparative genomic hybridization analysis of 38 breast cancer cell lines: a basis for interpreting complementary DNA microarray data. Cancer Res., 60, 4519–4525. [PubMed] [Google Scholar]
- 4.Pollack J.R., Perou,C.M., Alizadeh,A.A., Eisen,M.B., Pergamenschikov,A., Williams,C.F., Jeffrey,S.S., Botstein,D. and Brown,P.O. (1999) Genome-wide analysis of DNA copy-number changes using cDNA microarrays. Nature Genet., 23, 41–46. [DOI] [PubMed] [Google Scholar]
- 5.Winssinger N., Ficarro,S., Schultz,P.G. and Harris,J.L. (2002) Profiling protein function with small molecule microarrays. Proc. Natl Acad. Sci. USA, 99, 11139–11144. [DOI] [PMC free article] [PubMed] [Google Scholar]
- 6.Ren B., Robert,F., Wyrick,J.J., Aparicio,O., Jennings,E.G., Simon,I., Zeitlinger,J., Schreiber,J., Hannett,N., Kanin,E., Volkert,T.L., Wilson,C.J., Bell,S.P. and Young,R.A. (2000) Genome-wide location and function of DNA binding proteins. Science, 290, 2306–2309. [DOI] [PubMed] [Google Scholar]
- 7.Golub T.R., Slonim,D.K., Tamayo,P., Huard,C., Gaasenbeek,M., Mesirov,J.P., Coller,H., Loh,M.L., Downing,J.R., Caligiuri,M.A., Bloomfield,C.D. and Lander,E.S. (1999) Molecular classification of cancer: class discovery and class prediction by gene expression monitoring. Science, 286, 531–537. [DOI] [PubMed] [Google Scholar]
- 8.Perou C.M., Jeffrey,S.S., van de Rijn,M., Rees,C.A., Eisen,M.B., Ross,D.T., Pergamenschikov,A., Williams,C.F., Zhu,S.X., Lee,J.C.F., Lashkari,D., Shalon,D., Brown,P.O. and Botstein,D. (1999) Distinctive gene expression patterns in human mammary epithelial cells and breast cancers. Proc. Natl Acad. Sci. USA, 96, 9212–9217. [DOI] [PMC free article] [PubMed] [Google Scholar]
- 9.Walpole R.E. and Myers,R.H. (1993) Probability and Statistics for Engineers and Scientists, 5th Edn. Macmillan Publishing Company, New York, NY.
- 10.Brazma A., Hingamp,P., Quackenbush,J., Sherlock,G., Spellman,P., Stoeckert,C., Aach,J., Ansorge,W., Ball,C.A., Causton,H.C., Gaasterland,T., Glenisson,P., Holstege,F.C., Kim,I.F., Markowitz,V., Matese,J.C., Parkinson,H., Robinson,A., Sarkans,U., Schulze-Kremer,S., Stewart,J., Taylor,R., Vilo,J. and Vingron,M. (2001) Minimum information about a microarray experiment (MIAME)-toward standards for microarray data. Nature Genet., 29, 365–371. [DOI] [PubMed] [Google Scholar]
- 11.Spellman P.T., Miller,M., Stewart,J., Troup,C., Sarkans,U., Chervitz,C., Bernhart,D., Sherlock,G., Ball,C., Lepage,M., Swiatek,M., Marks,W.L., Goncalves,J., Markel,S., Iordan,D., Shojatalab,M., Pizzaro,A., White,J., Hubley,R., Deutsch,E., Senger,M., Arnow,B.J., Robinson,A., Bassett,D., Stoeckert,C. and Brazma,A. (2002) Design and implementation of Microarray Gene Expression Markup Language (MAGE-ML). Genome Biol., 3, research0046.1–0046.9. [DOI] [PMC free article] [PubMed] [Google Scholar]
- 12.Editorial (2002) Microarray standards at last. Nature, 419, 323. [DOI] [PubMed] [Google Scholar]
- 13.Ball C.A., Sherlock,G., Parkinson,H., Rocca-Sera,P., Brooksbank,C., Causton,H.C., Cavalieri,D., Gaasterland,T., Hingamp,P., Holstege,F., Ringwald,M., Spellman,P., Stoeckert,C.J., Stewart,J.E., Taylor,R., Brazma,A. and Quackenbush,J. (2002) A guide to microarray experiments—an open letter to the scientific journals. Lancet, 360, 1019. [PubMed] [Google Scholar]


