


Abstract
TRANSPATH® is a database system about gene regulatory networks that combines encyclopedic information on signal transduction with tools for visualization and analysis. The integration with TRANSFAC®, a database about transcription factors and their DNA binding sites, provides the possibility to obtain complete signaling pathways from ligand to target genes and their products, which may themselves be involved in regulatory action. As of July 2002, the TRANSPATH Professional release 3.2 contains about 9800 molecules, >1800 genes and >11 400 reactions collected from ∼5000 references. With the ArrayAnalyzer™, an integrated tool has been developed for evaluation of microarray data. It uses the TRANSPATH data set to identify key regulators in pathways connected with up- or down-regulated genes of the respective array. The key molecules and their surrounding networks can be viewed with the PathwayBuilder™, a tool that offers four different modes of visualization. More information on TRANSPATH is available at http://www.biobase.de/pages/products/databases.html.
INTRODUCTION
The mammalian genome is regulated by a plethora of transcription factors. In many cases, their activity depends on signals that are transmitted by extra- and intracellular pathways. Via cross talk and positive or negative feedback loops, these pathways can combine to form very complex networks. Although the single elements (mostly proteins) are often involved in a variety of pathways, cells respond to signals in a very specific manner. Today, signaling specificity is not entirely understood and, among other things, can result from specific spatiotemporal distribution of signaling molecules, well directed degradation, modulation of kinetics, nongeneric receptors or tissue-specific effectors (1,2). Knowledge about these mechanisms is essential for understanding cellular behavior and predicting the causes of dysregulation, which can lead to cancer or other diseases.
An understanding of the cellular regulatory machinery is also necessary to interpret the vast amount of data on the abundance of gene transcripts and protein–protein interactions that has been generated by newly developed technologies and methods such as microarray chips or yeast two-hybrid screens. Here, a knowledge base that combines the organized storage of signal transduction data with a tool to analyze array data and to identify regulatory key molecules as potential drug targets will be useful.
STRUCTURE AND CONTENT
In early 2000, TRANSPATH® was shifted from an object-oriented database system (3) to a relational one to facilitate the integration with the relational TRANSFAC® system. This system comprises databases about transcription factors and their DNA binding sites (TRANSFAC), composite elements (TRANScompel™), scaffold/matrix attached regions (S/MARt DB™) and pathologically modified transcription factors (PathoDB®) (4–6). For TRANSPATH, flat file releases that condense the information from more than thirty tables to three files are produced. Molecule describes proteins and other components such as small effectors (Ca2+ ions, NO) that transduce extracellular signals to target genes and specifies their intracellular and tissue-specific distribution. Gene contains information on target genes and gene expression as starting points for regulatory pathways or feedback loops. Reaction entries connect signaling molecules, give information on the interaction mechanism and effects, and constitute paths, pathways and networks (7). In most cases, reactions are directed and allow pathway upstream or downstream queries. This is different from approaches of protein–protein interaction databases such as BIND (8), DIP (9) and MINT (10).
For TRANSPATH professional, quarterly releases are produced. In comparison with the latest public version 1.5 (November 1999; http://www.gene-regulation.com), the professional version consists of far more data (Fig. 1) and provides the functionality of advanced tools for visualization and analysis. The 3.2 release of TRANSPATH contains >9800 molecules, >1800 genes and >11 400 reactions (Fig. 1) with a focus on mammals such as human, mouse and rat. The annotation approach is a reaction-centric and biological topic-specific one. Basic information on molecule features such as amino acid sequence or functional classification is included, but it was not our objective to reproduce existing protein databases such as SWISS-PROT or PIR. Annotation work focuses on an increasing number of topics such as cell cycle regulation or apoptosis, which we model in detail. All data has been manually extracted from the literature [except an initial molecule import from SWISS-PROT release 36 (1129 entries)] and is curated and updated (update rate for molecules: 63% with at least one update) by specialist annotators. Contradictory information and conflicting data are indicated in the comments section and the references are cited. Cross-references to important sequence and signature databases such as EMBL/GenBank, SWISS-PROT, InterPro, or LocusLink are provided. The integration into the TRANSFAC system allows direct access to detailed information about transcriptional regulators and their target genes.
Figure 1.

Development of the TRANSPATH data content 2000–2002 [without imported molecule entries (SWISS-PROT release 36)].
As an exchange format, XML flat files of TRANSPATH data and a corresponding, continuously updated Document Type Definition (DTD) are available.
QUALITY EVALUATION
Experiments that provide evidence for protein–protein binding or enzymatic reactions have a different significance for the signalling mechanisms taking place at the cellular level, depending on the biological material used and the methods applied. Biological material can be extracted from a complete organism, for example a knockout mutant, or in vitro translated polypeptides. Thus, reactions obtained from experiments with different biological materials have different probabilities for existing in vivo. We provide a reliability value for each combination of material and method on a scale of 1–5 (highest to lowest reliability concerning the biological relevance) and assign it to the respective reactions in the quality field. For reactions that have more than one experimental evidence, the best value is shown. This enables the database user to query and view networks with respect to a selectable reliability threshold. Only data from peer-reviewed publications are used. If controls are missing or are not credible in a specific paper, the data will not be included.
QUERYING THE DATABASE AND NETWORK VISUALIZATION
The value of a database depends largely on its ability to answer different kinds of questions. For a signal transduction database, the main interest may focus on the function and location of single components, the organization of pathways with cross-talking points and regulatory loops, or the physiological context of signaling events. TRANSPATH provides a variety of ways to access its data. Specific entries can be searched for by name (including synonyms) or by SWISS-PROT or GenBank accession numbers, for example. The search engine can be applied on all data fields of the flat files and combined queries using the logical operators AND, OR, or NOT are possible. Perl regular expressions can be used to refine a query.
To find information about the signaling network around the protein kinase Raf-1, for example, enter the name as the search term in the molecule search window. Wildcards are set automatically. ‘Name’ is the standard search field setting and queries all synonyms as well. If you are especially interested in human Raf-1, you can select the specific molecule information or a quick network visualization from the search results list. The molecule entry for human Raf-1 contains, besides protein information, lists of all connected reactions upstream or downstream and of all modified forms (such as phosphorylated states or complexes) the molecule can assume. The interface of the visualization tool PathwayBuilder™ can be accessed from each entry.
A new feature in release 3.2 is a browse function for the Molecule table, where different hierarchical levels (e.g. receptors, cytokines) are accessible via a functional classification tree. For a first pathway overview, a number of manually drawn maps with direct links to the corresponding entries are available. To find out more about functions and the intracellular distribution of molecules, Gene Ontology (GO) terms can be applied in a query, for example.
To visualize the pathways and networks that are built up by molecules, genes and reactions, the PathwayBuilderTM provides four different visualization modes. Selectable parameters such as network expansion, pathway direction, complexity and applicable filters allow the creation of specific views.
ANALYSIS
The ArrayAnalyzer™ in TRANSPATH is a new approach for efficiently finding regulatory key molecules as potential new drug targets for a given set of genes or proteins (e.g. microarray data). The tool makes use of the high connectivity of signaling networks with their cross-talking events and feedback circuits. It identifies common elements (molecules or genes) in pathways, in which the set members are involved. These common nodes can act as key regulators or effectors and are detected in an upstream or downstream analysis, respectively.
Performing an array data analysis in TRANSPATH is a step-by-step procedure. First, genes/proteins have to be searched for in the database. It is possible to search for many strings describing genes or proteins in one data field at once (e.g. name, external database hyperlink). At this step, expression level values from microarray experiment results can be attached to the single strings. Database retrieval is possible via EMBL/GenBank or SWISS-PROT accession numbers or via Affymetrix probe set identifiers, to name a few.
Whenever a search result contains at least two entries, the ArrayAnalyzer™ can be started. It is possible to adjust the direction of the analysis, which determines whether the array data are downstream or upstream (in terms of pathway direction) of the sought-after key molecules. The maximum distance, i.e. the permitted number of reaction steps, is specified by the distance option and can be used to focus the output. All objects that are outside of this search radius are considered unreachable. Another option allows you to specify the number of reactions to be taken into account. It is possible to incorporate reactions taking place at higher molecule hierarchy levels (e.g. orthologue level). This has the advantage that if, for example, information about a specific reaction step in a human pathway is missing, the gap can be filled with abstracted corresponding information derived from other species. Similarly, reactions that are connected to modified forms of the data set's corresponding proteins, such as complexes or phosphorylated states, can be included. Both options increase the number of reactions that are available for the analysis and enlarge the probability of retrieving sub-networks that contain a high number of nodes from the array data set.
Once the key molecules are identified, it is possible to display the results with the PathwayBuilder™ in a compact way. All parts of the picture that are not absolutely necessary to precisely represent the sub-network, comprising those molecular components which the array data have shown to be up or down-regulated, can be cut off (Fig. 2).
Figure 2.
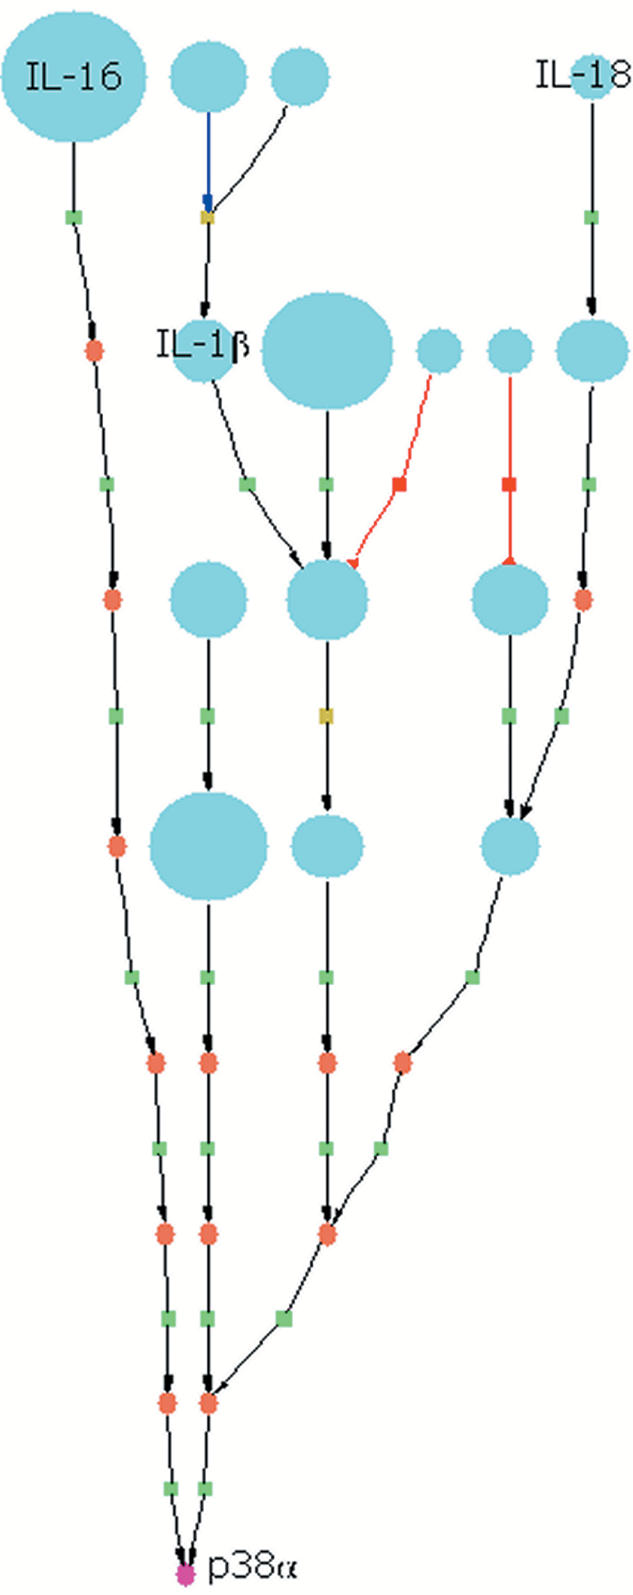
Identification of the mitogen-activated protein kinase p38α (in magenta) as a common effector for a set of molecules (in blue) that correspond to upregulated or downregulated genes from a microarray experiment. Among others, the set includes the cytokines IL-1β, IL-16 and IL-18 that stimulate pathways leading to downstream activation of p38α. Different expression levels are represented by symbol size. Little rectangles symbolize reactions (green=activation, red=inhibition, yellow=undefined). The brown oval shapes represent molecules that where not in the set.
FUTURE DIRECTIONS
The main objectives for future work include increasing the database content, enhancing the performance and functionality of the visualization and analysis tools, and simulating dynamic signaling behaviour to establish TRANSPATH as a tool for drug target discovery. The database content will be augmented by high quality manual annotation and, where appropriate, by additional in silico derived (e.g. from domain-matching promoter-analysis) or high-throughput data, which will be labeled as such. The broader and more refined data set and the more complex network connectivity will amplify the functionality of the ArrayAnalyzerTM.
REFERENCES
- 1.Tan P.B.O. and Kim,S.K. (1999) Signaling specificity—the RTK/RAS/MAP kinase pathway in metazoans. Trends Genet., 15, 145–149. [DOI] [PubMed] [Google Scholar]
- 2.Hunter T. (2000) Signaling—2000 and Beyond. Cell, 100, 113–127. [DOI] [PubMed] [Google Scholar]
- 3.Schacherer F., Choi,C., Götze,U., Krull,M., Pistor,S. and Wingender,E. (2001) The TRANSPATH signal transduction database: a knowledge base on signal transduction networks. Bioinformatics, 17, 1053–1057. [DOI] [PubMed] [Google Scholar]
- 4.Wingender E., Chen,X., Fricke,E., Geffers,R., Hehl,R., Liebich,I., Krull,M., Matys,V., Michael,H., Ohnhäuser,R., Prüß,M., Schacherer,F., Thiele,S. and Urbach,S. (2001) The TRANSFAC system on gene expression regulation. Nucleic Acids Res., 29, 281–283. [DOI] [PMC free article] [PubMed] [Google Scholar]
- 5.Kel-Margoulis O.V., Kel,A.E., Reuter,I., Deineko,I.V. and Wingender,E. (2002) TransCOMPEL: a database on composite regulatory elements in eukaryotic genes. Nucleic Acids Res., 30, 332–334. [DOI] [PMC free article] [PubMed] [Google Scholar]
- 6.Liebich I., Bode,J., Frisch,M. and Wingender,E. (2002) S/MART db: a database on scaffold/matrix attached regions. Nucleic Acids Res., 30, 372–374. [DOI] [PMC free article] [PubMed] [Google Scholar]
- 7.Potapov A. and Wingender,E. (2001) Modeling the architecture of regulatory networks. In Wingender,E., Hofestaedt,R. and Liebich,I. (eds), Proceedings of the German Conference on Bioinformatics (GCB'01). GBF Braunschweig, pp. 6–10.
- 8.Bader G.D., Donaldson,I., Wolting,C., Ouellette,B.F., Pawson,T. and Hogue,C.W. (2001) BIND—The Biomolecular Interaction Network Database. Nucleic Acids Res., 29, 242–245. [DOI] [PMC free article] [PubMed] [Google Scholar]
- 9.Xenarios I., Salwinski,L., Duan,X.J., Higney,P., Kim,S. and Eisenberg,D. (2002) DIP: The Database of Interacting Proteins. A research tool for studying cellular networks of protein interactions. Nucleic Acids Res., 30, 303–305. [DOI] [PMC free article] [PubMed] [Google Scholar]
- 10.Zanzoni A., Montecchi-Palazzi,L., Quondam,M., Ausiello,G., Helmer-Citterich,M. and Cesareni,G. (2002) MINT: a Molecular INTeraction database. FEBS Lett., 513, 135–140. [DOI] [PubMed] [Google Scholar]