Abstract
We have studied the temperature dependence of the IR stretch bands of carbon monoxide (CO) in the Xe 4 internal cavity of myoglobin mutant L29W-S108L at cryogenic temperatures. Pronounced changes of band areas and positions were analyzed quantitatively by using a simple dynamic model in which CO rotation in the cavity is constrained by a static potential. The librational dynamics of the CO causes a decrease of the total spectral area. A strong local electric field splits the CO stretch absorption into a doublet, indicating that CO can assume opposite orientations in the cavity. With increasing temperature, the two peaks approach each other, because the average angle of the CO with respect to the electric field increases. A combined classical and quantum-mechanical analysis precisely reproduces the observed temperature dependencies of both spectral area and peak shifts. It yields the height of the energy barrier between the two wells associated with opposite CO orientations, V0 ≈ 2 kJ/mol, and the frequency of oscillation within a well, ω ≈ 25 cm-1. The electric field in the protein cavity was estimated as 10 MV/cm.
Even the simplest biological reactions exhibit a stunning level of complexity when studied in detail (1). The traditional chemical description in terms of transitions between a few discrete molecular species can only be a coarse approximation, because biological macromolecules are exceedingly complex physical systems that can assume a multitude of conformations (conformational substates) with markedly different structural and kinetic properties (2).
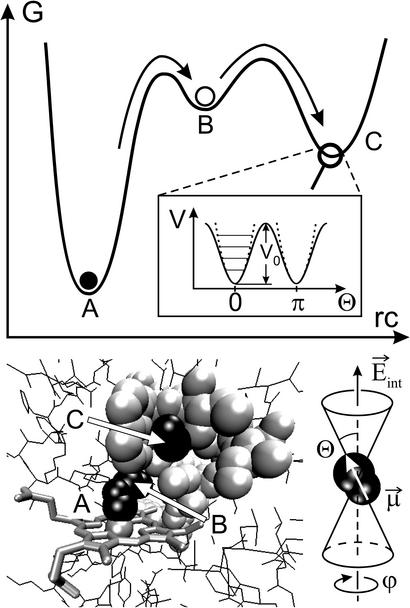
Ligand binding in myoglobin (Mb), a small heme protein in mammalian muscle, has served for a long time as a biological model reaction. Pioneering low-temperature flash photolysis studies of CO and O2 binding to Mb by Frauenfelder and coworkers (3) in the 70s gave clear evidence of protein structural heterogeneity as well as multiple intermediate states along the reaction pathway. Only in recent years have structural details of these intermediates become available. Fig. 1 shows a sketch of the free-energy surface governing ligand binding and a model of the active site of carboxymyoglobin (MbCO) (mutant L29W). After photodissociation, the CO moves from the bound-state location A to docking site B on top of the heme group. This primary photoproduct has been characterized by x-ray cryocrystallography of photolyzed MbCO crystals at 20–40 K (4–6). Fourier transform IR (FTIR) spectroscopy shows two distinct stretch bands for CO in state B (7, 8) that originate from two opposite orientations of the CO dipole with respect to an internal electric field. Recent femtosecond IR experiments (8) and time-resolved x-ray structure determinations (9) at room temperature have confirmed the relevance of docking site B in physiological ligand binding.
Fig. 1.
(Upper) Reaction free-energy surface of L29W-S108L mutant MbCO at low temperatures with bound state A and photoproduct states B and C. (Inset) Double-well potential governing the CO dynamics in state C. Solid lines, sine-squared potential; dashed lines, harmonic oscillator potential with quantized energy levels. (Lower Left) Structure of L29W mutant MbCO (10) showing the heme group and side chains lining the Xe 4 cavity as well as the CO ligand in states A (bound to the heme), B (on top of the heme), and C (in the Xe 4 cavity). (Lower Right) Depiction of CO in the Xe 4 cavity with its IR transition dipole fluctuating in a cone around the direction of the electric field.
Sites A and B are not the only internal locations available to ligands. Cryocrystallographic studies (10–12) have shown that, under proper illumination conditions, ligands can be chased into more remote, secondary docking sites C and D, which are identical to the internal, xenon-binding cavities Xe 4 and Xe 1, respectively (13). Ligand migration to secondary sites can be observed by the effects on CO stretch spectra (14) and on heme electronic transitions (15). At cryogenic temperatures, ligand rebinding from these cavities is orders of magnitude in time slower than from state B (16). Secondary sites also play an important role in room-temperature ligand binding (9).
In Mb mutants that have leucine 29 replaced by an aromatic side chain, ligands can migrate to the Xe 4 cavity, from where recombination occurs over much higher barriers than from site B (10, 14). In this work we photolyzed the Mb double mutant L29W-S108L to selectively populate the Xe 4 site (Fig. 1). Rebinding from this site occurs only above 80 K, which allows us to measure the stretch spectra of CO in this cavity in the absence of rebinding. A sophisticated analysis of the temperature dependence of the spectra yields information about the ligand dynamics as well as the magnitude of the electric field in the cavity.
Materials and Methods
Sample Preparation. Sperm whale Mb double mutant L29W-S108L was expressed in Escherichia coli, purified as described (17) and stored in lyophilized form. For the experiments, the protein powder was dissolved at a concentration of ≈15 mM in cryosolvent [75% glycerol/25% potassium phosphate buffer (vol/vol), pH 8.0], stirred under a CO atmosphere, and reduced with sodium dithionite solution. The CO gas contained an isotopic mixture of 50.2% 12C16O, 48.3% 13C16O, and 1.5% 13C18O as determined from the CO stretch band areas. For the spectroscopic experiments, a few microliters of the sample solution were sandwiched between two CaF2 windows (diameter 25.4 mm) separated by a 75-μm-thick mylar washer.
Low-Temperature FTIR Spectroscopy. The sample was mounted on the cold finger of a closed-cycle helium cryostat (SRDK-205AW, Sumitomo, Tokyo), which allowed us to adjust the sample temperature in the range between 3 and 320 K using a digital temperature controller (model 330, Lake Shore Cryotronics, Westerville, OH). Transmission spectra in the mid-IR (1,800–2,400 cm-1, 2 cm-1 resolution) range were collected with an FTIR spectrometer (IFS 66v/S, Bruker, Karlsruhe, Germany). Samples were photolyzed with a continuous wave, frequency-doubled Nd:YAG laser (Forte 530-300, Laser Quantum, Manchester, U.K.).
Experimental Results
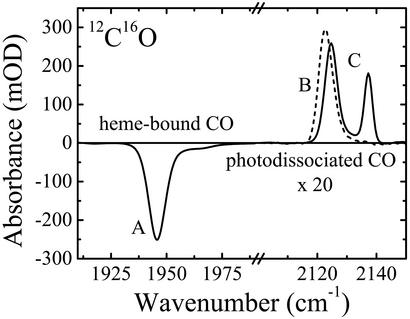
FTIR Spectra of 12C16O in States A–C. Fig. 2 shows a light-minus-dark difference spectrum of mutant MbCO L29W-S108L after 1 s of photolysis at 3 K. The heme-bound CO displays a dominant IR band at ≈1,947 cm-1 and a minority species at ≈1,965 cm-1. In the spectral range of the photodissociated CO, a single band at ≈2,123 cm-1 appears, indicating that CO in the B state on top of the heme group has a strong preference for a single orientation. The second photoproduct spectrum in Fig. 2 was obtained with the identical sample after cooling at a rate of 5 mK/s from 100 to 80 K under laser illumination and further to 3 K in the dark. This spectrum features two bands at 2,124 and 2,137 cm-1; it is characteristic of CO ligands that reside in the Xe 4 cavity (Fig. 1).
Fig. 2.
IR spectra of MbCO L29W-S108L at 3 K in the region of the heme-bound CO and photodissociated CO. Dashed line, 1-s illumination at 3 K (state B); solid line, slow cooling under light from 100 to 80 K and further to 3 K in the dark (state C).
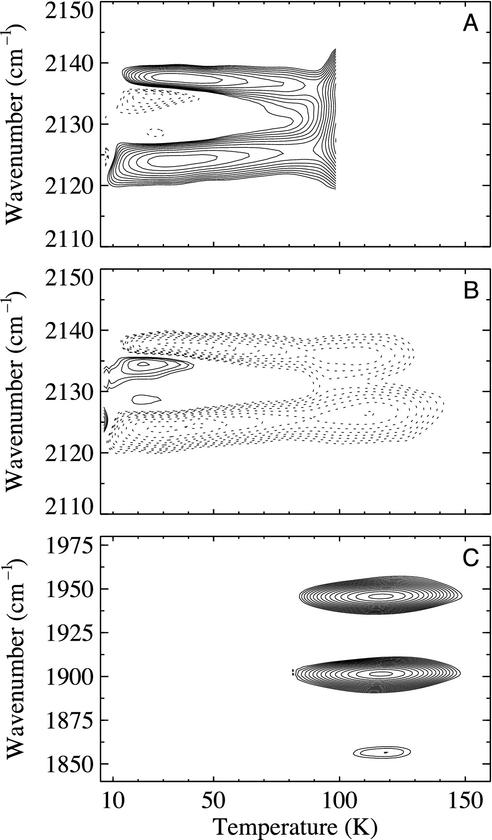
Temperature Dependence of IR bands of CO in Site C. The IR spectra of CO in the Xe 4 cavity exhibit a pronounced temperature dependence, which we have studied using a temperature-ramp protocol called temperature-derivative spectroscopy (16, 18, 19). While slowly cooling the sample at a rate of 5 mK/s under illumination from 100 to 80 K and further to 3 K in the dark, FTIR spectra were collected continuously, one spectrum every kelvin. With this procedure, essentially all CO ligands were transferred to photoproduct state C. From the transmittance spectra, I(ν, T), at successive temperatures, FTIR absorbance difference spectra, ΔA(ν, T), were calculated, yielding the spectral changes occurring within 200 s (and 1 K). The data for the 12C16O isotope are plotted in Fig. 3A as a 2D (contour) map. The solid contours in the differential map indicate that the absorption in the two peaks increases significantly after lowering the temperature; concomitantly, the two main bands shift apart from each other. The weak contours of the opposite sign between the two main bands in Fig. 3A arise from changes of the line widths.
Fig. 3.
Temperature-derivative spectroscopy contour maps of CO stretch bands in Mb mutant L29W-S108L. (A) Photodissociated 12C16O, measured while cooling under illumination from 100 to 80 K and further to 3 K in the dark. (B) Photodissociated 12C16O, measured while warming up from 3 to 160 K. (C) Rebinding of (from top to bottom) 12C16O, 13C16O, and 13C18O from the Xe 4 cavity, observed in the stretch bands of heme-bound CO.
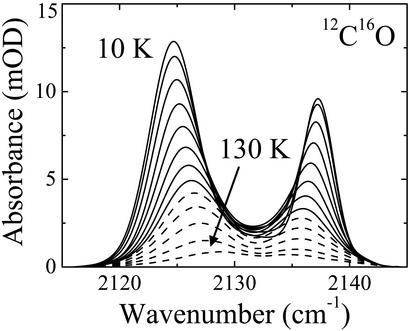
After arrival at 3 K, a temperature ramp from 3 to 160 K was started, during which FTIR spectra were again recorded continuously. Up to ≈80 K, the difference spectra in Fig. 3B display decreasing band areas and converging peak positions. The spectral changes are the exact opposite of what was observed while cooling, which implies that they arise from a process in thermal equilibrium. Significant rebinding from state C occurs only above 80 K for all three isotopes, as seen in the temperature-derivative spectroscopy map in the spectral region of the heme-bound CO (Fig. 3C). The dramatic changes below 80 K are evident from the baseline-corrected integral spectra of CO in the Xe 4 cavity in Fig. 4.
Fig. 4.
IR spectra of 12C16O in the Xe 4 cavity of Mb L29W-S108L from 10 to 130 K in steps of 10 K. Solid lines, 10–80 K (without CO rebinding); dotted lines, 90–130 K.
Analysis of CO Stretch Spectra
Vibrational Stark Effect (VSE). Electrostatic field interactions play a crucial role in the structural organization of complex biological molecules and in protein folding, subunit assembly, and enzymatic activity. Electric fields within a protein are difficult to measure, and only a few experimental determinations exist as of yet (20–22). In spectroscopic experiments, these fields give rise to electrochromic band shifts, also called internal Stark shifts, caused by the interaction of a probe chromophore with the electric field of the surrounding protein (and solvent) matrix. Molecular vibrations are also sensitive to electric fields, and these perturbations can be measured through the VSE. Here we use the CO stretch absorption as a probe to measure the ligand dynamics in the Xe 4 site and the electric field,  , in this cavity. The change of the vibrational frequency ν due to an internal electric field can be expressed as a sum of a linear and a quadratic term in the field strength,
 |
[1] |
where  and
and  are usually denoted as vibrational dipole moment and polarizability changes, respectively (23–25). Both contributions and the angle between
  and the transition dipole moment
  can be determined by line-shape analysis of VSE difference spectra generated by externally applied electric fields. Boxer and coworkers (22, 26) have shown that, for CO dissolved in frozen 2-methyl-tetrahydrofuran and MbCO,
  is within the experimental error parallel to
  , and contributions from
  can be neglected. In the simplest model, we can compute the frequency shift Δν of the CO dipole oriented at an angle θ with respect to the internal field
  in the Xe 4 cavity by
 |
[2] |
where  is called the Stark tuning rate; it originates physically from bond anharmonicity and electronic polarizability (26).
In a survey of photoproducts of many different Mb mutants, we have observed that the CO spectra in the different docking sites of Mb frequently exhibit a doublet character as in Fig. 4 (data not shown), which arises from two possible orientations of CO in the internal electrostatic field  caused by the protein matrix at the position of the CO molecule.
Classical Model of Band Shifts. Because of the weak van-der-Waals binding of CO in the Xe 4 cavity, the CO is expected to perform librational motions within the potential governed by the interactions with the surrounding residues. The appearance of doublets suggests a double-humped potential in which the CO has to surmount an energy barrier to change its orientation with respect to the electric field. With increasing temperature, the average angle  is expected to increase and the two bands will approach each other (as seen in Fig. 4). To develop a simple physical model, we approximate the potential (27) by
 |
[3] |
as depicted in Fig. 1. With Eq. 2, the observed temperature-dependent frequency shift, Δν(T), can be computed as
 |
[4] |
where  denotes the thermal average of cos θ. Classically,
 |
[5] |
The probability density P(θ) of finding the CO oriented at a particular angle θ with respect to the electric field vector is governed by the Boltzmann factor,
 |
[6] |
with normalization factor N(T), universal gas constant R, and absolute temperature T. The function f(θ) accounts for degeneracies arising from the dimensionality D of the problem. In the 1D case, the CO performs torsional oscillations in a plane, and f(θ) = 1. In the 2D case, the CO moves in a cone, as sketched in Fig. 1, and f(θ) = sin θ.
To apply this model to the data in Fig. 4, the peaks were fitted by Gaussians to obtain absolute line positions. The band shift with respect to the position at zero field, Eq. 4, which is not a priori known, was determined as
 |
[7] |
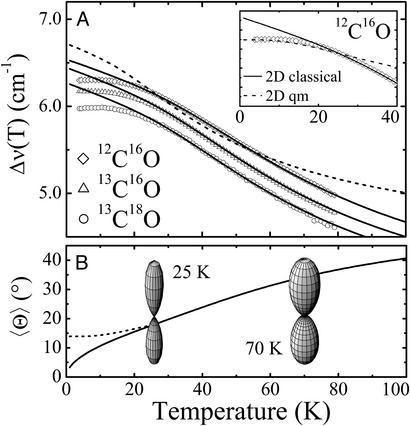
Here, ν+(T) and ν-(T) are the absolute frequencies of the upper and lower band, respectively. This procedure is justified, because the two bands exhibit shifts with temperature by identical amounts in opposite directions within the error of the data. In Fig. 5, the relative peak shifts Δν(T) of the three isotopic CO species scale perfectly with the inverse ratio of the square roots of the reduced molecular masses, as expected for classical oscillators with identical spring constants and VSE theory (28). Therefore, we have modeled the data conveniently using a reduced relative frequency shift, δν(T), defined by
 |
[8] |
with ν0 being the average or zero-field position of the CO band doublet.
Fig. 5.
(A) Temperature dependence of the relative peak shifts, Δν(T), of the IR stretch bands of 12C16O (diamonds), 13C16O (triangles), and 13C18O (circles) in the Xe 4 cavity; fits of the classical 1D (dashed line) and 2D (solid lines) models to the data between 25 and 70 K are shown. (Inset) Quantum-mechanical calculation between 0 and 40 K. (B) Average angle,  , computed from the classical (solid line) and quantum-mechanical (dashed line) 2D model using the global parameters shown in Table 1. Also shown are polar plots of the angular distributions, P(θ), at 25 and 70 K.
In Fig. 5A, solid lines represent fits of the classical 2D model to the data in the temperature range of 25–70 K. Data above 70 K were excluded because of the presence of rebinding, which can (and does) lead to deviations [kinetic hole burning (29)] that are outside the framework of our model. The fit yields excellent agreement between the model and the experimental data except below 20 K, where quantum effects become important (vide infra). The fit with the 1D model (dashed line) clearly fails to describe the temperature dependence correctly, which suggests that the CO indeed moves in a cone. In Fig. 5B, the average angle  is plotted as a function of temperature. The fit parameters, i.e. the relative shifts δν(0), the average band position ν0 and the amplitude V0 of the potential are compiled in Table 1 for the three isotope data sets. Also included are averages and the results of a global fit to all three data sets. Excellent agreement among the three isotopes suggests that the parameters were faithfully determined. Boxer and coworkers (22, 26) performed Stark spectroscopy measurements of 12C16O in 2-methyl-tetrahydrofuran. They reported a band position of 2,131 cm-1, which agrees with our ν0 parameter. Using their value of the Stark tuning rate
  = 0.04 D, we can calculate the internal field in the Xe 4 cavity as
  ≈ 10 MV/cm. Our measured barrier V0 ≈ 2 kJ/mol for CO rotation in site C is somewhat smaller than estimates reported for CO in site B [3.7 kJ/mol at 5.5 K (7) and 6.3 kJ/mol at 283 K (28)], suggesting that the dynamics in the Xe 4 cavity is less restricted than in the primary docking site.
Table 1. Temperature dependence of the CO stretch band positions: 2D model fit parameters.
| δν(0)·104 | ν0, cm-1 | V0, kJ/mol | ω, cm-1 | I·1046, kg·m2 | |
|---|---|---|---|---|---|
| 12C16O | 30.64 | 2,130.9 | 2.07 | 24.7 | 3.2 |
| 13C16O | 30.81 | 2,084.0 | 1.89 | 25.0 | 2.9 |
| 13C18O | 30.84 | 2,031.9 | 1.85 | 28.7 | 2.1 |
| Mean* | 30.72±0.10 | 1.98±0.09 | 24.9±0.4 | 3.0±0.1 | |
| Global* | 30.72 | 1.99 | 24.6 | 3.0 |
Weighted by isotopic fraction
Quantum-Mechanical Model. Below 20 K, huge deviations from the classical model become apparent. The observed flattening of the shift is indicative of quantum-mechanical zero-point vibrations that prohibit the perfect alignment of the CO dipole along the direction corresponding to the potential energy minimum. In the quantum-mechanical analysis, we have limited ourselves to small angles θ, which allows us to (i) project the movement of the CO in a cone onto the xy plane and (ii) approximate our potential, Eq. 3, by the leading term in its power series expansion,
 |
[9] |
as depicted in Fig. 1. Therefore, the CO dynamics can be described by a 2D isotropic harmonic oscillator. Note that the parameter V0 is connected to the moment of inertia I and frequency ω by V0 = (1/2)Iω2. Transformation to polar coordinates (θ, ϕ) yields the eigenfunctions Ψν,l(θ, ϕ) to the (ν + 1)-fold degenerate energy eigenvalues 
 |
[10] |
Here,  is the normalization, and
  denotes associated Laguerre polynomials (30).
The expectation value,  , is calculated as
 |
[11] |
with thermal occupation probabilities
 |
[12] |
Here, gν represents the degeneracy of each quantum level, Z represents the partition function, and kB denotes the Boltzmann constant.
Using the 2D quantum-mechanical harmonic oscillator, we calculated the temperature dependence of Δν(T) below 40 K. The resulting curve, shown as a dashed line in Fig. 5A Inset, describes the saturation very well. Above 25 K, however, there are significant discrepancies from the data and the classical fit, which is expected because of the small-angle approximation and the neglect of higher-order terms in the power-series expansion of the sin2 θ potential. Fig. 5B shows the saturation behavior in terms of the average angle  .
.
A more sophisticated quantum-mechanical analysis was not undertaken, because the relevant parameters can be extracted from the ratio of the band shifts at T = 0 in the quantum-mechanical and classical models, which is identical to  for T → 0 (31).
 |
[13] |
This equation allows us to determine the quantity b and thus the product Iω. With the parameter V0 = (1/2)Iω2 = 1.98 kJ/mol from the classical model, we have calculated I and ω separately (see Table 1). For I, very good agreement with the literature value of 1.45 × 10-46 kg·m2 for 12C16O (32) is obtained if we consider that, in our isotropic 2D model, I = Ix + Iy = 2Ix, i.e. twice the uniaxial value. From this agreement of I with literature data and the onset of quantum effects around 20 K we conclude that ω ≈ 25 cm-1 is reliably determined.
CO Stretch Band Areas. Not only the band shifts but also the areas are governed in their temperature dependence by the CO dynamics in the cavity. In spectroscopy theory, the experimentally determined, area-normalized spectrum, Î(ω), is given by the Fourier transform of the dipole autocorrelation function (27, 33),
 |
[14] |
Hindered rotation in a cavity will lead to a biphasic decay of  . Over short time intervals, correlations will decay similar to those of free CO. The subsequent slower decay arises from the steric restrictions inflicted on the CO by the potential. Only this slow component in
  gives rise to the narrow CO bands seen in Fig. 4, whereas the fast decay leads to broad spectral components that escape detection. These effects are analogous to those encountered in neutron or Mössbauer spectroscopy on proteins, where elastic and quasielastic components appear in the spectra (34).
Considering the energy barrier of ≈2 kJ/mol between the wells, end-to-end rotation of the CO is much slower than the motions in the cavity, and the amplitude of the slowly decaying component of  and the area of the narrow part of the spectrum are both given by (27)
 |
[15] |
Consequently, the areas are expected to scale with the square of the normalized band shifts (Eq. 4). Note that, for T → 0,  in the classical model, whereas quantum-mechanically,
  .
.
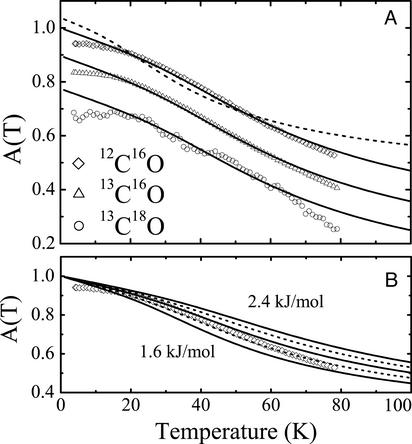
In the data analysis, entire CO spectra were integrated at each temperature. In Fig. 6A, the experimental areas are shown for the three isotopes. They were fitted with Eq. 15 (plus an additional scaling factor) in the temperature range of 25–70 K, with  calculated according to the 2D classical model. The data were scaled such that the fitted curves yield
  . The 2D classical model describes the loss of band area with increasing temperature very well. As with the band shifts, the 1D model (dashed line) again fails to describe the data. In Fig. 6B, we have plotted model calculations in which the parameter V0 was varied from 1.6 to 2.4 kJ/mol. They show how sensitively the model responds to parameter variation.
Fig. 6.
(A) Temperature dependence of the overall area of the CO stretch spectra of photodissociated CO in the Xe 4 cavity. Symbols, experimental data for the three CO isotopes, shifted with respect to each other; solid lines, fits with Eq. 15. The experimental data were scaled such that the fitted curve A → 1 for T → 0. (B) Temperature variation of the 12C16O spectral area with barrier height V0 calculated from 1.6 to 2.4 kJ/mol in steps of 0.2 kJ/mol.
Table 2 contains the parameter V0 as obtained from fits of the 2D classical model to the individual isotope data sets as well as the average.  was calculated from the extrapolation of the saturation level in the experimental data to T = 0. Also included are the frequencies ω and moments of inertia I calculated from
  with Eq. 13, as already explained in connection with the quantum-mechanical analysis of the peak shifts. There is good agreement among the three isotopes. The values scatter somewhat more than in the peak-shift analysis because of the parameter sensitivity shown in Fig. 6B, so that slight, unavoidable baseline errors will affect the results markedly.
Table 2. Temperature dependence of the CO stretch band areas: 2D model fit parameters.
| 〈cos θ〉2T → 0 | V0, kJ/mol | ω, cm-1 | l·1046, kg·m2 | |
|---|---|---|---|---|
| 12C16O | 0.935 | 1.83 | 20.3 | 2.1 |
| 13C16O | 0.930 | 1.77 | 21.4 | 3.6 |
| 13C18O | 0.915 | 1.90 | 28.0 | 2.7 |
| Mean* | 0.93 ± 0.01 | 1.80 ± 0.03 | 20.8 ± 0.6 | 2.8 ± 0.7 |
| Global* | 0.925 | 1.80 | 23.5 | 3.0 |
Weighted by isotopic fraction
Conclusions
We have analyzed the temperature dependencies of two experimentally independent observables, peak shifts and band areas of the stretch bands of CO in the Xe 4 cavity using a simple physical model in which the two quantities depend on  and
and  , respectively. The consistency of the parameters obtained from the two observables suggests that the model describes the physical situation very well. The analysis yields values of the barrier against CO rotation, the oscillation frequency within one orientation, and the moment of inertia of CO. The latter parameter agrees with the literature value. Here we add a few remarks about features that were introduced to keep the model simple. We have assumed that the local field in the Xe 4 cavity is parallel to the symmetry axis of the 2D torsional oscillator (see Fig. 1). Of course, there likely will be a tilt angle β between the electric field and the symmetry axis. The shifts of the CO band positions (first moments) then will depend on the projection of the electric field onto the symmetry axis, with magnitude
  cos β, and not on the electric field itself. In principle, the tilt angle β can be obtained from a careful analysis of the temperature dependence of the line broadening (second moments).
Moreover, we have used a symmetric potential, which is only an approximation, as also suggested by the slightly different areas and widths of the two CO stretch bands at low temperatures (Fig. 4). Already from simple electrostatics it is clear that one direction will be energetically favored. With  MV/cm and
  D for free CO in frozen 2-methyl-tetrahydrofuran (26) we estimate Epot = 150 J/mol, which is 7.5% of the energy barrier that restricts CO rotation. Therefore, the electrostatic contribution is not entirely insignificant.
Finally, we have modelled the protein using a static potential, and thus we have neglected the interactions of the CO torsional oscillator with low-frequency vibrations of the protein. A more elaborate analysis could be provided on the basis of a normal mode calculation. Although our simple model does not contain these additional complications, we are confident that its ability to provide consistent and reasonable parameters justifies its application.
Acknowledgments
We thank Prof. W. Hüttner (University of Ulm) for helpful discussions. This work was supported by the Deutsche Forschungsgemeinschaft (Sonderforschungsbereich 569, Graduiertenkolleg 328, and Ni-291/3).
Abbreviations: MbCO, carboxymyoglobin; FTIR, Fourier transform IR; VSE, vibrational Stark effect.
References
- 1.Frauenfelder, H., Deisenhofer, J. & Wolynes, P. (1999) Simplicity and Complexity in Proteins and Nucleic Acids (Dahlem Univ. Press, Berlin).
- 2.Nienhaus, G. U., Müller, J. D., McMahon, B. H. & Frauenfelder, H. (1997) Physica D 107, 297-311. [Google Scholar]
- 3.Austin, R. H., Beeson, K. W., Eisenstein, L., Frauenfelder, H. & Gunsalus, I. C. (1975) Biochemistry 14, 5355-5373. [DOI] [PubMed] [Google Scholar]
- 4.Schlichting, I., Berendzen, J., Phillips, G. N., Jr., & Sweet, R. M. (1994) Nature 371, 808-812. [DOI] [PubMed] [Google Scholar]
- 5.Teng, T., Šrajer, V. & Moffat, K. (1994) Nat. Struct. Biol. 1, 701-705. [DOI] [PubMed] [Google Scholar]
- 6.Hartmann, H., Zinser, S., Komninos, P., Schneider, R. T., Nienhaus, G. U. & Parak, F. (1996) Proc. Natl. Acad. Sci. USA 93, 7013-7016. [DOI] [PMC free article] [PubMed] [Google Scholar]
- 7.Alben, J. O., Beece, D., Bowne, S. F., Doster, W., Eisenstein, L., Frauenfelder, H., Good, D., McDonald, J. D., Marden, M. C., Moh, P. P., et al. (1982) Proc. Natl. Acad. Sci. USA 79, 3744-3748. [DOI] [PMC free article] [PubMed] [Google Scholar]
- 8.Lim, M., Jackson, T. A. & Anfinrud, P. A. (1997) Nat. Struct. Biol. 4, 209-214. [DOI] [PubMed] [Google Scholar]
- 9.Šrajer, V., Ren, Z., Teng, T. Y., Schmidt, M., Ursby, T., Bourgeois, D., Pradervand, C., Schildkamp, W., Wulff, M. & Moffat, K. (2001) Biochemistry 40, 13802-13815. [DOI] [PubMed] [Google Scholar]
- 10.Ostermann, A., Waschipky, R., Parak, F. G. & Nienhaus, G. U. (2000) Nature 404, 205-208. [DOI] [PubMed] [Google Scholar]
- 11.Chu, K., Vojtchovsky, J., McMahon, B. H., Sweet, R. M., Berendzen, J. & Schlichting, I. (2000) Nature 403, 921-923. [DOI] [PubMed] [Google Scholar]
- 12.Brunori, M., Vallone, B., Cutruzzola, F., Travaglini-Allocatelli, C., Berendzen, J., Chu, K., Sweet, R. M. & Schlichting, I. (2000) Proc. Natl. Acad. Sci. USA 97, 2058-2063. [DOI] [PMC free article] [PubMed] [Google Scholar]
- 13.Tilton, R. F., Jr., Kuntz, I. D., Jr., & Petsko, G. A. (1984) Biochemistry 23, 2849-2857. [DOI] [PubMed] [Google Scholar]
- 14.Lamb, D. C., Nienhaus, K., Arcovito, A., Draghi, F., Miele, A. E., Brunori, M. & Nienhaus, G. U. (2002) J. Biol. Chem. 277, 11636-11644. [DOI] [PubMed] [Google Scholar]
- 15.Nienhaus, K., Lamb, D. C., Deng, P. & Nienhaus, G. U. (2002) Biophys. J. 82, 1059-1067. [DOI] [PMC free article] [PubMed] [Google Scholar]
- 16.Nienhaus, G. U., Mourant, J. R., Chu, K. & Frauenfelder, H. (1994) Biochemistry 33, 13413-13430. [DOI] [PubMed] [Google Scholar]
- 17.Springer, B. A., Egeberg, K. D., Sligar, S. G., Rohlfs, R. J., Mathews, A. J. & Olson, J. S. (1989) J. Biol. Chem. 264, 3057-3060. [PubMed] [Google Scholar]
- 18.Berendzen, J. & Braunstein, D. (1990) Proc. Natl. Acad. Sci. USA 87, 1-5. [DOI] [PMC free article] [PubMed] [Google Scholar]
- 19.Mourant, J. R., Braunstein, D. P., Chu, K., Frauenfelder, H., Nienhaus, G. U., Ormos, P. & Young, R. D. (1993) Biophys. J. 65, 1496-1507. [DOI] [PMC free article] [PubMed] [Google Scholar]
- 20.Steffen, M. A., Lao, K. & Boxer, S. G. (1994) Science 264, 810-815. [DOI] [PubMed] [Google Scholar]
- 21.Phillips, G. N., Jr., Teodoro, M. L., Li, T., Smith, B. & Olson, J. S. (1999) J. Phys. Chem. B 193, 8817-8829. [Google Scholar]
- 22.Park, E. S., Andrews, S. S., Hu, R. B. & Boxer, S. G. (1999) J. Phys. Chem. B 103, 9813-9817. [Google Scholar]
- 23.Hush, N. S. & Williams, M. I. (1974) J. Mol. Spectrosc. 50, 349-368. [Google Scholar]
- 24.Hush, N. S. & Reimers, J. R. (1995) J. Phys. Chem. 99, 15798-15805. [Google Scholar]
- 25.Reimers, J. R. & Hush, N. S. (1999) J. Phys. Chem. A 103, 10580-10587. [Google Scholar]
- 26.Park, E. S. & Boxer, S. G. (2002) J. Phys. Chem. B 106, 5800-5806. [Google Scholar]
- 27.Lim, M., Jackson, T. A. & Anfinrud, P. A. (1995) J. Chem. Phys. 102, 4355-4366. [Google Scholar]
- 28.Lambert, D. K. (1988) J. Chem. Phys. 89, 3847-3860. [Google Scholar]
- 29.Ormos, P., Szaraz, S., Cupane, A. & Nienhaus, G. U. (1998) Proc. Natl. Acad. Sci. USA 95, 6762-6767. [DOI] [PMC free article] [PubMed] [Google Scholar]
- 30.Nielsen, H. H. (1959) in Encyclopedia of Physics, ed. Flügge, S. (Springer, Berlin), Vol. XXXVII/1, pp. 173-313. [Google Scholar]
- 31.Prudnikov, A. P., Brychkov, Y. A. & Marichev, O. I. (1988) Integrals and Series (Gordon and Breach Science, New York), Vol. 2.
- 32.Hüttner, W., ed. (1992) Landolt-Börnstein, Numerical Data and Functional Relationships in Science and Technology (Springer, Berlin), Vol. 19.
- 33.Gordon, R. G. (1965) J. Chem. Phys. 43, 1307-1312. [Google Scholar]
- 34.Parak, F. & Nienhaus, G. U. (2002) Chemphyschem 3, 249-254. [DOI] [PubMed] [Google Scholar]


