


Abstract
A RNA aptamer (R06) raised against the trans- activation responsive (TAR) element of HIV-1 was previously shown to generate a loop–loop complex whose stability is strongly dependent on the selected G and A residues closing the aptamer loop. The rationally designed TAR* RNA hairpin with a loop sequence fully complementary to the TAR element, closed by U,A residues, also engages in a loop–loop association with TAR, but with a lower stability compared with the TAR–R06 complex. UV absorption monitored thermal denaturation showed that TAR–TAR*(GA), in which the U,A kissing residues were exchanged for G,A, is as stable as the selected TAR–R06 complex. Consequently, we used the TAR–TAR* structure deduced from NMR studies to model the TAR–R06 complex with either GA, CA or UA loop closing residues. The results of the molecular dynamics trajectories correlate well with the thermal denaturation experiments and show that the increased stability of the GA variant results from an optimized stacking of the bases at the stem–loop junction and from stable interbackbone hydrogen bonds.
INTRODUCTION
Loop–loop interactions between RNA hairpins participate in the regulation of a variety of cellular processes, including gene expression (1). In Escherichia coli, replication of the ColE1 plasmid is regulated by the interaction of two RNA transcripts, RNA I and RNA II, that fold as hairpins (2,3). The interaction starts with base pairing between the complementary loops of these RNAs and leads to the formation of a double-stranded RNA along the entire length of RNA I that disrupts RNA II hybridization with the template DNA required for replication (4). In 1995, Marino et al. published the structure of the RNA Ii–RNA IIi duplex derived from the RNA I–RNA II complex by inverting the loop orientation (5,6). The structure revealed three A-type helices that stack from the RNA Ii stem helix to the RNA IIi one through the loop–loop helix. All seven residues of the loops are involved in base pairing. This implies structural torsion at the two stem–loop junctions to cross the major groove of the loop–loop helix.
Several other structures of the kissing complex were solved by NMR spectroscopy or crystallography. The first crystallographic structure of a kissing complex was the anticodon–anticodon interaction seen in tRNAAsp (7). Another example is found in the RNA of the 50S ribosomal subunit between residues 412–428 and 2438–2454 (8). Both loops are made of 7 nt, but only six are engaged in base pairing. The unpaired residue provides the link between the loop and the stem to cross the major groove of the loop–loop helix. In 2000, the solution structure of the H3 hairpin dimer from the moloney murine leukemia virus genome was published (9). These 5′-GACG-3′ tetraloops interact through two GC base pairs only. The complex is further stabilized by stacking interactions of the unpaired G and A residues. More recently, the dimerization initiating site (DIS) structure of the HIV-1 genome was solved by crystallography (10) and offers an example of the largest loop–loop interaction of a known structure. The DIS loop contains 9 nt, six of which define an autocomplementary sequence flanked by three conserved purine residues. This structure differs slightly from the NMR one (11) published in 1998 in which the kissing complex is kinked and the unpaired purine residues bulged in.
In 1994, Chang and Tinoco (12,13) published the solution structure of the TAR16–TAR*16 kissing complex. The trans-activation responsive (TAR) element of HIV-1 is a 59 nt hairpin located at the 5′ untranslated end of all retroviral mRNAs. This RNA, which plays a crucial role during the life cycle of the virus, trans-activates the transcription of its genome (14). A truncated version of TAR, TAR16, was used in the NMR studies and GC base pairs were added in the stem to stabilize the stem–loop structure. TAR*16 is a RNA hairpin, showing a 4 bp stem with a 5′-UCCCAG-3′ loop sequence fully complementary to the TAR one, rationally designed by the investigators for the sake of structural studies. It turned out that this loop connected to a different stem is found within the gag gene of HIV-1 (nucleotides 1096–1109). No information is available regarding the role of this hairpin and its potential interaction with TAR. The TAR*16 stem was rationally designed to exhibit a high stability for NMR spectroscopy experiments. Although the loop–loop helix is one pair shorter than that of the RNA Ii–RNA IIi kissing complex, TAR16–TAR*16 adopts an overall three-dimensional conformation close to the RNA Ii–RNA IIi one. In addition, both complexes are recognized by the ROP protein of Escherichia coli that specifically interacts with loop–loop RNA helices (15,16).
All these published structures are made of two interacting RNA hairpins. In 2000, the first structural analysis of a DNA–RNA heterodimer kissing complex formed between the TAR RNA and a DNA aptamer (17) was published (18). The structure, still not entirely solved, shares with the RNA–RNA kissing complexes some common features, such as the quasi-continuous stacking from one stem to the other through the loop–loop helix. More recently Barbault et al. published the DNA DIS–DIS kissing complex structure (19), which differs from its RNA counterpart. Only 4 bp are involved in the loop–loop interaction; moreover, the loop–loop helix and the stem helices are not coaxial.
In an attempt to artificially control the gene expression of HIV-1, RNA aptamers specific for the TAR element of HIV-1 were identified by in vitro selection (SELEX) (20). The high affinity aptamers isolated at the end of the selection process were shown to fold as imperfect hairpins and form kissing complexes with the targeted RNA. The apical loop of all these aptamers corresponds to the 5′-GUCCAGA-3′ consensus sequence, the six central bases of which are complementary to the entire TAR loop, whereas two G and A residues close the loop. The role of these conserved G and A residues was investigated at physiological magnesium concentration by systematic permutation (21). It was shown for R0624, the aptamer of highest affinity, that the nature of the residues closing the loop of the aptamer was crucial for kissing complex stability at low magnesium concentrations: the selected GA combination leads to the most stable complex while the CA one, for instance, drastically decreases the stability of the kissing complex formed between TAR and the aptamer.
TAR has already been studied by molecular dynamics (MD), but only for its interaction with the Tat protein. The behavior of HIV-1 TAR complexed with an argininamide residue that mimicks Tat protein binding to the viral RNA was investigated (22). MD simulations of the BIV Tat–TAR complex were also run to understand the role of a key U-A-U base triple at the TAR–Tat interface (23). More recently two mutants of the HIV-1 DIS kissing loop structures have been investigated by MD (24). This is the first example of MD study of a kissing complex. The authors tried to gain a deep insight of the whole kissing complex formation and dimerization process.
In the work presented herein, MD was used to rationalize the stabilizing role of the residues closing the aptamer loop. The TAR16–TAR*16 solution structure was used as the starting structure to model the TAR–R0624 kissing complex. The model was first validated by thermal denaturation experiments. Then, MD simulations were run under conditions where the kissing complex was alternatively highly stable or unstable by using TAR*16 variants mutated in the loop closing residues. The results show that the increased stability of the selected TAR–aptamer complex over the TAR16–TAR*16 one is due to an optimized stacking and hydrogen bonding of the residues at the stem–loop junctions of the interacting hairpins.
MATERIALS AND METHODS
Oligonucleotides preparation
All RNA molecules were synthesized on an Expedite 8908 synthesizer and purified by electrophoresis on denaturing polyacrylamide gels. The pure samples were desalted on Sephadex G-10 spin columns. To avoid repeated thawing and freezing of the stock solutions, the samples were aliquoted at a volume and a concentration suitable for each experiment and stored at 20°C. Prior to the experiments, each RNA sample was heated at 95°C for 1 min and then put on ice for 10 min to avoid the formation of intermolecular complexes.
Thermal denaturation of RNA complexes
RNA complexes were prepared in 20 mM sodium cacodylate buffer, pH 7.3 at 20°C, containing 140 mM potassium chloride, 20 mM sodium chloride and 0.3 mM magnesium chloride (R′ buffer). Thermal denaturation was monitored in a Cary 1 spectrophotometer interfaced with a Peltier effect device that controls temperature within ±0.1°C. RNA samples were prepared at 1 µM final concentration in the mixture. They were mixed at room temperature and allowed to interact for 20 min before cooling down to 4°C. The experiment then started after 20 min at this temperature. Denaturation of the samples was achieved by increasing the temperature at 0.4°C/min from 4 to 90°C and was followed at 260 nm. A cuvette containing R′ buffer was used as the reference.
Computational procedure
Simulations were carried out using the CHARMM program (25) with periodic boundary conditions. The CHARMM27 parameters for RNA (26) were used along with the CHARMM-modified TIP3P water model (27) and the sodium parameters from Beglov and Roux (28).
The starting coordinates were extracted from the NMR structure of the TAR16–TAR*16 kissing complex (13) (PDB code 1KIS). The RNA complex was surrounded by 30 Na+ counterions in order to neutralize the system and by 4503 TIP3P water molecules filling a 75 × 45 × 45 Å3 orthorhombic box. The counterions and the water were placed randomly according to a pre-equilibrated box (http://www.psc.edu/general/software/packages-/charmm/tutorial/dna.html). Molecules distant by less than 1.6 Å from the RNA were removed. To treat the long-range electrostatic interactions, the particle mesh Ewald method (PME) was used (29). The charge grid spacing was chosen to be close to 1 Å. A 10 Å atom-based switch truncation method was applied to the Lennard Jones interactions. Simulations were carried out at constant volume and temperature using a 2 fs time step. The non-bonded list was updated every 10 steps and the SHAKE algorithm was used to constrain the X-H bonds (30).
The equilibration protocol started with the RNA structure fixed by 500 steps of steepest descent and 500 steps of adopted basis Newton–Raphson minimization followed by a 60 ps dynamic at 300 K to allow the water molecules to relax. Then, another set of minimizations was applied without constraints on the solute and five 60 ps dynamics were run with positional constraints on the RNA ranging from 1 to 10–5 kCal/mol/Å2. Finally, no positional constraints were applied to the system and the MD was resumed for a total simulation time of 3 ns. The calculation lasted ∼3 weeks of CPU time on a quadriprocessor SGI R12000 Origin200 server.
The InsightII program (Accelrys Inc.) was used to generate the two TAR*16 mutants, TAR*16(GA) and TAR*16(CA). Residue U*5 was replaced by a guanine or a cytosine, respectively (Fig. 1b). A short minimization was applied on these RNA variant hairpins with all nucleotides fixed except nucleotides closing the aptamer loop. Finally, MD of the complexes formed between TAR and these mutants were run under the conditions defined for TAR16–TAR*16.
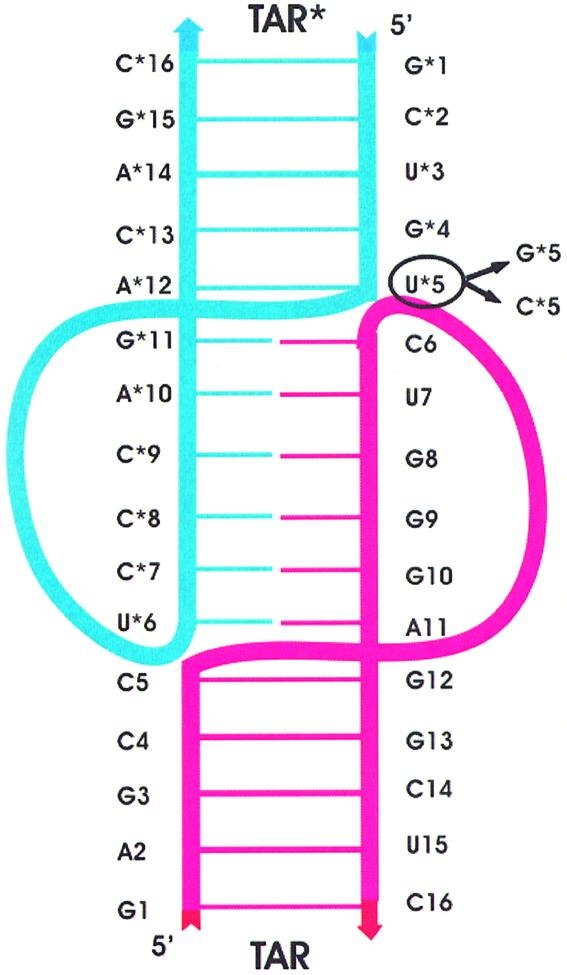
Figure 1.

Secondary structure and sequence of RNAs. The sequences of miniTAR RNA and R0624 are presented at the top (a). The sequences of the TAR and the TAR* mutants used in this work are given below (b). The mutated residues are underlined and the loop complementary sequence of each RNA is in red.
All structure analyses were performed within the Correl module of CHARMM27 (25) and the X3DNA program (31). Static structures and trajectory dynamics were visualized using InsightII (Accelrys Inc.).
RESULTS
Thermal denaturation analysis of RNA complexes
In a previous work (20), R0624, the best aptamer arising from selection against the HIV-1 TAR RNA was proved to fold as a hairpin and to form a kissing complex with the target (Fig. 1a). Surprisingly, the six central bases of the loop complementary to the TAR apical loop sequence were systematically flanked by two selected G and A residues. It was then proved that these G and A residues closing the loop are a key structural determinant that drives the stability of the TAR–aptamer complex (21). It was also demonstrated that these residues explained the increased stability of the complex formed with the aptamer over that formed with the TAR*16 ligand at physiological magnesium concentration.
To ascertain whether TAR16–TAR*16 can be used as the starting structure to model the TAR–R0624 RNA aptamer kissing complex and to analyze the crucial role of the GA residues, an aptamer-like ligand of TAR was derived from TAR*16 by replacing the TAR*16 uracil 5 residue by a guanine (Fig. 1). Three other combinations of the residues closing the loop, GC, CU and CA, that were shown to decrease the stability of the TAR–aptamer complex (21) were also introduced in TAR*16. These TAR*16 variants were then evaluated for binding to TAR16, by thermal denaturation experiments. The melting temperatures (Tm) of the bimolecular complexes formed between the TAR*16 variants and TAR16 are presented in Table 1.
Table 1. Melting temperature (Tm) of RNA kissing complexes.
| Loop closing residues of TAR*16 or R0624 ligands | Tm (°C) TAR16–TAR*16 complex | miniTAR–R0624 complex |
|---|---|---|
| UA | 18.4 ± 0.4 | 29.9 ± 0.6 |
| AU | 17.6 ± 1.5 | |
| GC | 17.3 ± 0.6 | 31.4 ± 0.6 |
| CG | 11.7 ± 1.1 | |
| CU | Not detected | 16.8 ± 1.1 |
| UC | Not detected | |
| CA | Not detected | 21.0 ± 0.0 |
| AC | 11.4 ± 0.5 | |
| GA | 32.5 ± 0.8 | 47.3 ± 0.3 |
| AG | 26.0 ± 0.7 | 42.8 ± 0.4 |
All experiments were performed at a concentration of 1 µM each RNA. The experiments with TAR16–TAR*16 were performed at 0.3 mM Mg2+. As an indication, melting temperatures of miniTAR–R0624 kissing complexes at 1 mM Mg2+ extracted from the work of Ducongé et al. (21) are given in the right column. Melting temperatures are the average and standard deviation of two or three experiments.
When uracil 5 of TAR*16 is replaced by a guanine residue, generating a GA instead of the parental UA combination, the Tm of the TAR16–TAR*16 complex increases from 18.4 to 32.5°C. This increased stability almost matches that observed between miniTAR–R0624(UA) and miniTAR–R0624(GA) aptamer complexes (Table 1). Interestingly the UA→AU inversion of the TAR*16 loop closing residues has no significant effect on the stability of the TAR16–TAR*16 complex. The other inversions of closing residues minimally affect the stability of the TAR–aptamer complex (Table 1). A canonical GC closing pair increases the intrinsic stability of the TAR*16 stem (data not shown) but does not increase the stability of TAR16–TAR*16, in perfect agreement with the results obtained with miniTAR and R0624. CA and CU introduced as closing residues destabilize the TAR16–TAR*16 complex to such a degree that the Tm could not be determined, again in agreement with the destabilizing effect previously reported for the miniTAR–aptamer complex (21). These results indicate that rather than the presence of a purine or a pyrimidine residue at position 5 of TAR*, the combination of the loop closing residues is the key factor for the stability of the kissing complex.
Finally, to demonstrate that the loop complementarity between TAR16 and TAR*16 plays a key role, as shown for the TAR–aptamer complex (21), TAR*16 was evaluated for binding to TARmal, a variant that differs by a U7→C7 mutation in the TAR loop. No complex formation could be observed with any of the TAR*16 variants (data not shown). If the complementarity between the loops were restored by a compensatory mutation on the TAR*16 side (A10→G10), a bimolecular complex was detected in the presence of TARmal (data not shown).
The thermal denaturation experiments clearly demonstrate that the TAR16–TAR*16 and TAR–R06 complexes behave similarly. In particular, the residues closing the loop play an equivalent role in the complex, driving the stability of the interaction. Consequently, TAR16–TAR*16 can be used as a starting structure to model the TAR–aptamer kissing complex and to study the structural role of the G and A closing residues.
The TAR16–TAR*16 molecular dynamics study
The simulated structure is more regular than the solution structure. The average root mean square positional deviation (RMSD) of all non-hydrogen atoms of the RNA structure after simulation against the starting structure is found to be ∼2.7 Å. The first major difference observed between the starting structure and that after simulation is the angle between the two stem helix main axes which rapidly decreases during the MD run (Fig. 2). The initial structure derived from the NMR spectroscopic study bends towards the major groove of the loop–loop helix with an angle of ∼30°. This curvature can be observed in every kissing complex structure derived from NMR spectroscopy experiments (6,9,11,12). During the simulation run the curvature disappeared and was replaced during the first nanosecond of simulation by an almost straight coaxial structure, as observed in the crystal structure of the 23S RNA kissing complex (8) and in the DIS–DIS one (10). The distance between the barycenter of each phosphate atom cluster (a 7 Å equilateral triangle formed between phosphates 5–7 on each strand) is then reduced, decreasing from 12 Å in the initial structure to 11 Å in the simulated one.
Figure 2.

Stereo views of TAR16–TAR*16. Starting from top left, structures at times 0, 360, 800 and 3000 ps. TAR is represented in blue and TAR* in red. After 800 ps, the structure is almost linear and remains linear until the end of the run.
As observed in some oligonucleotide structures determined by NMR spectroscopy, the starting structure of TAR16–TAR*16 base pairs adopts a conformation far from canonical ones. Nucleotides have dihedral angles far from the value expected in the classical A-form and base pairs present abnormal values of intrinsic parameters (shear, buckle, stretch, propeller twist, stagger and opening). For instance, only 30 out of the possible 43 hydrogen bonds between the 16 Watson–Crick base pairs (11 GC and 5 AU) were present in the published structure (13). However, after a few picoseconds of MD the dihedral angles were close to values expected for the RNA A-form and all 43 expected hydrogen bonds were present. Hence, compared to the starting structure, the simulated one offers a more regular and canonical one.
A new undescribed interbackbone hydrogen bond. A secondary structure of the TAR16–TAR*16 duplex is presented in Figure 3. Compared to other kissing complexes (DIS–DIS, 23S and H3–H3, see Introduction), for which at least one unpaired residue provides the link between the stem and the loop–loop helix, all residues from either the TAR or TAR* loops are paired. This implies severe structural constraints at the stem–loop junctions to cross the major groove of the loop–loop helix. In TAR*16 these constraints are initially sustained by the α*6, β*6 and ζ*5 dihedral angles (see Table 2). These angles change during the simulations and new values of α and β angles allow the reorientation of atom O1P from the phosphate moiety of residue U*5 towards the sugar group of residue C6. This change, coupled with the closer distance seen between the phosphate clusters, results in the formation of a hydrogen bond between atoms U*5(H2′) and C6(O1P) that was not described in the published structure (12). This hydrogen bond, which appeared at the end of the equilibration step, is stable over the entire simulation. On the TAR16 side, the configuration of the torsion did not change significantly up to 2.5 ns, preventing the formation of a hydrogen bond between C5(H2′) and U*6(O1P). After 2.5 ns, a new dihedral conformation appeared: this time the torsion is mostly supported by α6 (45°), β6 (140°) and ζ5 (70°) angles, but without any new hydrogen bond.
Figure 3.
Secondary structure of TAR16–TAR*16 duplex. TAR16 is in blue and TAR*16 in red. Base pairs are represented as positioned in space. Arrows indicate the 5′→3′ strand orientation. The box indicates the mutated residues.
Table 2. Averages of dihedral angles between residues 5 and 6 of both strands.
| TAR* 1 | 2 | TAR 1 | 2 | Canonical A-form | |
|---|---|---|---|---|---|
| α6 | 20 | –130 | –40 | 45 | –73.9 |
| β6 | –165 | –130 | –170 | 140 | 191.1 |
| γ6 | 60 | 60 | 70 | 70 | 46.5 |
| δ5 | 80 | 80 | 75 | 75 | 80.9 |
| ε5 | 160 | –170 | –170 | –170 | –173.7 |
| ζ5 | 175 | –130 | 150 | 70 | –59.2 |
Columns 1 represent averages over the first 200 ps, columns 2 between 2.5 and 3 ns. α, O3′ (i – 1)-P-O5′-C5′; β, P-O5′-C5′-C4′; γ, O5′-C5′-C4′-C3′; δ, C5′-C4′-C3′-O3′; ε, C4′-C3′-O3′-P (i + 1); ζ, C4′-O3′-P (i + 1)-O5′ (i + 1).
U*6/A11 and U*5/A*12 open during the simulation. The average RMSD values of each base pair of the TAR16–TAR*16 kissing complex measured against a canonical GC or AU pair, respectively, over the last nanosecond of simulation are presented in Figure 4. Only two base pairs adopt new conformations, different from their initial Watson–Crick conformation. The U*6/A11 pair experienced two short opening events at times 1.5 and 2.4 ns during 100 ps. The U*5/A*12 pair also opens at time 2.5 ns and adopts a conformation with a bridged water molecule between the two residues. Base pair opening is not supposed to occur during MD on a nanosecond timescale (32–34). However, when the solution structure of the TAR16–TAR*16 kissing complex was solved by NMR spectroscopy (13), distance constraints between U*6/A11 and U*5/A*12 base pairs residues were explicitly added by the authors, strongly indicating that these pairs are opened or not stable and consequently could open during the simulation. As mentioned above, residues 5 and 6 of each strand support all the constraints to connect the different helices. These residues are involved in AU and GC base pairs on each side of the stem–loop junction. The G*11/C6 and G12/C5 pairs remained in a Watson–Crick conformation as indicated by the RMSD (Fig. 4), while the A*12/U*5 and U*6/A11 pairs deviate from canonical distances. Structural freedom to absorb the torsion is then provided by UA pairs, thermodynamically less stable than GC ones.
Figure 4.

Average RMSD of each base pair versus an ideal AU or GC with error bars. On the x-axis, the names of the different base pairs are ordered according to their relative position in space, starting from the TAR helix on the left to the loop–loop helix and finally the TAR* helix on the right. RMSD for the mutated GA and CA TAR*12–TAR*5 were calculated against the mean conformation over the last nanosecond of simulation.
The TAR*16 U*5/A*12 closing pair opening at time 2500 ps is correlated with a high interglycosidic distance between the two C1′ atoms of both sugars of the base pair. Indeed, during the last 500 ps, A*12(C1′)/U*5(C1′) shows a surprisingly large distance of ∼14 Å. All other C1′–C1′ distances remained between 10.5 and 10.9 Å, as expected for canonical base pairs. This opening is also correlated with the reorganization of the dihedral angles of the stem–loop junction on the TAR side. Figure 5 shows the superimposition of 20 structures of the last 500 ps of dynamics for the A*12/U*5 base pair with its first hydration shell. The same water molecule bridges atoms U*5(O4) and A*12(N7) over the 500 ps. A hydrogen bond between U*5(N3) and A*12(N6) is also observed. This conformation agrees well with the one-dimensional imino spectrum (12) that showed no U*5 imino proton peak. This absence can be interpreted as an exposure to the solvent of the imino proton, as suggested in our structure (Fig. 5).
Figure 5.

A*12/U*5 superposition of 20 structures over the last 500 ps. For clarity hydrogens are not shown. Red crosses represent oxygens from the first hydration shell. The oxygen cluster indicated by an arrow represents the stable water molecule that bridges the two residues during the last 500 ps.
This largest A*12(C1′)/U*5(C1′) distance also allows a continuous stacking of residues U*5 and C6 which was interrupted in the previously published structure (12), where only residues C6 and G*11 can stack due to the very high twist between A*12/U*5 and G*11/C6. The distance A*12(C1′)–U*5(C1′) being larger, A*12/U*5 adopts a different position in space allowing a continuous stacking over the junction between the TAR*16 stem and the loop–loop helix (Fig. 6). This results in a 2.7 kcal/mol1 gain for the stacking energy between the initial and the final structure (Table 3). On the other hand, the opening of the A*12/U*5 pair breaks the stacking between residues A*12 and its neighbors, C*13 and G*11. On the TAR strand, in contrast, the distance C5(C1′)–G12(C1′) remained unchanged, the base pair kept its canonical conformation and no significant larger stacking between residues C5 and U*6 (Fig. 6 and Table 3) was observed.
Figure 6.

Stereo views of residues adjacent to the loop closing residues of the TAR16–TAR*16 complex. The structure was averaged during the last 500 ps of the molecular dynamics run. (A) Base pairs adjacent to the A*12/U*5 pair of TAR*16. (B) Base pairs adjacent to the C5/G12 pair of TAR16.
Table 3. Intermolecular stacking energy at the junctions.
| CA final | UA final | GA final | UA initial | ||
|---|---|---|---|---|---|
| TAR6 | Electrostatic | 5.3 ± 2.9 | 2.9 ± 0.6 | –5.6 ± 3.4 | 4.1 ± 0.8 |
| Van der Waals | –5.1 ± 1.0 | –5.9 ± 1.1 | –6.4 ± 1.1 | –4.4 ± 0.6 | |
| Total | 0.2 ± 2.8 | –3.0 ± 1.3 | –12.0 ± 3.4 | –0.3 ± 0.9 | |
| TAR*6 | Electrostatic | –0.5 ± 0.9 | –0.5 ± 0.7 | –0.6 ± 0.8 | –2.1 ± 1.3 |
| Van der Waals | –5.0 ± 1.0 | –5.5 ± 1.1 | –4.3 ± 1.2 | –3.8 ± 0.8 | |
| Total | –5.5 ± 1.2 | –6.0 ± 1.3 | –4.8 ± 1.3 | –5.9 ± 1.1 |
Average Van der Waals and electrostatic energies (kcal/mol) of dynamics for the three mutants over the third nanosecond (final) or during equilibration (initial). These energies were calculated between the aromatic atoms of residues TAR6 (respectively, TAR*6) and of TAR*5\TAR*12 (respectively, TAR5\TAR12). For the three variants, stacking energy at the junction between U*6 and C5/G12 did not change significantly. In contrast, for the other junctions, stacking energies are representative of the stability observed by thermal denaturation experiments.
It should be noted that, as for crystal structures, which can be distorted by crystal artifacts, structures from NMR spectroscopy may not provide unambiguous data. As all dynamic trajectories depend on the starting structure, there is always a doubt about the conformation obtained during the run. So, in order to limit this sampling artifact, three other MD runs (1.2, 1.5 and 3 ns) were also performed with slightly different protocols. The three other MD simulations were performed starting from the same box and the same structure but for the first 3 ns one the integration time step used was 1.5 fs instead of 2 fs. For the remaining two, one was performed according to the procedure described in Materials and Methods but with a different value for the NTRFRQ parameter within the CHARMM package. NTRFRQ is the step frequency for stopping the rotation and translation of the molecule. Values of 20000 and 200 were tried instead of 2000 in all other dynamics, without any noticeable effects. All of them confirm the weakness of the A*12/U*5 and A11/U*6 base pairs. Moreover, they all exhibit a continuous stacking on the TAR*16 side and a particularly large A*12/U*5 C1′–C1′ distance. We particularly focused on this large interglycosidic distance and on the stabilizing effect of purine–purine combinations for kissing complexes. In all known GA base pair conformations (35) only the cis Watson–Crick/Watson–Crick one can maintain a C1′–C1′ interglycosidic distance >12 Å. This was taken into account to generate the starting structure of the TAR*16(GA) mutant. U*5 was mutated into a guanine and the generated GA base pair was positioned in the cis Watson–Crick/Watson–Crick conformation. After the minimization step that reduces the severe steric hindrance, the interglycosidic distance increased from 10.8 to 12.3 Å (Fig. 7). We also decided to simulate the CA variant, because it was known to be one of the worst aptamers for TAR and only one residue modification is needed. So, simply by changing the U5* residue to G or C it was possible to mimic three different kinds of kissing complex with stabilities ranging from ‘very stable’ to ‘unstable’. To generate the CA variant, the mutated base pair was set in a N6-N3 N6-carbonyl conformation (36), as shown in Figure 7. This conformation was chosen because it was close to a cis Watson–Crick/Watson–Crick conformation and because it could be introduced with only very minor perturbations on the backbone.
Figure 7.

Conformation of the starting TAR*16(GA) and TAR*16(CA) loop closing residues. Interglycosidic distance is 12.3 Å for A*12/G*5 and 10.8 Å for A*12/C*5. Dashed lines represent hydrogen bonds.
Comparisons between TAR16–TAR*16, TAR16–TAR*16(GA) and TAR16–TAR*16(CA) simulated complexes
TAR16–TAR*16(GA) and TAR16–TAR*16(CA) MD runs exhibit an average RMSD of ∼2.7 Å versus the initial structure. As observed for TAR16–TAR*16, the global structure curvature of the mutated complexes disappeared quickly. Another shared characteristic was the increase in the TAR*12(C1′)–TAR*5(C1′) distance, which, as for TAR16–TAR*16, reached a value larger than the 10.9 Å generally found in A-form RNA.
The TAR16–TAR*16(CA) complex exhibited the most unstable trajectory. The A*11/U6 pair, initially in a cis Watson–Crick conformation, opened at time 1.4 ns and changed its conformation several times up to the end of the run. As expected, the A*12/C*5 combination did not reach a structural consensus. With a high C1′–C1′ distance, the C*5 and A*12 residues were unable to find a conformation able to bridge over a distance, ranging from 11.5 to 14 Å during the run. Moreover, the stacking at the junction between residues C6 and C*5/A*12 was the worst observed over the three mutants (Table 3).
TAR16–TAR*16(GA) exhibited a much more stable trajectory. In contrast to the previous simulations carried out, A*11/U6 remained closed during the entire 4 ns run. The only base pair opening observed was of the G*5/A*12 closing pair. Indeed, during the equilibration protocol, once the constraints were released, the GA pair opened but reformed in the same conformation after 1.3 ns and then remained stable until the end of the run. The GA closing base pair also allowed the best stacking at the junction (Table 3).
Compared with other cis Watson–Crick base pairs the intrinsic parameters of this unusual GA pair were characterized by large values of the three classical parameters: opening (average –24.4° for the last nanosecond of simulation), buckle (15.3°) and propeller twist (–20.3°). The average interglycosidic distance of 13.0 Å was associated with a high stretch of 1.6 Å. Compared with other cis Watson–Crick GA base pairs (37–39), the main characteristic of the GA closing pair lies in the high propeller twist and buckle angles.
Compared with the TAR16–TAR*16 dynamics, one additional inter-backbone hydrogen bond forms during the (GA) simulation. The symmetric counterpart of the TAR5*H2′–TAR6O1P hydrogen bond, namely TAR5H2′–TAR*6O1P, was also observed, but with a lower probability. TAR5*H2′–TAR6O1P had a probability of presence of ∼70%, whereas that of TAR5H2′–TAR*6O1P was 40%, and it was possible to see these two hydrogen bonds at the same time in only 10% of the registered frames. It is worth noting that these two H2′–O1P inter-backbone hydrogen bonds, not described in the TAR16–TAR*16 structure (12), are present in the kissing complex of the 23S rRNA (8), meaning that they might be a crucial stabilizing factor for loop–loop interactions. In the RNA Ii–RNA IIi kissing complex structure (6), the inter-backbone hydrogen bonds are sustained by H2′ and O2P atoms. The TAR5*H2′–TAR6O1P hydrogen bond was also present in the TAR16–TAR*16(CA) complex, but with a lower probability (50% presence instead of 95% for TAR16–TAR*16), and its symmetric TAR5H2′–TAR*6O1P hydrogen bond was seen only twice for periods shorter than 100 ps.
Hydrogen bonding for the (GA) simulation was correlated with the different combination of dihedral angles obtained at the stem–loop junctions. In fact, during the run two different combinations of dihedral angles appeared at the junctions and switched for periods of 300 ps up to >1 ns. The corresponding angles had very close values on both strands: strand 1, α6 60°, β6 130° and ζ5 60°; strand 2, α6 –40°, β6 –140° and ζ5 160° (note that for the TAR16–TAR*16 dynamics a combination similar to the second one was observed on the TAR*16 strand). However, the same conformation cannot be present simultaneously on both strands. When one junction adopted one conformation the other had to adopt the other. Combination 2 allows the reorientation of atom O1P from the phosphate moiety of residue 5 towards the sugar group of residue 6 of the other strand and facilitates hydrogen bond formation. In contrast, conformation 1 was really less favorable for hydrogen bond formation. In this case the donor–hydrogen acceptor angle was close to 100°, reducing the hydrogen bonding probability. As a matter of fact, during the entire run, at the junctions, the highly probable hydrogen bond always coexists with the less probable one, corresponding to dihedral combination 2 and 1, respectively.
Figure 8 shows the dihedral conformation switch of both strands that occurred at time 3.7 ns. Before this moment, the TAR*16 junction had its dihedral angles in conformation 2 and the TAR5*H2′–TAR6O1P hydrogen bond was stable. Within a few picoseconds, the conformation switched. Conformation 2 is observed on the TAR16 side and the TAR5H2′–TAR*6O1P hydrogen bond becomes the most probable one. During the whole simulation, conformation 2 was present for a global time of 3 ns on the TAR*16 side but for only 1 ns on TAR16. A similar phenomenon was observed during the TAR16–TAR*16(CA) simulation. However, the two conformations of dihedrals were seen alternating with higher frequency, without correlation between the two strands.
Figure 8.

Stereo view of residues 5 and 6 of each strand at 3680 ps (top) and 3720 ps (bottom) of the TAR–TAR*(GA) molecular dynamics run. TAR16 is in black and TAR*16 in gray. Note the continuity of the stacking between nucleotides G*5 and C6 that is not present on the other side. Dashed lines indicate the hydrogen bonds.
DISCUSSION
For the formation of stable kissing complexes, loop complementarity together with base stacking, length of the linkers to cross the major groove of the loop–loop helix and specific binding of cations such as magnesium are key structural determinants. Unpaired bases, for instance, used as linkers to cross the major groove of a loop–loop helix were described in the TAR–DNA aptamer kissing complex (17) and in the DIS of HIV-1 (40). RNA I–RNA II and TAR–TAR*, in contrast, are kissing complexes without any unpaired nucleotides to connect the stem and the loop of each RNA strand. R06, an RNA aptamer identified by in vitro selection against TAR, folds as a hairpin and also engages in loop–loop interactions with the viral RNA motif. Compared to TAR*, the aptamer displays a loop that is not fully complementary to the target one. Two unpaired residues, G and A, as demonstrated by footprinting experiments (20), close the aptamer loop. These bases that could not have been predicted on a rational basis provide an increased stability to the resulting kissing complex, at physiological magnesium concentration, compared to the rationally designed TAR–TAR* one. The aim of this study was to relate these observations to structural features. For this purpose, MD was used to compare TAR–TAR* and TAR–R06 kissing complexes. We decided to run MD on three TAR16–TAR*16 variants in order to study the structural role of the closing base pair on the duplex stability. In a first step, we ran MD from the TAR16–TAR*16 structure solved by NMR (12) and analyzed its trajectory focusing on the stability of the A/U base pair located at the junctions. Then, by substituting the 5* residue by a G or a C we were able to reproduce and understand the gain or loss of stability observed in the thermal denaturation experiments.
The three-dimensional structure of TAR16–TAR*16 obtained by MD differs from the one solved by NMR spectroscopy (12). Firstly, the kissing complex is not bent towards the major groove of the loop–loop helix. This curvature was also reported for all other kissing complex structures determined by NMR experiments (6,11,41). The simulated structure of TAR16–TAR*16 adopts an overall conformation which actually agrees well with the coaxial shape obtained for kissing complexes analyzed by X-ray crystallography (8,10). Secondly, the A/U base pairs at the stem–loop junctions, A*12/U*5 and U*6/A*11, are opened. MD predicts distances between the hydrogens of these bases >5 Å and exposure to the solvent. This is compatible with the absence of NOE peaks between the residues of these pairs (12) and with the one-dimensional imino spectrum (12,13). Moreover, A*12/U*5 tends to have a larger C1′–C1′ distance which allows the U*5 and C6 bases to stack. Finally, a rearrangement of dihedrals at the junctions allows the formation of an inter-backbone hydrogen bond as observed in other kissing complexes [RNA Ii–RNA Iii (6) and 23S rRNA (8)].
TAR*16(GA), the aptamer-like TAR ligand of highest affinity in vitro, displays the most stable behavior during the MD. No base pair opening was observed after an equilibration period. In this run, the stacking and the inter-backbone hydrogen bonds are optimized at the stem–loop junctions. Moreover, preliminary NMR experiments on TAR/TAR*16(GA) showed that the imino proton of G*5 was not exposed to the solvent and that the GA base pair is not in a sheared conformation as generally observed with purine/purine base pairs (J. Boisbouvier et al., unpublished results). These experimental results support the choice of the starting TAR*16(GA) structure. No experimental data were available to define the initial conformation of the TAR*16(CA) closing base pair. This obviously makes the results obtained for TAR/TAR*16(CA) more hypothetical. Nevertheless, with this variant we demonstrated that a closing base pair that cannot find a stable conformation with a 12 Å interglycosidic distance allows neither the formation of any stable hydrogen bond between the backbones of each strand nor a continuous stacking between the stems and the loops. Finally, TAR*16(UA) is an intermediate case. A UA closing base pair allows the formation of a hydrogen bond between the backbones of the structure and a continuous stacking between U*5 and C6. However, in this case, its loop closing base pair hardly finds a stable conformation with a large C1′–C1′ distance. In addition the U*6/A11 base pair is unstable.
Preliminary results concerning the unresolved solution structure of the RNA I–RNA II kissing complex (5) show an absence of imino proton resonance in the RNA I(U7)/RNA II(A13) base pair located at one extremity of the loop–loop helix. This reflects base pair opening at the junction. In contrast, RNA Ii–RNA IIi, which is 350 times more stable in vitro than the wild-type complex (3), shows full base pairing. Differences in structure and dynamics for TAR16–TAR*16 complexes are also located at the junctions. Taking into account energetic parameters such as hydrogen bonding and stacking (Table 3), differences in stability observed in vitro between these complexes can be reasonably related to these structural features.
In TAR16–TAR*16(GA) there are no linking residues at the junction. This implies high structural constraints on the backbone between residues 5 and 6 to cross the major groove. In order to relax these constraints and/or to optimize the stacking, we suggest that the distance between residues of the loop closing base pair has to be as large as possible. Indeed, Ducongé and Toulmé (20) showed that in all closing base pair variants of R0624, purine–purine ones and more particularly the GA combination have the best stabilizing effect on the kissing complex. Purine–pyrimidine combinations are less favorable for stable loop–loop interaction and pyrimidine–pyrimidine ones drastically decrease the kissing complex stability. A purine–purine combination in a cis Watson–Crick/Watson–Crick conformation is able to close the base pair with a 12.3 Å interglycosidic distance. Such a distance is incompatible with a purine–pyrimidine combination and even more so with a pyrimidine–pyrimidine one. In these cases the link between the two pairs needs to be mediated by water molecules. To build a regular RNA or DNA helix, cis Watson–Crick/Watson–Crick pyrimidine–purine base pairs were preferred to maintain a constant interglycosidic distance. The large interglycosidic distance between the GA cis Watson–Crick/Watson–Crick purine–purine base pair, which is known to disturb RNA helix (39), is here a crucial factor for dimer stability when located at the stem–loop junction.
In a previous work (21), in an attempt to determine whether the GA residues identified by in vitro selection against TAR (20) might be a rule to close hairpin loops and to lead to stable kissing complexes, the Watson–Crick GC pair of RNA II, next to the loop, was replaced by G and A residues. An increased stability of the RNA I–RNA II complex, monitored by thermal denaturation experiments, was observed. An in vitro selection against yeast tRNAPhe also identified G and A residues closing the loop of the aptamer (42). However, a selection performed against the DIS of HIV-1 demonstrated that the AA sheared pair, crucial for dimerization of the viral genome, is preferred over other combinations, including GA (43,44). Preliminary thermal denaturation experiments performed on other kissing complexes with shorter or longer loops did not give any clue to predict when a GA combination might be preferred for stable loop–loop interactions (unpublished results). In the DIS of HIV-1, three purine bases are always present at the junction of all known mutants. Substitutions of these residues by pyrimidine are always detrimental to the stability of the loop–loop interaction (40). Even if GA does not always seem to be the best combination for stable dimers, purine bases seem to be preferred at the stem–loop junctions of RNA hairpins involved in loop–loop interactions
In conclusion, the TAR16–TAR*16 simulated structure is consistent with the NMR data. The A*11/U6 and A*12/U*5 base pair opening reflects the very high tension and instability of the stem–loop junctions. Moreover, even if structures of the TAR*16 variants are not available, the MD results, starting from the TAR16–TAR*16 structure to generate a TAR–aptamer-like complex, correlate with the experimental Tm values obtained with TAR and the selected RNA aptamer. Inter-backbone hydrogen bonds, together with optimized stacking at the stem–loop junctions, seem to be structural factors that explain the increased stability of the TAR–aptamer complex when the loop of the aptamer is closed by G and A residues.
Acknowledgments
ACKNOWLEDGEMENTS
We are grateful to Justine Michel for the synthesis of the RNA and Fabien Darfeuille for helpful technical assistance and exciting discussion. We would like also to thank Eric Westhof for critical reading of the manuscript.
REFERENCES
- 1.Brunel C., Marquet,R., Romby,P. and Ehresmann,C. (2002) RNA loop-loop interactions as dynamic functional motifs. Biochimie, 84, 925–944. [DOI] [PubMed] [Google Scholar]
- 2.Eguchi Y. and Tomizawa,J. (1990) Complex formed by complementary RNA stem-loops and its stabilization by a protein: function of CoIE1 Rom protein. Cell, 60, 199–209. [DOI] [PubMed] [Google Scholar]
- 3.Tomizawa J. (1986) Control of ColE1 plasmid replication: binding of RNA I to RNA II and inhibition of primer formation. Cell, 47, 89–97. [DOI] [PubMed] [Google Scholar]
- 4.Masukata H. and Tomizawa,J. (1986) Control of primer formation for ColE1 plasmid replication: conformational change of the primer transcript. Cell, 44, 125–136. [DOI] [PubMed] [Google Scholar]
- 5.Marino J.P., Gregorian,R.S., Csankovszki,G. and Crothers,D.M. (1995) Bent helix formation between RNA hairpins with complementary loops. Science, 268, 1448–1454. [DOI] [PubMed] [Google Scholar]
- 6.Lee A.J. and Crothers,D.M. (1998) The solution structure of an RNA loop-loop complex: the ColE1 inverted loop sequence. Structure, 6, 993–1005. [DOI] [PubMed] [Google Scholar]
- 7.Westhof E., Dumas,P. and Moras,D. (1988) Restrained refinment of two crystalline forms of yeast aspartic acid and tRNAphe crystals. Acta Crystallogr. D Biol. Crystallogr., 44, 621. [PubMed] [Google Scholar]
- 8.Ban N., Nissen,P., Hansen,J., Moore,P.B. and Steitz,T.A. (2000) The complete atomic structure of the large ribosomal subunit at 2.4 Å resolution. Science, 289, 905. [DOI] [PubMed] [Google Scholar]
- 9.Kim C.H. and Tinoco,I. (2000) A retroviral RNA kissing complex containing only two G-C base pairs. Proc. Natl Acad. Sci. USA, 97, 9396–9401. [DOI] [PMC free article] [PubMed] [Google Scholar]
- 10.Ennifar E., Walter,P., Ehresmann,B., Ehresmann,C. and Dumas,P. (2001) Crystal structures of coaxially stacked kissing complexes of the HIV-1 RNA dimerization initiation site. Nature Struct. Biol., 8, 1064–1068. [DOI] [PubMed] [Google Scholar]
- 11.Mujeeb A., Clever,J.L., Billeci,T.M., James,T.L. and Parslow,T.G. (1998) Structure of the dimer initiation complex of HIV-1 genomic RNA. Nature Struct. Biol., 5, 432–436. [DOI] [PubMed] [Google Scholar]
- 12.Chang K.Y. and Tinoco,I. (1994) Characterization of a “kissing” hairpin complex derived from the human immunodeficiency virus genome. Proc. Natl Acad. Sci. USA, 91, 8705–8709. [DOI] [PMC free article] [PubMed] [Google Scholar]
- 13.Chang K.Y. and Tinoco,I. (1997) The structure of an RNA “Kissing” hairpin complex of the HIV TAR hairpin loop and its complement. J. Mol. Biol., 269, 52–66. [DOI] [PubMed] [Google Scholar]
- 14.Karn J. (1999) Tackling Tat. J. Mol. Biol., 293, 235–254. [DOI] [PubMed] [Google Scholar]
- 15.Comolli L.R., Pelton,J.G. and Tinoco,I. (1998) Mapping of a protein-RNA kissing hairpin interface: Rom and Tar-Tar*. Nucleic Acids Res., 26, 4688–4695. [DOI] [PMC free article] [PubMed] [Google Scholar]
- 16.Eguchi Y. and Tomizawa,J. (1991) Complexes formed by complementary RNA stem-loops. Their formations, structures and interaction with ColE1 Rom protein. J. Mol. Biol., 220, 831–842. [DOI] [PubMed] [Google Scholar]
- 17.Boiziau C., Dausse,E., Yurchenko,L. and Toulmé,J.J. (1999) DNA aptamers selected against the HIV-1 trans-activation responsive RNA element form RNA-DNA Kissing complexes. J. Biol. Chem., 274, 1273–1277. [DOI] [PubMed] [Google Scholar]
- 18.Collin D., Van Heijenoort,C., Toulmé,J.J. and Guittet,E. (2000) NMR charactrization of a kissing complex formed between the TAR element of HIV-1 and a DNA aptamer. Nucleic Acids Res., 28, 3386–3391. [DOI] [PMC free article] [PubMed] [Google Scholar]
- 19.Barbault F., Huynh-Dinh,T., Paoletti,J. and Lancelot,G. (2002) A new peculiar DNA structure: NMR solution of a DNA kissing complex. J. Biomol. Struct. Dyn., 19, 649–658. [DOI] [PubMed] [Google Scholar]
- 20.Ducongé F. and Toulmé,J.J. (1999) In vitro selection identifies key determinants for loop-loop interactions: RNA aptamers selective for the TAR RNA element of HIV-1. RNA, 5, 1605–1614. [DOI] [PMC free article] [PubMed] [Google Scholar]
- 21.Ducongé F., Di Primo,C. and Toulmé,J.J. (2000) Is a closing “GA pair” a rule for stable loop-loop RNA complexes. J. Biol. Chem., 275, 21287–21294. [DOI] [PubMed] [Google Scholar]
- 22.Nifosi R., Reyes,C.M. and Kollman,P.A. (2000) Molecular dynamics studies of the HIV-1 TAR and its complex with argininamide. Nucleic Acids Res., 28, 4944–4955. [DOI] [PMC free article] [PubMed] [Google Scholar]
- 23.Reyes C.M., Nifosi,R., Frankel,A.D. and Kollman,P.A. (2001) Molecular dynamics and binding specificity analysis of the bovine immunodeficiency virus BIV Tat-TAR complex. Biophys. J., 80, 2833–2842. [DOI] [PMC free article] [PubMed] [Google Scholar]
- 24.Pattabiran N., Martinez,H. and Shapiro,B. (2002) Molecular modeling and dynamics studies of HIV-1 kissing loop structures. J. Biomol. Struct. Dyn., 20, 397–412. [DOI] [PubMed] [Google Scholar]
- 25.Brooks B.R., Bruccoleri,R.E., Olafson,B.D., States,D.J., Swaminathan,S. and Karplus,M. (1983) CHARMM: a program for macromolecular energy, minimization and dynamics calculations. J. Comput. Chem., 4, 187–217. [Google Scholar]
- 26.Foloppe N. and Mackerell,A.D. (2000) All-atom empirical forcefield for nucleic acids: application to molecular dynamics simulations of DNA and RNA in solution. J. Comput. Chem., 21, 105–120. [Google Scholar]
- 27.Jorengsen W.L., Chandrasekhar,J., Madura,J.D., Imprey,R.W. and Klein,M.L. (1983) Comparison of simple potential functions for simulating water. J. Chem. Phys., 79, 926–935. [Google Scholar]
- 28.Beglov D. and Roux,B. (1994) Finite representation of an infinite bulk system: solvent boundary potential for computer simulations. J. Chem. Phys., 100, 9050–9063. [Google Scholar]
- 29.Essman U., Perera,L., Berkowitz,M.L., Darden,T.D. and Pedersen,L.G. (1995) A smooth particle mesh ewald method. J. Chem. Phys., 103, 8577–8593. [Google Scholar]
- 30.Ryckaert J.-P., Ciccotti,G. and Berendsen,H.J.C. (1977) Numerical integration of the Cartesian equations of motion of a system with constraints: molecular dynamics of n-alkanes. J. Comp. Phys., 23, 327–341. [Google Scholar]
- 31.Lu X.J., Shakked,Z. and Olson,W.K. (2000) A-DNA conformational motifs in ligand bound double helices. J. Mol. Biol., 300, 819–840. [DOI] [PubMed] [Google Scholar]
- 32.Cheatham T.E., Kollman,P.A. and Young,M.A. (2001) Molecular dynamics simulation of nucleic acids: successes, limitations and promise. Biopolymers, 56, 232–256. [DOI] [PubMed] [Google Scholar]
- 33.Cheatham T.E. and Kollman,P.A. (2001) Molecular dynamics simulation of nucleic acids. Annu. Rev. Phys. Chem., 51, 435–471. [DOI] [PubMed] [Google Scholar]
- 34.Leroy J.L. (1990) L’échange des protons iminos: une sonde du mouvement d’ouverture des bases des acides nucléiques. Regard Biochimie, 5, 57–65. [Google Scholar]
- 35.Leontis N.B., Stombaugh,J. and Westhof,E. (2002) The non Watson-Crick base pairs and their associated isostericity matrices. Nucleic Acids Res., 30, 3497–3531. [DOI] [PMC free article] [PubMed] [Google Scholar]
- 36.Reichtert J. and Sühnel,J. (2002) The IMB Jena image library of biological macromolecules: 2002 update. Nucleic Acids Res., 30, 253–254. [DOI] [PMC free article] [PubMed] [Google Scholar]
- 37.Cate J.H., Gooding,A.R., Podell,E., Zhou,K., Golden,B.L., Szewczak,A.A., Kundrot,C.E., Cech,T.R. and Doudna,J.A. (1996) RNA tertiary structure mediation by adenosine platforms. Science, 273, 1696–1699. [DOI] [PubMed] [Google Scholar]
- 38.Agalarov S.C., Prasad,G.S., Funke,P.M., Stout,C.D. and Williamson,J.R. (2000) Structure of the S15, S6, S18-rRNA complex: assembly of the 30S ribosome central domain. Science, 288, 107–113. [DOI] [PubMed] [Google Scholar]
- 39.Wu M., SantaLucia,J.J. and Turner,D.H. (1997) Solution structure of (rGCGAGCGC)2 by two-dimensional NMR and the iterative relaxation matrix approach. Biochemistry, 36, 4449–4460. [DOI] [PubMed] [Google Scholar]
- 40.Paillart J.C., Westhof,E., Ehresmann,C., Ehresmann,B. and Marquet,R. (1997) Non-canonical interactions in a kissing loop complex: the dimerization initiation site of HIV-1 genomic RNA. J. Mol. Biol., 270, 36–49. [DOI] [PubMed] [Google Scholar]
- 41.Chul-Hyun K. and Tinoco,I. (2000) A retroviral kissing complex containing only two G.C base pairs. Proc. Natl Acad. Sci. USA, 97, 9396–9401. [DOI] [PMC free article] [PubMed] [Google Scholar]
- 42.Scarabino D., Crisari,A., Lorenzini,S., Williams,K. and Valentini,G.P.T. (1999) tRNA prefers to kiss. EMBO J., 18, 4571–4578. [DOI] [PMC free article] [PubMed] [Google Scholar]
- 43.Lodmell J.S., Ehresmann,C., Ehresmann,B. and Marquet,R. (2000) Convergence of natural and artificial evolution on an RNA loop-loop interaction: the HIV-1 dimerization initiation site. Nucleic Acids Res., 6, 1267–1276. [DOI] [PMC free article] [PubMed] [Google Scholar]
- 44.Lodmell J.S., Ehresmann,C., Ehresmann,B. and Marquet,R. (2001) Structure and dimerization of HIV-1 kissing loop aptamers. J. Mol. Biol., 311, 475–490. [DOI] [PubMed] [Google Scholar]