Abstract
In squid nerves the Na+–Ca2+ exchanger is up-regulated by ATP and phosphoarginine (PA). ATP regulation involves drastic alterations in the , and interactions with the large intracellular cytoplasmic loop of the exchanger protein. In this work we explored the mechanisms associated with PA regulation in intracellular dialysed squid axons and squid optic nerve membrane vesicles. Dialysed axons were used to measure the four modes of exchange fluxes (– or forward exchange, – or reverse exchange, – exchange and – exchange) under controlled intra- and extracellular conditions. Inside-out membrane vesicles allowed measurement of the Na+-gradient-dependent 45Ca2+ uptake (forward mode) as influenced by ligands and digestion with chymotrypsin from the intracellular side. The results show that, unlike ATP, PA regulation does not affect the , and interactions with the intracellular ‘regulatory’ loop, but increases the affinity of the intracellular transport sites, preferentially for (about 20-fold) over (50%); i.e. PA favours the forward mode over the other exchange modes. Intracellular chymotrypsin digestion removed ATP regulation while leaving modulation by PA unmodified. Western blot analysis suggested that chymotrypsin disrupts the large intracellular loop. Together these results indicate that ATP and PA regulations are associated with different structures inside and outside the exchanger protein. Based on these observations we expanded our previous model for metabolic regulation of the Na+–Ca2+ exchanger by adding to the original ‘ATP region’ a new zone, the ‘PA region’, related to the intracellular transport sites for and . This new model is able to explain most previous and present results.
A common characteristic of numerous ion transporters is that they are highly regulated. Examples of types of regulation include direct effect of nucleotides, phosphorylation through lipid and/or protein kinases, and changes in the structure of cytoskeleton (Hilgemann & Ball 1996). The ubiquitous Na+–Ca2+ exchanger, which catalyses the counter transport of three (but see Fujioka et al. 2000) Na+ for one Ca2+, undergoes both ionic and metabolic modulation. Among the first are Ca2+ stimulation at the regulatory site, inactivation and inhibition (Doering & Lederer 1994; DiPolo & Beaugé 1999). Metabolic regulation includes ATP modulation. This can be exerted through lipid kinases, leading to phosphatidylinositol 4,5-biphosphate (PIP2) formation (Hilgemann & Ball 1996) and exchanger–PIP2 interactions (Asteggiano et al. 2001), protein kinases [protein kinase C (PKC), protein kinase A (PKA) tyrosine kinase (TyK)] (Shigekawa & Iwamoto 2001) and phosphorylation of unknown substrates via soluble regulatory cytosolic proteins (Beaugéet al. 1996; DiPolo et al. 1997).
An interesting feature of mammalian heart (vertebrate) and squid nerve (mollusc) Na+–Ca2+ exchangers is that two different metabolic pathways result in up-regulation with the same kinetic consequences: increase in the affinity of the -regulatory site for , decrease in -dependent inactivation (Hilgemann et al. 1992a,b) and reduction of and – synergistic inhibition (DiPolo & Beaugé 2002a,b). In the cardiac exchanger ATP acts through the production of PIP2 (Hilgemann et al. 1992a,b; Berberián et al. 1998) and, to a lesser degree, of PIP (Berberián et al. 1998). In the squid, ATP almost certainly promotes phosphorylation; although the target structure(s) have not been identified, polyphosphoinositides are not involved (DiPolo et al. 2000). In addition, in the squid preparation ATP stimulation requires the presence of a still unknown 13 kDa soluble cytosolic protein (SCRP) (Beaugéet al. 1996; DiPolo et al. 1997; DiPolo & Beaugé 2002a). These processes involve the large cytoplasmic loop of the exchanger because its removal leads to a fully active, non-regulated, exchanger (Hilgemann 1990; Matsuoka et al. 1993), i.e. the integrity of the intracellular loop is essential for regulation but not for Ca2+ and/or Na+ translocation. Incidentally, and transport (translocation) sites seem located at, or near, the transmembrane α repeats (Philipson & Nicoll 2000).
A new metabolic up-regulation of the Na+–Ca2+ exchanger, induced by PA, has been reported in squid nerve (DiPolo & Beaugé 1995). This regulation is independent of that of ATP and the effects of PA and ATP are additive (DiPolo & Beaugé 1998). PA, present in millimolar concentration in the cytosol, activates Na+–Ca2+ exchange in a way that preferentially promotes – (forward) exchange over the other exchange modes (–, – or –) (DiPolo & Beaugé 1998). The main purpose of the present study was to look into the mechanism by which PA modifies the exchanger. The results show that PA regulation is unrelated to the , and interactions with the intracellular regulatory loop, and acts by increasing the affinity of the intracellular cation (mainly calcium) transport sites. Based on these observations we expand our previous kinetic model on regulation of the squid Na+–Ca2+ exchanger in a way that satisfactorily explains most of the observed effects of ATP (DiPolo & Beaugé 2002a) and PA.
Methods
Intracellular dialysis of squid giant axons
Giant axons obtained (after decapitation) from two squid species, Loligo pealei (Marine Biological Laboratory, Woods Hole, MA, USA) and Loligo plei (Instituto Venezolano de Investigaciones Cientificas; Fundaciencia-IVIC), were dialysed with highly permeable capillaries of regenerated cellulose fibres (210 μm o.d.; 200 μm i.d.; molecular weight cut off (MWCO) of 18 kDa; Spectrapor Number 132226; Spectrum, Houston, TX, USA). All procedures conformed with the UK Animals (Scientific Procedures) Act 1986/local named Committee guidelines.
Internal solutions
The standard dialysis solution had the following composition: Tris-Mops, 385 mm; NaCl, 45 mm; MgCl2, 2 mm; glycine 285 mm; Tris-EGTA, 1–3 mm or BAPTA 3 mm, pH 7.3. Changes in [Na+]i (chloride salt) were compensated with isosmolar amounts of Mops-Tris. Other internal solutions are indicated in the figures and figure legends. concentrations up to 1 μm were estimated with the WinMaxc computer program (Version 2.00, 1999; Chris Patton Hopkins Marine Station, CA, USA); higher [Ca2+]i were taken as equal to the [CaCl2] added in excess to the concentrations of EGTA or BAPTA. Addition of ATP (3 mm) or PA was performed at a constant free Mg2+ of 2 mm. The [Mg2+]i values were calculated also with the WinMaxc computer program. In this regard, the Mg–PA dissociation constant was taken equal to that of the Mg–phosphate complex. The Ca2+ pump component of Ca2+ efflux and the Na+–K+ pump were eliminated by adding 100 μm vanadate.
Extracellular solutions
The external Ca2+-free–-containing solution (–0) consisted of: NaCl, 440 mm; MgCl2, 60 mm; Tris-Cl, 10 mm; pH 7.6; removal of external sodium was compensated with . When present, external [Ca2+] was 3 mm. To stop any endogenous production of ATP, 1 mm NaCN was always present. Na+ channels were blocked with 100 nm TTX. The osmolarity of all solutions was adjusted to 940 mOsm l−1. At the beginning of the experiments the axons were routinely dialysed for about 45 min with a standard medium containing 0.2 mm EGTA and free of calcium and ATP. In all cases each axon served as its own control, because steady-state fluxes were measured before and after a given experimental condition. BAPTA was purchased from Molecular Probes (Eugene, OR, USA). PA was from Fluka (Switzerland). All other reagents were from Sigma (St Louis, MO, USA). Working temperature was between 17 and 18°C.
Preparation of squid nerve membrane vesicles and the SCRP
Membrane vesicles from squid optic nerve (Sepiotheutis sepioidea and Loligo pealei) were prepared by differential centrifugation (DiPolo et al. 1997) and loaded with 300 mm NaCl, 0.1 mm EDTA and 30 mm Mops-Tris (pH 7.3 at 20°C). The SCRP was obtained from squid optic ganglia (brain). The tissue was initially homogenized (1 : 1 v/v ratio) in 20 mm Mops-Tris (pH 7.3 at 20°C), 0.1 mm EDTA and an antiprotease cocktail [0.5 mm phenylmethylsulphonyl fluoride (PMFS) plus 10 μg ml−1 of aprotinin, leupeptin and pepstatin A]. The homogenate was next centrifuged at 12 000 ×g for 10 min and the supernatant was further centrifuged at 100 000 ×g for 30 min. The 100 000 ×g supernatant went through two successive filtrations (Amicon Centricon): first, through a 100 kDa MW cut-off filter and after that through a 30 kDa cut-off filter. The final filtrate was used as a source for the cytosolic regulatory protein.
Na+ gradient-dependent 45Ca2+ uptake in squid optic membrane vesicles
This work focuses on the interaction of Na+, Ca2+, H+, ATP and PA on the intracellular side of the Na+–Ca2+ exchanger (Blaustein & Lederer 1999; Philipson & Nicoll 2000; DiPolo & Beaugé 2002a,b). Therefore, the relevant flux is the Na+ gradient-dependent Ca2+ uptake (forward exchange mode in inside-out vesicles) as affected by the aforementioned ligands in the extravesicular media. The uptake of 45Ca2+ in squid membrane vesicles was measured at 20–22°C by incubating the vesicles (50–60 μg protein) for 10 or 20 s in media with high (300 mm) or low (30 mm) Na+ (200 μl total volume) (DiPolo et al. 2000). The incubation solutions also contained 0.2 mm vanadate, 20 mm Mops-Tris (pH 7.3 at 20°C), 1 mm free Mg2+, 5 μm and, when indicated, 1 mm ATP + 5 μl SCRP or 10 mm PA. In low Na+ media, the osmolarity was matched with N-methyl-d-glucamine (NMG)-Cl. The reaction was stopped with 0.8 ml of an ice-cold solution containing 20 mm Mops-Tris, 300 mm KCl and 1 mm EGTA and filtered through Whatman GF/F glass filters. The filters were washed with 5 ml of the same solution, immersed into 5 ml of scintillation fluid and, after 4 h, counted in a liquid scintillation counter.
Chymotrypsin digestion experiments: electrophoresis separation and Western blot analysis
Squid optic membrane vesicles (usually 5 mg ml−1 of protein) were incubated for 20 min at 20°C (1 : 1, v/v) in a high Na+ solution (300 mm NaCl, 20 mm Mops-Tris, pH 7.3 at 20°C) in the absence and presence of chymotrypsin (Sigma C-7762; 1 mg ml−1 final concentration). Preliminary experiments indicated that in this preparation, and under these conditions, chymotrypsin removal of MgATP stimulation requires 20 min. Therefore, the 20 min used here ensures that ATP regulation is abolished whereas, as will be seen below, PA modulation remains unaffected.
For electrophoresis and Western blot, the reaction was stopped by adding four times concentrated sample buffer and heated for 10 min at 37°C. To estimate the Na+–Ca2+ exchange activity, the vesicles were diluted 10-fold in the calcium uptake solution (see above). For electrophoresis separation, aliquots of 40 μg of total initial membrane protein were run on 4–12% Bis-Tris gel (Nupage, NOVEX) and then stained with Coomassie blue or electrotransfered to PVDF membranes for Western blots. The primary antibodies used were: a guinea-pig polyclonal antibody (Ab) against the N-terminal portion of the bovine cardiac Na+–Ca2+ exchanger (Aceto et al. 1992; kindly provided by Dr J. P. Reeves) and a rabbit polyclonal Ab against the large intracellular loop of the squid Na+–Ca2+ exchanger (He et al. 1998; kindly provided by Dr K. Philipson). The bands recognized by specific antibodies were detected using the Amersham ECF immunobloting detection system and analysed with a Storm 840 image analyser.
Results
Effects of PA on the different transport modalities of the squid Na+–Ca2+ exchanger as influenced by [Ca2+]i
Initial experiments looked into the influence of [Ca2+]i on the effects of PA on the four transport modes of the squid Na+–Ca2+ exchanger: – (forward); – (reverse) and the homologous – and – exchanges. Their operational definition will become clear in the description of the figures. Two extreme concentrations of were used: 5 μm (non-saturating or limiting) and 500 μm (close to saturation and consequently non-limiting). The axons were dialysed with no ATP, low (10 mm) or normal (30 mm) Na+ and at a physiological pHi of 7.3.
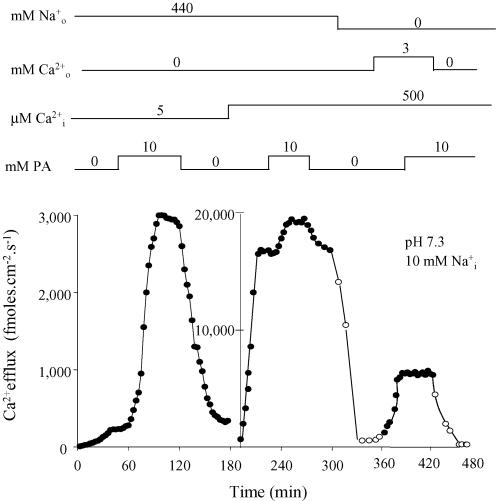
Figure 1 describes the results in an axon dialysed with 10 mm . The figure is divided in two panels by two differently labelled vertical axes. The left panel corresponds to Ca2+ efflux in the presence of full and no (forward – exchange) at [Ca2+]i of 5 μm (limiting). Under these conditions, 10 mm PA reversibly raises Ca2+ efflux about 14-fold (from 200 fmol cm−2 s−1 to 3000 fmol cm−2 s−1; note that leak fluxes are practically non-existent). In the right panel [Ca2+]i is 500 μm (non-limiting). The increase in has two consequences: first, it increases the basal forward exchange from 200 fmol cm−2 s−1 to ∼17 000 fmol cm−2 s−1; second, it reduces PA stimulation of the forward exchange to only 12%. The right-hand panel also shows that, once PA is taken away, removal of external Na+ in the absence of (open symbols) increases Ca2+ efflux to leak levels. Addition of a saturating external [Ca2+] of 3 mm in the absence of (DiPolo & Beaugé 1987) increases the efflux of Ca2+ (– exchange) to ∼6000 fmol cm−2 s−1. With both internal and external Ca2+ transport sites saturated, – exchange reached its maximal possible value; this is only one-third of the forward exchange and, interestingly, is not affected by 10 mm PA. Finally, upon removal of and the efflux of Ca2+ falls to leak levels, indicating that the preparation remained in excellent condition.
Figure 1. Effect of PA on the forward and – exchange fluxes at limiting and non-limiting [Ca2+]I.
Filled symbols correspond to the efflux of Ca2+ in the 440 mm –0 (forward exchange) or in 3 mm Ca2+–0 (Ca2+–Ca2+ exchange). Open symbols represent the efflux of Ca2+ in the absence of both extracellular Na+ and Ca2+ (unspecific and/or leak fluxes). The inclusion and/or withdrawal of intra- and extracellular ligands are indicated on top of the figure. The ligands and units of concentration are on the left and the actual concentrations over the corresponding line. Note that Li+ was used as an inert Na+ replacement. Ordinate: Ca2+ efflux (fmol cm−2 s−1). Abscissa: time (min). The pHi and [Na+]i are given in the insert. See text for details.
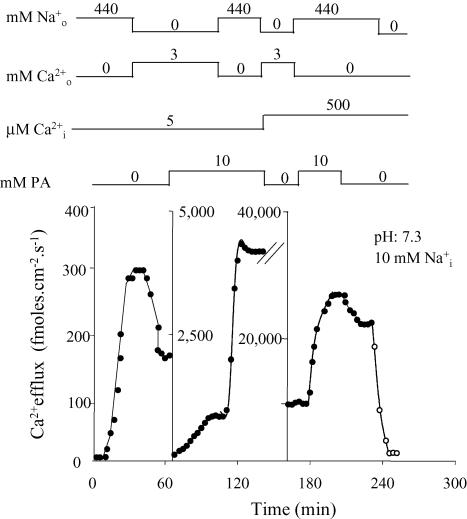
Figure 2 illustrates another experiment on Ca2+ efflux. In this case the different labelled vertical axes divide the figure into three panels. On the left, the axon, dialysed with 5 μm[Ca2+]i, has a forward – (440 mm and no ) of 300 fmol cm−2 s−1, which almost doubles the 170 fmol cm−2 s−1 of – exchange (3 mm and no ) flux. Although the external [Na+] and [Ca2+] are saturating, intracellular [Ca2+] (5 μm) is not; the measured fluxes are far from maximal. The middle panel shows that at this point 10 mm PA produces a 5.3-fold increase in – exchange, from 170 fmol cm−2 s−1 to 900 fmol cm−2 s−1. This contrasts with the lack of PA effect when this exchange mode is proceeding at its maximal rate in Fig. 1. With 10 mm PA, replacement of with resulted in a forward – exchange of 4000 fmol cm−2 s−1; this is a 13-fold increase over the 300 fmol cm−2 s−1 without PA in the left panel. The right panel corresponds to a non-limiting [Ca2+]i of 500 μm; under this condition, the fractional PA stimulation of the forward exchange (seen here as a reduction in flux following PA removal) is only about 12%. This agrees with the results of Fig. 1. The larger value of the forward – over the – exchange fluxes, and the fact that PA stimulation of – exchange occurs only at limiting [Ca2+]i, suggest that the entry of Ca2+ is the rate-limiting step in the Na+–Ca2+ exchange reaction cycles.
Figure 2. Effect of PA on – exchange at low [Na+]i under limiting and non-limiting [Ca2+]I.
Filled symbols correspond to the efflux of Ca2+ in the presence of Ca2+-free–NaSW (forward exchange) or 3 mm Ca2+–LiSW (Ca2+–Ca2+ exchange). Open symbols represent the efflux of Ca2+ in the absence of both extracellular Na+ and Ca2+ (unspecific and/or leak fluxes). The inclusion and/or withdrawal of intra- and extracellular ligands are indicated on top of the figure. The ligands and the units of concentration are given on the left and the actual concentrations are given over the corresponding line. The pHi and [Na+]i are given in the insert. Note: (i) Li+ was used as an inert Na+ replacement; (ii) [Na+]i was 10 mm; (iii) as a comparison, the effects of PA on the forward Na+–Ca2+ were also studied in this axon. Ordinate: Ca2+ efflux (fmol cm−2 s−1) Abscissa: time (min). See text for details.
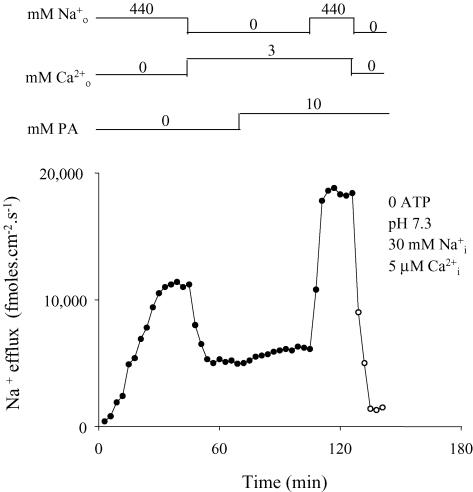
The results shown in Fig. 3 agree with the interpretation given above. In this experiment, – and reverse – exchanges were estimated on the basis of the efflux of 22Na+ from an axon with a limiting [Ca2+]i of 5 μm. In the absence of PA, the efflux of Na+ has a value of about 12 000 fmol cm−2 s−1 through the – (440 mm and no ) and decreases to 6000 fmol cm−2 s−1 when it goes through the reverse – cycle (3 mm and no ). This suggests that, even with the intracellular Ca2+ sites unsaturated, Ca2+ entry is slower than uptake (see Discussion). This explanation is supported by the fact that PA has a minor stimulation on the reverse as compared with – exchange. An additional important result in Fig. 3 is that the PA stimulation of – exchange is only two-fold against the14- to 16-fold induced on the -dependent (forward) Ca2+ efflux at similar limiting [Ca2+]i (see Figs 1, 2, 10 and 15).
Figure 3. Effect of PA on – exchange and reverse – exchange at 5 μm .
Filled symbols correspond to the efflux of Na+ in the presence of Ca2+-free–NaSW (Na+–Na+ exchange) or 3 mm Ca2+–LiSW (reverse Na+–Ca2+ exchange). Open symbols represent the efflux of Na+ in the absence of both extracellular Na+ and Ca2+ (unspecific and leak fluxes). The inclusion and/or withdrawal of intra- and extracellular ligands are indicated on top of the figure. The ligands and the units of concentration are given on the left and the actual concentrations over the corresponding line. The pHi, [Na+]i and [Ca2+]i are given in the insert. Note: (i) Li+ was used as an inert Na+ replacement; (ii) [Na+]i was 30 mm; and (iii) [Ca2+]i was 5 μm (non-limiting). Ordinate: Na+ efflux (fmol cm−2 s−1). Abscissa: time (min). See text for details.
Figure 10. Effect of PA on the apparent affinity of the intracellular Na+ transport sites of the Na+–Ca2+ exchanger with the Cai-regulatory site saturated.
The points correspond to the mean ± s.e.m of flux data obtained from different axons in the absence (open symbols) and presence (filled symbols) of 10 mm PA. The numbers of axons are given in parentheses. Ordinate: (+ )-dependent Na+ efflux (fmol cm−2 s−1). Abscissa: [Na+]i (mm). Notice that under complete saturation of the Cai regulatory site (5 μm and pHi 8.8), PA increases no more than two-fold the apparent affinity of the transport sites. See text for details.
Table 1 summarizes the results of the experiments related to this section on all transport modalities of the Na+–Ca2+ exchanger at physiological pHi, low or physiological [Na+]i, and at limiting (5 μm) and non-limiting (500 μm) [Ca2+]i. The general conclusion is that PA preferentially stimulated the forward – exchange mode.
Table 1.
Ratios of fluxes in 10 mm PA/0 PA for the four different transport modes of the squid Na+–Ca2+ exchanger in axons dialysed with limiting (5 μm) and non-limiting (500 μm) concentrations
| [Ca2+]i | ||
|---|---|---|
| Transport mode | 5 μm | 500 μm |
| – (forward) | 16.0 ± 3.0 (4) | 1.5 ± 0.3 (3) |
| – (reverse) | 1.2 ± 0.2 (3) | 1.0 (3) |
| – | 1.8 ± 0.2 (4) | 1.3 ± 0.15 (3) |
| – | 7.0 ± 1.6 (3) | 1.0 (2) |
PA and and interactions with the exchanger
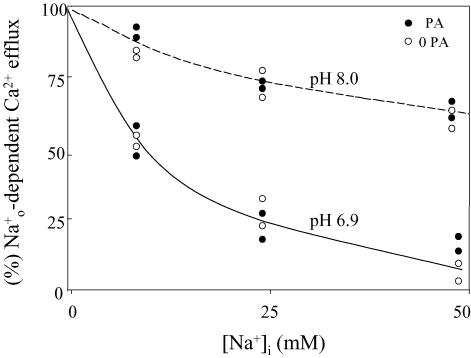
In dialysed squid axons, and concur in inhibiting the Na+–Ca2+ exchanger by reducing the affinity of the Cai-regulatory site. These processes take place on the large intracellular loop (Philipson & Nicoll 2000) and are antagonized by MgATP (DiPolo & Beaugé 2002a). In this section we explored whether the stimulation of the exchanger by PA is also related to those , and interactions. Figure 4 contains data from several axons, normalized to the values of fluxes at 0 , where [Na+]i inhibition was studied at pHi values of 6.9 and 8.0 in the absence and presence of PA. In agreement with previous observations (DiPolo & Beaugé 2002a), the and synergism is more pronounced at pH 6.9 than at pH 8.0. On the other hand, in contrast with ATP, PA fails to overcome and interaction.
Figure 4. Effect of on the forward Na+–Ca2+ exchange at different pHi in the presence and absence of PA.
Collected data of two axons showing the concentration dependence of inhibition of the forward Na+–Ca2+ exchange at pHi 6.8 and 8.0 in the absence (open symbols) and presence (filled symbols) of 10 mm PA. Ordinate, percentage Nao-dependent Ca2+ efflux (– forward exchange) in relation to the flux obtained in the absence of . Abscissa: intracellular Na+ (mm). Note the lack of PA effect at either pH. See text for details.
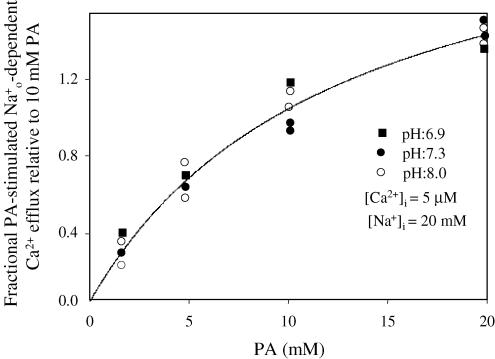
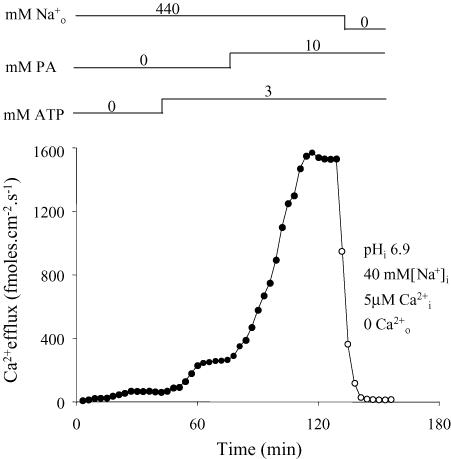
An additional interesting finding in these experiments (data not shown) was that at pH 6.9 PA stimulation at low or no [Na+]i was rather small (less than a factor of two) in comparison with the 16-fold seen at a physiological pH of 7.3 (DiPolo & Beaugé 1998; Table 1). For this reason we explored the possibility that intracellular protons per se influence PA modulation of the Na+– exchanger. Figure 5 summarizes the results of several experiments in which the PA-stimulated forward – exchange, at pHi 6.9, 7.3 and 8.0, were normalized to that observed at 10 mm PA. Clearly, large variations in the intracellular pH have no effect on the apparent affinity for PA. Actually, this result is predicted by the model for PA modulation proposed here (see Fig. 14F in the Discusion). Next, we decided to associate acidic pHi with the presence of 3 mm MgATP, a condition known to prevent and inhibition (DiPolo & Beaugé 2002a). In the experiment illustrated in Fig. 6 the axon was continuously dialysed with 5 μm[Ca2+]i, 40 mm and pHi 6.9; at the beginning there was no ATP or PA. Upon addition of 3 mm ATP the low initial level of -dependent (forward) Ca2+ efflux of 60 fmol cm−2 s−1 increased to 240 fmol cm−2 s−1. This increment is similar to that seen without ATP at pHi 7.3 in Fig. 2, indicating that MgATP fully counteracted the effects of low pH. Interestingly, under these conditions, addition of 10 mm PA causes a marked (eight-fold) activation of the forward exchange. Consequently, it can be deduced that PA is able to stimulate substantially the squid Na+–Ca2+ exchanger at acidic pH as long as MgATP protects the system against the synergic and inhibition.
Figure 5. Stimulation by PA of the forward – exchange at different pHi in the absence of ATP.
Collected data from five different axons were normalized to the stimulation observed at 10 mm PA. Ordinate: fractional PA-stimulated -dependent Ca2+ efflux. Abscissa: PA (mm). The pHi, [Na+]i and [Ca2+]i are given in the insert. Notice that a wide rage of pHi (6.9–8.0) has no effect on the apparent affinity for PA. See text for details.
Figure 14. Simulations based on the proposed kinetic model for ATP and PA modulation of the Na+–Ca2+ exchanger.
See Discussion for details.
Figure 6. Effect of PA at limiting [Ca2+]i at pHi of 6.9 when the Cai regulatory site is protected by 3 mm MgATP.
Filled symbols correspond to the efflux of Ca2+ in the presence of -free–NaSW (forward exchange). Open symbols represent the efflux of Ca2+ in the absence of both extracellular Na+ and Ca2+ (unspecific and/or leak fluxes). The inclusion and/or withdrawal of intra- and extracellular ligands are indicated on top of the figure. The ligands and the units of concentration are given on the left and the actual concentrations over the corresponding line. The pHi, [Na+]i, [Ca2+]i and [Ca2+]o are given in the insert. Ordinate: Ca2+ efflux (fmol cm−2 s−1). Abscissa: time (min). Note: (i) Li+ was used as an inert Na+ replacement; (ii) in the presence of 3 mm MgATP, PA induces a marked activation of the forward – exchange at pHi of 6.9. See text for details.
PA and the affinity of the intracellular Cai-regulatory site for
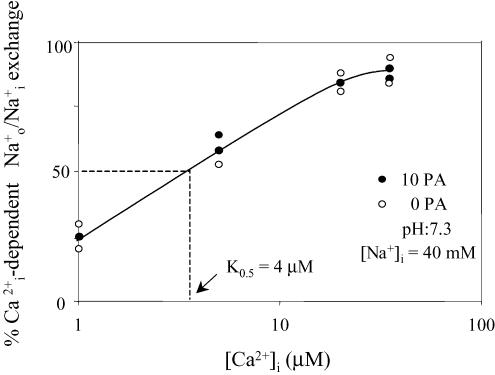
In squid axons (DiPolo & Beaugé 1987) and cardiac myocytes (Hilgemann et al. 1992a) MgATP up-regulation of the Na+–Ca2+ exchanger is the result of a marked increase in the affinity of the -regulatory site located on the large intracellular loop (Levitsky et al. 1994; He et al. 1998). The possible role of this site in PA regulation was explored in experiments like those summarized in Fig. 7; the apparent affinity for was estimated from its ability to stimulate the – exchange mode at 40 mm , pH 7.3 and no ATP (DiPolo & Beaugé 1987,2002a). Dialysis solutions nominally free of [Ca2+]i contained 3 mm BAPTA. The data, normalized to the values of Na+ efflux obtained at 50 μm , show no influence of PA on the affinity of the regulatory site. The apparent affinity for (4 μm) agrees with previously reported values (DiPolo & Beaugé 2002a). Note that the rationale for these experiments was that it is possible to assess the affinity of the regulatory site during the forward – exchange with data obtained from – exchange. The underlying assumption is that the properties of this site do not change in the different modes of transport. The ideal experiment is to use the forward mode; unfortunately, this is complicated by the simultaneous activation of transport and regulatory sites and, additionally, by the fact that PA modifies the affinity of the transport sites (see below).
Figure 7. PA has no effect on the activation of the Na+–Na+ exchange mode of the –Ca2+ exchanger.
Collected data of two axons showing the concentration dependence of activation of Na+–Na+ exchange in the absence (open symbols) and presence (filled symbols) of 10 mm PA in axons dialysed without ATP. Ordinate, percentage -dependent – exchange in relation to the flux obtained with 50 μm . Abscissa: intracellular Ca2+ (mm) (logarithmic scale). Note the lack of PA effect on the apparent affinity for (about 4 μm). See text for details.
ATP and PA stimulation of the Na+-dependent 45Ca2+ uptake in intact and chymotrypsin-treated membrane vesicles from squid brain
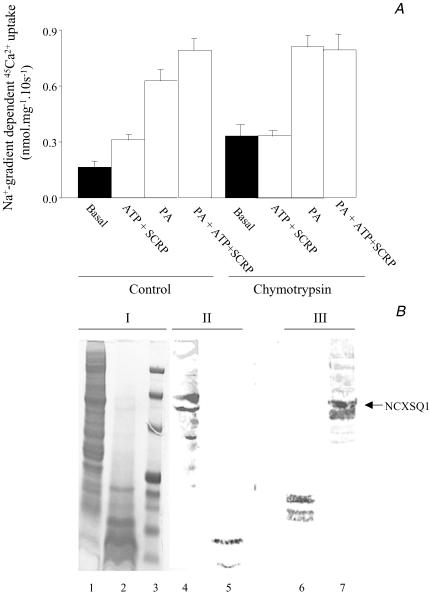
The experiments reported above indicate that modulation of the Na+–Ca2+ exchanger by PA does not involve changes in the and synergic inhibition or in the affinity of the -regulatory site. In mammalian heart and squid nerve Na+–Ca2+ exchangers under patch clamp conditions, chymotrypsin digestion on the cytosolic side removes inactivation and regulation; the exchangers remain fully active but ‘deregulated’ (Hilgemann 1990; He et al. 1998). The idea of a different localization of PA and ATP would gain support if PA stimulation were also observed after chymotrypsin digestion. This was investigated in squid nerve membrane vesicles by comparing the effects of α-chymotrypsin on MgATP and PA stimulation of the exchanger. Figure 8A summarizes the results of three experiments on Na+ gradient-dependent 45Ca2+ uptake. The left-hand panel corresponds to untreated and the right-hand panel to chymotrypsin-treated vesicles. In control vesicles, ATP in the presence of the SCRP induced the expected increase in the Na+–Ca2+ exchange fluxes (DiPolo et al. 1997,2000). In addition, PA alone (without SCRP) produced an even larger stimulation of these fluxes. Furthermore, when added with ATP + SCRP, PA activated the fluxes to levels equal to the sum of ATP + SCRP plus PA alone, i.e. PA and ATP effects are additive. These results are similar to those found in dialysed squid axons (DiPolo & Beaugé 1998). In vesicles treated with chymotrypsin, the basal Na+ gradient-dependent 45Ca2+ uptake is about twice of that in control and insensitive to ATP + SCRP. This is to be expected for a deregulated exchanger (Hilgemann 1990; Hilgemann et al. 1992a). Nevertheless, these ‘unregulated’ vesicles showed a PA stimulation similar to that seen in untreated preparation.
Figure 8. Effect of ATP and PA on the Na+ gradient-dependent 45Ca2+ uptake in control and chymotrypsin-digested squid optic nerve membrane vesicles.
A, Na+ gradient-dependent 45Ca2+ uptake. Basal refers to Ca2+ uptake in the absence of ATP and PA. SCRP refers to the inclusion of the 13 kDa soluble regulatory cytosolic protein. Ordinate: Na+ gradient-dependent 45Ca2+ uptake. Abscissa: control and chymotrypsin-treated vesicles. B, PAGE membrane proteins patterns and Western blots. Aliquots of initial 40 μg total protein of control and chymotrypsin-treated vesicles (1 mg chymotrypsin ml−1 for 20 min at 20°C) were separated on 4–12% Bis-Tris gel, stained with Coomassie blue (I) or immunoblotted with antibodies against the loop-portion of the squid (NCXSQ1) (II) and the NH-terminal portion of the mammalian heart (NCX1) exchangers (III). The antibody against the mammalian heart exchanger cross-reacts with that of the squid nerve. Lanes 1, 4 and 7 are control vesicles; lanes 2, 5 and 6 are vesicles treated with chymotrypsin. Lane 3 corresponds to MW standards (top to bottom, in kDa: 210, 135, 82, 38.7, 31.9, 18.10, 7.4). An arrow on the right-hand side indicates the position of NCXSQ1. See Methods and Results for details. Bars indicate the mean ± s.e.m from three different experiments. See text for details.
The effects of chymotrypsin digestion on the protein content of these vesicles are shown in Fig. 8B. Panel I is an SDS-PAGE showing the changes induced in the migration pattern of total membrane proteins. A comparison of Lane 1 (control) with Lane 2 (treated) indicates that chymotrypsin produces a marked reduction in proteins of high molecular weight (MW) together with an increase in proteins of low MW (Lane 3 shows standard MW markers). The Western blots of Panels II and III confirm that this digestion affects the integrity of the exchanger. In control samples, both the anti-loop Ab bands (Lane 4) and the bands detected by the Ab against the N-terminal portion (Lane 7) are at the MW level of the intact Na+–Ca2+ exchanger. The doublet near 140 kDa and 120 kDa is a common observation (see Asteggiano et al. 2001).
By contrast, in chymotrypsin-treated samples the anti-loop Ab recognizes only proteins of MW around and below 17 kDa (Lane 5). This indicates that chymotrypsin does not just cut the exchanger but that the large loop has been affected and the region responsible for the reaction with the Ab deleted. Yet, two crucial questions remain unanswered: (i) how much of the loop was taken away and how much stayed attached to the main protein; and (ii) whether the loop fragmentation depicted in the gel corresponds to the loss of these fragments in situ, i.e. loosely bound fragments may still, in theory, be functional. The anti N-terminal Ab bands are also displaced to lower MW although still keeping the doublet characteristic (Lane 6). The position of the doublet, around 30–35 kDa, is one half of the 70 kDa observed with Coomasie in SDS-PAGE of digested enriched cardiac exchanger (Philipson et al. 1988). A reason for the discrepancy might be that chymotrypsin digestion of the mammalian heart Na+–Ca2+ exchanger is not entirely equivalent to that of the squid nerve. A possibility is that in the squid the 70 kDa fragment is cut in two, one with the N- and the other with the C-terminus. Unfortunately, we did not have antibodies against the C-terminal portion of the exchanger to investigate this possibility. Regardless, the remaining squid exchanger protein is functional and stimulated with PA, as is shown in Fig. 8A.
Effects of PA on the affinities of the intracellular translocation sites for Ca2+ and Na+ ions
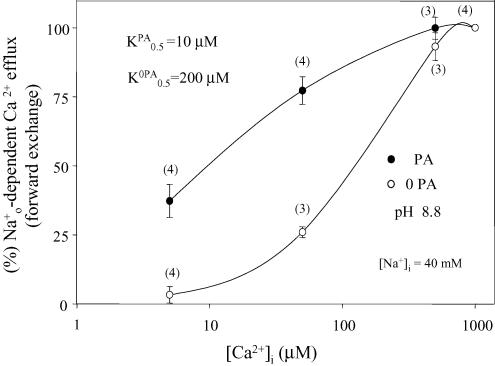
The results described so far indicate that PA modulation of the squid Na+–Ca2+ is unrelated to the , and interactions with the regulatory loop but seems to involve the intracellular cation transport sites. To investigate this further, fluxes were measured under conditions in which the -regulatory site was fully saturated. This was accomplished by having at least 5 μm[Ca2+]i and pHi of 8.8 (DiPolo & Beaugé 2002a). In Fig. 9, the K½ for stimulation of the forward – exchange decreases from 200 μm without to 10 μm[Ca2+]i with PA; this corresponds to a 20-fold increase in the apparent affinity of the transport sites for . In the experiments described in Fig. 10, the dependence of the – exchange mode was followed up to 180 mm[Na+]i at pH 8.8 and 5 μm[Ca2+]i. It is clear that, although PA also increases the affinity for , the effect is much smaller than for , i.e. no more than a factor of two.
Figure 9. Effect of PA on the apparent affinity of the intracellular Ca2+ transport sites of the Na+–Ca2+ exchanger in the presence of a saturated Cai-regulatory site.
The points correspond to the mean ± s.e.m of data obtained from different axons in the absence (open symbols) and presence (filled symbols) of 10 mm PA. All values were normalized to those obtained at 50 μm in each condition. The numbers of axons are given between parentheses. Ordinate: percentage -dependent Ca2+ efflux. Abscissa: [Ca2+]i (μm) (logarithmic scale). Notice that under complete saturation of the regulatory site (5 μm or more, 40 mm and pHi 8.8), PA increases about 20-fold the apparent affinity of the transport sites. See text for details.
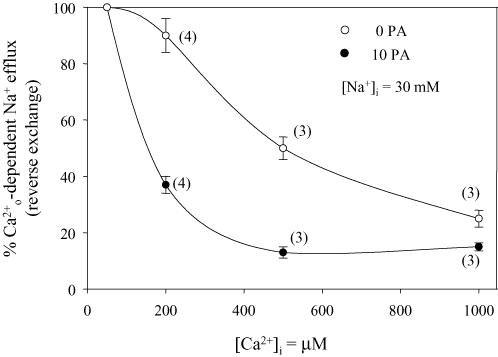
In a counter-transport mechanism, driving and driven species compete for the carrier at the same membrane side. A PA modulation of the Na+–Ca2+ exchange that preferentially increases the affinity for the transport sites leads to at least three predictions (their rationale is described in the Discussion): (i) inhibition by of the Na+ efflux-requiring modes of the exchanger (– and reverse – exchanges) is more pronounced in the presence than in the absence of PA; (ii) at non-limiting [Ca2+]i (5 μm), PA stimulation of the forward – exchange should be much smaller at high (200 mm) than at low (10 mm) [Na+]I; (iii) at high [Na+]i, PA stimulates the forward exchange even at [Ca2+]i as high as 500 μm. Figure 11 shows results of several experiments in which the reverse exchange fluxes at different [Ca2+]i were normalized to those seen at 50 μm . The figure shows that in the presence of PA the reverse – exchange is far more sensitive to inhibition by intracellular Ca2+.
Figure 11. Inhibition by intracellular Ca2+ of the reverse Na+–Ca2+ exchange in the absence and presence of PA.
Collected data from several axons (in parentheses) where the reverse Na+–Ca2+ exchange was followed as a function of the intracellular [Ca2+] in the absence (open symbols) and presence (filled symbols) of 10 mm PA. The concentrations of , all above saturation of the intracellular Ca2+ regulatory site, increased from 50 μm to 1000 μm. The points are the mean ± s.e.m. of fluxes normalized to the values obtained with 50 μm . Ordinate: percentage -dependent Na+ efflux (reverse exchange). Abscissa: [Ca2+]i (μm). Notice the marked increase in apparent affinity for in the presence of PA. See text for details.
The other two predictions were verified on the forward – exchange mode by comparing the results of experiments such as that shown in Fig. 12 with those of Fig. 1. In the left-hand side of Fig. 12, an axon dialysed with 5 μm and 200 mm exhibits a steady-state Ca2+ efflux of 22 fmol cm−2 s−1. In this case, 10 mm PA reversibly increases the flux but just by a factor of 3 (to 68 fmol cm2 s−1), confirming the prediction that, at 5 μm and high [Na+]i, PA stimulation is markedly diminished (compare with Fig. 1). The right-hand side of Fig. 12 shows that when [Ca2+]i is increased to 500 μm, a substantial rise in the efflux of Ca2+ to a value around 2200 fmol cm−2 s−1 is observed. Addition of 10 mm PA increases the flux to 7000 fmol cm−2 s−1 (a factor of 3.5). This confirms the prediction that, when [Na+]i is high, PA induces a sizable activation of the – exchange even at high [Ca2+]i (see Fig. 1). Finally, note that the fractional PA activations at 5 μm and 500 μm are similar (see Discussion).
Figure 12. Effect of high [Na+]i on the stimulation by PA of the forward Na+–Ca2+ exchange in axons dialysed with low and high [Ca2+]i.
Filled symbols correspond to the efflux of Ca2+ in the presence of 3 mm and no (forward exchange). Open symbols represent the efflux of Ca2+ in the absence of both extracellular Na+ and Ca2+ (unspecific and/or leak fluxes). The inclusion and/or withdrawal of intra- and extracellular ligands are indicated on top of the figure. The ligands and units of concentration are given on the left and the actual concentrations over the corresponding line. The pHi, [Na+]i and [Ca2+]i are given in the insert. Note: (i) Li+ was used as an inert Na+ replacement; and (ii) the fractional PA stimulation of Ca2+ efflux is similar at 5 μm and 500 μm . Ordinate: Ca2+ efflux (fmol cm−2 s−1). Abscissa: time (min). See text for details.
Discussion
PA stimulation of Na+–Ca2+ exchanger in squid nerve
ATP and PA stimulate Na+–Ca2+ exchange in squid nerve. Although the metabolic pathways related to their actions are unknown, it is clear that they have substantial differences (DiPolo & Beaugé 1999, 2002b). However, in both cases phosphorylation of some protein(s) must occur because, in dialysed squid axons and in isolated squid nerve membrane vesicles, ATP and PA stimulation disappear upon addition of an non-specific alkaline protein phosphatase (DiPolo & Beaugé 1999; DiPolo et al. 2000). The present results go even further in differentiating the effects of these two compounds. There is little doubt that the target of ATP modulation is the large intracellular loop. ATP promotes the binding of Ca2+ to its intracellular regulatory site; this binding is impaired by acting alone or in synergy with , and ATP antagonizes both (DiPolo & Beaugé 2002a,b). The regulatory sites and the regions related to inhibition are located within the large loop (Levitsky et al. 1994; He et al. 1998; Philipson & Nicoll 2000). There is no information regarding the place at which the protons act but, as they influence both Ca2+ and Na+ binding, it is not unlikely that these ligands attach to the same structure. This interpretation concurs with the observation that mutagenic deletion of most of the intracellular loop produces a deregulated mammalian heart Na+–Ca2+ exchanger (Philipson & Nicoll 2000). Chymotrypsin digestion also eliminates the ionic and ATP interactions, although there is no indication that it removes the entire loop. Nevertheless, the conclusion that the enzyme treatment destroys and/or disrupts some critical part(s) of the loop is inescapable because it deregulates the exchanger (Hilgemann 1990; Hilgemann et al. 1992b; He et al. 1998) and removes the epitope that interacts with a specific Ab (Fig. 8B). Where PA acts has not yet been definitively resolved but there some indicative information. First, PA increases the affinities of the intracellular cation transport sites, mainly for Ca2+, without effect on the maximal translocation rate. If the transport sites are at or near the alpha repeats, regions associated with the translocation pathways (Philipson & Nicoll 2000), it is obvious that they do no belong to the regulatory loop. By contrast, PA regulation remains seemingly intact after chymotrypsin digestion. It is possible that the overall PA effects occur at points away from the intracellular regulatory loop; this implies profound topological differences with ATP. Alternatively, if the loop is somehow involved in PA regulation it is obvious it does not share the same regions, or their particular conformations, with ATP. Otherwise, the chymotrypsin results remain unaccounted for. An unequivocal test of the hypothesis that PA acts outside the loop is to remove it through mutagenesis. However, this may have one insurmountable problem: metabolic regulation of the cloned squid Na+–Ca2+ exchanger expressed in an alien cell (Xenopus oocytes) is different from that in the native species. ATP regulation occurs via PIP2 formation and there is no stimulation by PA (He et al. 1998; see also DiPolo & Beaugé 1999, 2002a,b).
An integrated equilibrium model for ATP and PA modulation of the Na+–Ca2+ exchanger
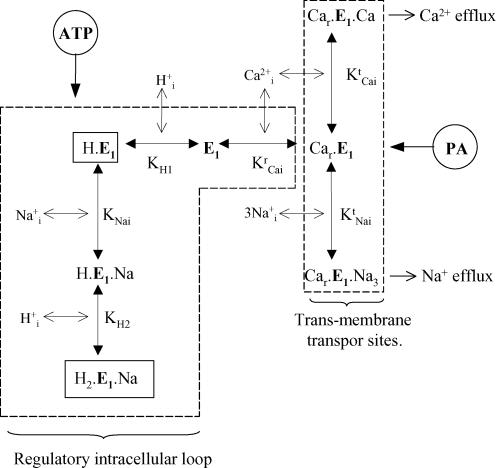
In considering different structures (and/or structural organization) and two different targets for ATP and PA modulations of the squid Na+–Ca2+ exchanger allows expanding our original model for ATP, , and interactions (DiPolo & Beaugé 2002a). This is depicted in Fig. 13 where, as before, only intracellular interactions have been taken into account. The scheme has the original features of ATP–ionic interaction on the large intracellular loop, which is considered here as the ‘ATP region’, together with a second zone, the ‘PA region’, which is related to the intracellular transporting sites for Na+ and Ca2+. Note that competition between the two transported cations does not necessarily mean that they compete for the same site(s); it could also be compatible with competition for the same form of the exchanger, in which the binding of one cation precludes the other from taking its place. The values of the equilibrium constants for , and Ca2+ binding to the ‘regulatory loop’ as well as the way in which they are influenced by ATP are exactly the same as those proposed before (DiPolo & Beaugé 2002a). The previous and new constants and equations related to PA are given in the Appendix. The ‘ATP region’ includes the effects of , , and ATP on the Na+–Ca2+ exchange activity through and competition, and synergism and ATP protection by antagonizing and interactions. E1 is the exchanger free of ligands. Car.E1 is the carrier with Ca2+ occupying its regulatory site. Cr.E1.Cat, and Cr.E1.Na3 are the carriers with Ca2+ bound to its regulatory site and with either 1 Ca2+ or 3 Na+ attached to their transport sites; i.e. ready to perform Ca2+ or Na+ translocation towards the outside of the cell. H.E1, H.E1.Na and H2.E1.Na are carriers binding H+ and Na+ at their inhibitory sites. ATP antagonizes inhibition by protons in the absence but, more conspicuously, in the presence of because the binding of Na+ to the carrier allows a second proton to bind. Protons reduce the apparent affinity of the intracellular Ca2+ regulatory site, whereas antagonizes inhibition. The binding of all ions is instantaneous (rapid random equilibrium) and the 3 bind simultaneously. Finally, the binding of Ca2+ to the regulatory site is essential for the binding of or to the transporting sites. MgATP through the phosphorylation of a yet unknown protein decreases the apparent affinities for and (for more details see DiPolo & Beaugé 2002a). Operationally, the ‘PA region’ embraces the CarE1, CarE1Cat and CarE1Na3 complexes, resulting in an increased affinity of the intracellular transport sites for Ca2+ and Na+. In the simulations, those increases were taken as 20 times for and just 50% for Na+. By contrast, PA does not affect the maximal rates of Ca2+ and Na+ translocations (Figs 1, 9 and 10).
Figure 13. Kinetic model showing the two separate metabolic pathways of regulation of the Na+–Ca2+ exchanger induced by ATP and PA.
The broken lines separate ATP and PA regulations. ATP modifies the Hi, and interactions with the intracellular regulatory loop. PA increases the affinity of the cation transport sites, particularly that for . See Discussion for details.
Several predictions of the model are illustrated in the six simulations shown in Fig. 14. The top two figures show that whereas PA increases the apparent affinity for in the forward – exchange by about 10-fold (Fig. 14A; note the log scale) it barely increases the apparent affinity for the in the -dependent – exchange mode (Fig. 14B; linear scale). This is in good agreement with the results described in Figs 9 and 10, indicating that PA drives the outward forward fluxes into the Ca2+ path (Ca2+ extrusion). Figure 14C is a simulation of the fractional PA stimulation of the forward – exchange as a function of the [Na+]i at low and high [Ca2+]i. Up to about 30 mm , the model predicts a dramatic effect of on PA stimulation, which is about 10-fold at 5 μm[Ca2+]i and only 50% at 500 μm . This concurs well with the results described in Figs 1 and 2 in which, at 10 mm , PA stimulation is about 15-fold at 5 μm[Ca2+]i and just 10–20% at 500 μm . By contrast, as [Na+]i concentration increases the fraction of efflux stimulated by PA decreases at low [Ca2+]i and increases at high [Ca2+]i, and at 200 mm the fractional PA stimulation is similar at low and high [Ca2+]i. The results in Fig. 12 agree reasonably well with that prediction. In addition, a marked increased in the affinity of the transport sites for Ca2+ over Na+ should make a more powerful inhibitor of the exchange modes that depend on the exit of Na+ though the carrier (– and reverse – exchanges). The predicted differential inhibition with and without PA is illustrated in Fig. 14D. The corresponding experimental results are shown in Fig. 11.
In dialysed squid axons the concentration dependence curve for inhibition of Ca2+ efflux through the Na+–Ca2+ exchanger has two components (DiPolo & Beaugé 2002a). At low the dominant component is related to the and interaction; in fact, at normal or acidic pH values the synergic and interaction becomes the only or the predominant fraction. At high there is a second component related to and competition for the transport sites. At alkaline pHi, or when ATP diminishes and synergism, competition for the transport sites prevails. The kinetic model proposed here anticipates that PA has no effect on ionic interactions located on the regulatory loop (Fig. 14E). In fact, at pH 8, where the and synergism is minimized, the simulation also shows that the fractional inhibition of Ca2+ efflux by should be slightly higher in the presence of PA (Fig. 14E). This is because as increases at constant [Ca2+]i, the even small PA-dependent increase in the affinity for becomes relevant. As a whole, the results summarized in Fig. 4 agree with those of Fig. 14E, i.e. PA does not affect the fractional inhibition by at pH 6.9 and pH 8.0. In the experiments at pH 8.0 there are no differences between absence and presence of PA (top of Fig. 4). This could be explained by the scatter of the data, the limited number of experimental points and the relatively narrow [Na+]i (from 0 to 50 mm). The simulation in Fig. 14F is in excellent agreement with the results of Fig. 5, which show a complete independence of the PA affinity from intracellular protons. This would be expected for a lack of interaction between PA regulation and the ionic interactions within the large intracellular loop.
Another consequence of the model is that an increase in [H+]i will reduce the absolute magnitude of the PA effect but the fractional stimulation will remain unchanged. Results not shown indicate that lowering the pHi to 6.9 markedly reduced the absolute magnitude of the PA-stimulated forward – exchange. However, pH 6.9 also drastically diminished the fraction of PA stimulation as compared with that at pH 7.3. Interestingly, this is not a direct effect of protons because addition of 3 mm MgATP, which strongly antagonizes inhibition of the exchanger (DiPolo & Beaugé 2002a), allows a large PA stimulation even at pH 6.9 (Fig. 5). The model proposed here does not foresee this result, and we have no explanation for it. Perhaps, and importantly, under certain conditions there is some type of interaction (‘cross-talking’) between several parts of the exchanger, in this case between the ‘ATP region’ and ‘PA region’.
Acknowledgments
This work was supported by grants from the USA National Science Foundation (IBN-9631107), Consejo Nacional de Investigaciones Científicas y Tecnólogicas (MCT-CONICIT-Venezuela S1-99000946, Proyecto de Grupo IVIC-UCV-2001), Fundación Polar (Venezuela), Fundaciencias-IVIC, Agencia Nacional de Promoción Científica y Tecnológica-FONCYT-Argentina (PICT99 05-05158) and Agencia Córdoba Ciencia, Argentina (181/01).
Appendix
Constants and equations
The rapid equilibrium solution of the proposed model included the following values for kinetic constants:
-
Dissociation constants in the ‘ATP region’, or large intracellular loop (DiPolo & Beaugé 2002a):
, true affinity for the regulatory site, 1 × 10⁻⁷m
KH10, true affinity for the first proton site, 1 × 10⁻⁹m
KH20, true affinity of the H.E1.Na2 for the second proton, 1 × 10⁻⁸m
KNai0, true affinity for of the H.E1 complex, 1 × 10⁻¹m
-
Dissociation constants for Ca2+ and Na+ interacting with their intracellular transport sites. From the data in Figs 9 and 10 in the absence of PA we took:
, true affinity for the transport site, 3 × 10⁻⁴m
, true affinity for each transport site, 5 × 10⁻²m
-
Other constants and equations
(a) Previous values (DiPolo & Beaugé 2002a):
n = number of Na+ ions binding to the H.E1 complex = 1
KATP, Km for the effects of MgATP, 200 μm
factor_ATP_KH1, decrease by ATP of the apparent affinity for binding to E1 = 2
factor_ATP_KH2, decrease by ATP of the apparent affinity for binding to H.E1.Na = 2
factor_ATP_KNai, decrease by ATP of the apparent affinity for binding to H.E1 = 10
KH1=KH10*(1 + (factor_ATP_KH1*([ATP]/(KATP+[ATP])))
KH2=KH20*(1 + (factor_ATP_KH2*([ATP]/(KATP+[ATP])))
KNai=KNai0*(1 + (factor_ATP_KNai*([ATP]/(KATP+[ATP])))
(b) For PA modulation:
KPA, Km for the effects of PA, 10 mm
factor_PA_, increase by PA of the apparent affinity for binding to CrE1= 20
factor_PA_, increase by PA of the apparent affinity for binding to CrE1= 0.5
=/(1 + (factor_PA_*([PA]/(KPA+[PA])))
=/(1 + (factor_PA_*([PA]/(KPA+[PA])))
It could be argued than one should consider that only fractions of and are affected by PA, fractions that we do not know. Therefore, under the limitations of an approximate model such as that proposed here, we feel that the introduction of further variables is not justified.
The fluxes are proportional to the relative concentration of the ‘active’ carrier form: bound to the regulatory site and either or bound to the transporting sites. In this way, the resulting equations have a common denominator (D) and different numerators for Ca2+ (numCa2+) and Na+ (numNa+) efflux. Thus,
numCa2+ = [Ca2+]/*;
numNa+ = [Ca2+]*[Na+]3/
D = 1 +[Ca2+]/(+[Ca2+]2)/*+[Na+]3/+[Ca2+]*[Na+]3/Kcr*Kn3+[H+]/KH1+[H+]*[Na+]n/(*KH1*Knin) +[H+]2* [Na+]n/KH1*KH2*KNain
References
- Aceto JF, Condrescu M, Kroupis C, Nelson H, Nicoll D, Philipson KD, Reeves JP. Cloning and expression of the bovine cardiac Na+/Ca2+ exchanger. Arch Biochem Biophys. 1992;298:553–560. doi: 10.1016/0003-9861(92)90449-7. [DOI] [PubMed] [Google Scholar]
- Asteggiano C, Berberián G, Beaugé L. Phosphatidylinositol-4,5-biphosphate bound to bovine cardiac Na/Ca exchanger displays a MgATP regulation similar to that of the exchange fluxes. Eur J Biochem. 2001;268:437–442. doi: 10.1046/j.1432-1033.2001.01906.x. [DOI] [PubMed] [Google Scholar]
- Beaugé L, Delgado D, Rojas H, Berberián G, DiPolo R. A nerve cytosolic factor is required for MgATP stimulation of a Na gradient-dependent Ca uptake in plasma membrane vesicles from squid optic nerve. Ann NY Acad Sci. 1996;779:208–216. doi: 10.1111/j.1749-6632.1996.tb44788.x. [DOI] [PubMed] [Google Scholar]
- Berberián G, Hidalgo C, DiPolo R, Beaugé L. ATP stimulation of Na/Ca exchange in cardiac sarcolemmal vesicles. Am J Physiol. 1998;43:C724–C733. doi: 10.1152/ajpcell.1998.274.3.C724. [DOI] [PubMed] [Google Scholar]
- Blaustein MP, Lederer WJ. Sodium/calcium exchange: its physiological implications. Physiol Rev. 1999;79:763–854. doi: 10.1152/physrev.1999.79.3.763. [DOI] [PubMed] [Google Scholar]
- DiPolo R, Beaugé L. Characterization of the reverse Na/Ca exchange in squid axons and its modulation by Cai and ATP. Cai-dependent Nai-Cao and Nai-Nao exchange modes. J Gen Physiol. 1987;90:505–525. doi: 10.1085/jgp.90.4.505. [DOI] [PMC free article] [PubMed] [Google Scholar]
- DiPolo R, Beaugé L. Phosphoarginine stimulation of Na+–Ca2+ exchange in squid axons. A new pathway for metabolic regulation. J Physiol. 1995;487:57–66. doi: 10.1113/jphysiol.1995.sp020861. [DOI] [PMC free article] [PubMed] [Google Scholar]
- DiPolo R, Beaugé L. Differential up-regulation of Na+–Ca2+ exchange by phosphoarginine and ATP in dialysed squid axons. J Physiol. 1998;507:737–747. doi: 10.1111/j.1469-7793.1998.737bs.x. [DOI] [PMC free article] [PubMed] [Google Scholar]
- DiPolo R, Beaugé L. Metabolic regulation of the Na/Ca exchange, the role of phosphorylation and dephosphorylation. Biochim Biophys Acta (Rev Biomembranes) 1999;1422:57–71. doi: 10.1016/s0005-2736(99)00002-4. [DOI] [PubMed] [Google Scholar]
- DiPolo R, Beaugé L. MgATP counteracts intracellular proton inhibition of the sodium–calcium exchange in dialysed squid axons. J Physiol. 2002a;539:791–893. doi: 10.1113/jphysiol.2001.013377. [DOI] [PMC free article] [PubMed] [Google Scholar]
- DiPolo R, Beaugé L. Ionic ligand interactions with the intracellular loop of the sodium–calcium exchanger. Modulation by ATP. Prog Biophysics Mol Biol. 2002b;80:43–67. doi: 10.1016/s0079-6107(02)00014-7. [DOI] [PubMed] [Google Scholar]
- DiPolo R, Berberián G, Beaugé L. In squid nerves intracellular Mg promotes deactivation of the ATP up-regulated Na/Ca exchanger. Am J Physiol. 2000;279:C1631–C1639. doi: 10.1152/ajpcell.2000.279.5.C1631. [DOI] [PubMed] [Google Scholar]
- DiPolo R, Berberián G, Delgado D, Rojas H, Beaugé L. A novel 13 kD cytoplasmic soluble protein is required for the nucleotide modulation of the Na/Ca exchange in squid nerve fibres. FEBS Lett. 1997;401:6–10. doi: 10.1016/s0014-5793(96)01416-0. [DOI] [PubMed] [Google Scholar]
- Doering AE, Lederer WJ. The action of Na+ as a cofactor in the inhibition by cytoplasmic protons of the cardiac Na+–Ca2+ exchanger in the guinea-pig. J Physiol. 1994;480:9–20. doi: 10.1113/jphysiol.1994.sp020336. [DOI] [PMC free article] [PubMed] [Google Scholar]
- Fujioka Y, Hiroe K, Matsuoka S. Regulation kinetics of the Na+–Ca2+ exchange in guinea-pig ventricular myocytes. J Physiol. 2000;529:611–623. [PubMed] [Google Scholar]
- He Z, Tong Q, Quednau BD, Philipson KD, Hilgemann DW. Cloning expression, and characterization of the squid Na+–Ca2+ exchanger (NCX-SQ1) J Gen Physiol. 1998;111:857–873. doi: 10.1085/jgp.111.6.857. [DOI] [PMC free article] [PubMed] [Google Scholar]
- Hilgemann DW. Regulation and deregulation of cardiac Na+–Ca2+ exchange in giant excised sarcolemmal membrane patches. Nature. 1990;344:242–245. doi: 10.1038/344242a0. [DOI] [PubMed] [Google Scholar]
- Hilgemann DW, Ball R. Regulation of cardiac Na+, Ca2+ exchange and KATP potassium channels by PIP2. Science. 1996;273:956–960. doi: 10.1126/science.273.5277.956. [DOI] [PubMed] [Google Scholar]
- Hilgemann DW, Collins A, Matsuoka S. Steady-state and dynamic propereties of cardiac sodium–calcium exchange. Secondary modulation by cytoplasmic calcium and ATP. J Gen Physiol. 1992a;100:933–961. doi: 10.1085/jgp.100.6.933. [DOI] [PMC free article] [PubMed] [Google Scholar]
- Hilgemann DW, Matsuoka S, Nagel GA, Collins A. Steady-state and dynamic properties of cardiac sodium-calcium exchanger. Sodium-dependent inactivation. J Gen Physiol. 1992b;100:905–932. doi: 10.1085/jgp.100.6.905. [DOI] [PMC free article] [PubMed] [Google Scholar]
- Levitsky DO, Nicoll DA, Philipson KD. Identification of the high affinity Ca2+-binding domain of the cardiac Na+–Ca2+ exchanger. J Biol Chem. 1994;269:22847–22852. [PubMed] [Google Scholar]
- Matsuoka S, Nicoll DA, Reilly RF, Hilgemann DW, Philipson KD. Initial localization of regions of the cardiac sarcolemmal Na+–Ca2+ exchanger. Proc Natl Acad Sci USA. 1993;90:3870–3874. doi: 10.1073/pnas.90.9.3870. [DOI] [PMC free article] [PubMed] [Google Scholar]
- Philipson KD, Longoni S, Ward R. Purification of the cardiac Na+-Ca2+ exchange protein. Biochem Biophys Acta. 1988;945:298–306. doi: 10.1016/0005-2736(88)90492-0. [DOI] [PubMed] [Google Scholar]
- Philipson KD, Nicoll DA. Sodium–calcium exchange: a molecular perspective. Annu Rev Physiol. 2000;62:111–133. doi: 10.1146/annurev.physiol.62.1.111. [DOI] [PubMed] [Google Scholar]
- Shigekawa M, Iwamoto TC. Cardiac Na+–Ca2+ exchange. Mol Pharmacol Aspects Circulation Res. 2001;88:864–876. doi: 10.1161/hh0901.090298. [DOI] [PubMed] [Google Scholar]


