Abstract
Single bronchiolar ciliary cells were isolated from rat lungs. The β2-adrenergic regulation of ciliary beat frequency (CBF) was studied using video-optical microscopy. Terbutaline (a β2-adrenergic agonist) increased CBF in a dose-dependent manner, and it also decreased the volume of the ciliary cells. These terbutaline actions were inhibited by a PKA inhibitor (H-89) and mimicked by forskolin, IBMX and DBcAMP. Ion transport inhibitors were used to isosmotically manipulate the volume of the terbutaline-stimulated bronchiolar ciliary cells. Amiloride (1 μm) and bumetanide (20 μm) potentiated cell shrinkage and the CBF increase, and they shifted the terbutaline dose–response curve to the lower-concentration side. Quinidine (500 μm), in contrast, increased cell volume and suppressed the CBF increase. Moreover, a KCl solution containing amiloride (1 μm) and strophanthidin (100 μm) increased cell volume and suppressed the CBF increase, and then the subsequent removal of either amiloride or strophanthidin decreased cell volume and further increased CBF. NPPB (10 μm) or glybenclamide (200 μm) had no effect on the action of terbutaline. Thus, in terbutaline-stimulated ciliary cells, cell shrinkage enhances the CBF increase; in contrast, cell swelling suppresses it. However, the results of direct manupulation of cell volume by applying osmotic stresses (hyperosmotic shrinkage or hyposmotic swelling) were the opposite of the findings of the isosmotic experiments: hyposmotic cell swelling enhanced the CBF increase, while isosmotic swelling suppressed it. These results suggest that isosmotic and non-isosmotic volume changes in terbutaline-stimulated bronchiolar ciliary cells may trigger different signalling pathways. In conclusion, terbutaline increases CBF and decreases the volume of rat bronchiolar ciliary cells via cAMP accumulation under isosmotic conditions, and the isosmotic cell shrinkage enhances the CBF increase by increasing cAMP sensitivity.
The ciliary beating of the tracheobronchial tree is one of the defence mechanisms of the respiratory tract and plays a key role in removing intrinsic or extrinsic irritants from the tracheobronchial tree (Wanner et al. 1996). Ciliary beat frequency (CBF) has been previously reported to be stimulated by many substances including β-adrenergic agonists (Verdugo et al. 1980; Tamaoki et al. 1989; Devalia et al. 1992, 1993; Wanner et al. 1996; Lieb et al. 2002).
The regulation of CBF has been studied extensively by many investigators using ciliated ependymal cells (Nguyen et al. 2001), ciliated nasal or tracheal epithelial cells (Wanner et al. 1996; Wong et al. 1998; Lieb et al. 2002; Mwimbi et al. 2002) and frog ciliated oesophageal cells (Zagoory et al. 2002); however, most of the studies were conducted using ciliated cells in primary culture (Wanner et al. 1996). In the present study, single ciliary cells were obtained from rat lungs, and the ciliary beatings of bronchiolar ciliary cells were observed by video-enhanced contrast (VEC) optical microscopy, which allowed the measurement of CBF from video frame images (30 Hz) and changes in cell morphology, such as cellular shape or size (Nakahari et al. 1990, 2002; Fujiwara et al. 1999; Hosoi et al. 2002). In the present study, we examined the effects of terbutaline (a specifically selective β2-adrenergic agonist) on the CBF of bronchiolar ciliary cells. In the course of the experiments, we found that terbutaline not only increased CBF but also decreased the volume of bronchiolar ciliary cells.
The isosmotic cell shrinkage coincides with the activation of cellular functions, such as fluid secretion in salivary acinar cells and sweat gland cells (Nakahari et al. 1990; Suzuki et al. 1991; Takemura et al. 1991; Foskett & Melvin, 1989), and fluid absorption in lung cells (Nakahari & Marunaka, 1996, 1997; Hosoi et al. 2002). Moreover, isosmotic cell shrinkage modulates some cellular functions such as exocytosis in antral mucous cells (Fujiwara et al. 1999), non-selective cation channels in fetal lung cells (Tohda et al. 1994; Marunaka et al. 1999), apoptosis (McCarthy & Cotter, 1997; Maeno et al. 2000), and Na+–H+ exchange (Robertson & Foskett, 1994; Shrode et al. 1997). The cell shrinkage of bronchiolar ciliary cells induced by terbutaline may also modulate CBF.
Our hypothesis is that cell volume modulates CBF in bronchiolar ciliary cells under isosmotic conditions; that is, cell shrinkage enhances terbutaline-stimulated CBF, and in contrast, cell swelling suppresses it. In the present study, we measured the CBF and volume of single bronchiolar ciliary cells using VEC microscopy, and the effects of cell volume on terbutaline-stimulated CBF were examined by altering the volume of single bronchiolar ciliary cells under isosmotic conditions. The goal of this study was to confirm that isosmotic cell shrinkage enhances the CBF in terbutaline-stimulated rat bronchiolar ciliary cells.
Methods
Solutions and chemicals
The control solution contained (mm): NaCl, 146; KCl, 4.5; MgCl2, 1; CaCl2, 1.5; NaHepes, 5; HHepes, 5; and glucose, 5. To prepare a Ca2+-free solution, CaCl2 was removed from the control solution, and to prepare an EGTA solution, EGTA (1 mm) was added to the Ca2+-free solution. The KCl solution contained (mm): KCl, 151.5; MgCl2, 1; CaCl2, 1.5; HHepes, 10; and glucose, 5. The pH values of all the solutions were adjusted to 7.4 by adding 1 m NaOH or 1 m KOH. In experiments applying osmotic stresses, solution II was used. Solution II contained (mm): NaCl, 121; KCl, 4.5; MgCl2, 1; CaCl2, 1.5; NaHepes, 5; HHepes, 5; glucose, 5 and saccharose, 50. To prepare a hyposmotic solution, 50 mm saccharose was removed from solution II, and to prepare a hyperosmotic solution, 50 mm saccharose was added to solution II. All the solutions were aerated with 100% O2 at 37°C. Terbutaline sulphate, quinidine, forskolin, 3-isobutyl-1-methylxanthine (IBMX), dibutyryladenosine 3′,5′-(cyclic)monophosphate (DBcAMP), heparin, elastase and bovine serum albumin (BSA) were obtained from Wako Pure Chemical Industries Ltd (Osaka, Japan), and amiloride, bumetanide, glybenclamide, 5-nitro-2-(3-phenylpropylamino) benzoic acid (NPPB) and strophanthidin were obtained from Sigma Chemical Co. (St Louis, MO, USA). Amiloride, bumetanide, forskolin and IBMX were dissolved in dimethyl sulfoxide (DMSO) as stock solutions. All the reagents were prepared to their final concentrations immediately before the experiments. The final concentration of DMSO in the medium never exceeded 0.1%, which had no effect on cell volume.
Cell preparations
Ciliary cells were obtained from the lungs of male rats (Slc:Wistar/ST 150–200 g from SLC Inc., Hamamatsu, Japan) according to previous reports (Dobbs et al. 1980; Hosoi et al. 2002). Briefly, the rats were anaesthetized by intraperitoneal injection of pentobarbital sodium (60–70 mg kg−1), and then heparinized (1000 units kg−1). The lungs were cleared of blood by perfusion, lavaged, and lungs with trachea and heart were removed from the rats en bloc. The EGTA solution was instilled into the lung cavity via the tracheal canula (7 ml) and then removed. This procedure was repeated four times. The fifth instillation was retained in the lung cavity for 15 min, and the lung cavity was lavaged five times with the Ca2+-free solution. Finally, the control solution containing elastase (0.15 mg ml−1) and DNase I (0.03 mg ml−1) was instilled into the lung cavity and the airway epithelium was digested for 30 min at 37°C. Following this incubation, the mediastinal structures (trachea and heart) were removed. The lobes of both lungs were placed in the control solution containing DNase I (0.08 mg ml−1) and 3% BSA, and then minced using fine forceps. The minced tissues were gently agitated for 5 min at 4°C and filtered through a nylon mesh with a pore size of 150 μm2. Cells were washed three times with centrifugation (160 g for 5 min), resuspended in the control solution (4°C), and then used in experiments within 3 h of preparation.
The experiments were approved by the Animal Research Committee of Osaka Medical College and the animals were cared for according to the guidelines of this committee.
CBF and cell volume measurement
Ciliary cells were placed on a coverslip precoated with Cell-Tak (Becton Dickinson Labware, Bedford, MA, USA). The coverslip with cells was set in a perfusion chamber (Takemura et al. 1991) mounted on the stage of a differential interference contrast (DIC) microscope connected to a video-enhanced contrast (VEC) system (ARGUS-10, Hamamatsu Photonics, Hamamatsu, Japan). We selected one single bronchiolar ciliary cell on the coverslip and its image was recorded continuously using a video recorder. Each experiment was performed using four to eight coverslips. The volume of the perfusion chamber was approximately 20 μl, and the rate of perfusion was 200 μl min−1. Experiments were carried out at 37°C. The focus of the microscope was frequently adjusted to observe the cells at their maximal diameter.
The video frame images recorded using a video recorder were stored in a computer via a video A/D converter. CBF was measured from 60–90 video frame images (30 frames s−1) as shown in Fig. 2B, and expressed in Hz. Before the experiments, CBF was measured every 30 s for 2 min and the averaged value for CBF for 2 min was used for unstimulated CBF (CBF0). CBF ratio was calculated (CBFt/CBF0). The subscript t indicates the time after the start of the experiment.
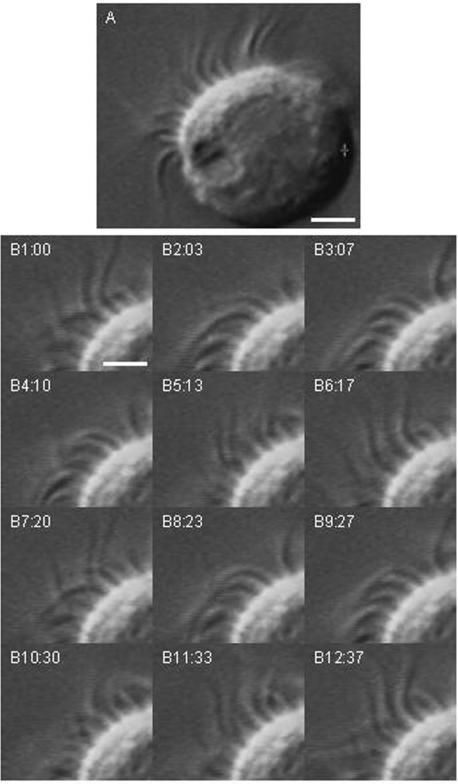
Figure 2. Video DIC images of a single ciliary cell.
A, the differential interference contrast (DIC) image shows beating cilia located on the apical surface of the cell. Each cilium movement was detected in the video image. Scale bar, 4 μm. B, frame images taken every 30–40 ms. Panels B1–B12 show two beating cycles (panels 1–6 and panels 7–11). The ciliary beat frequency of this cell is approximately 5.4 Hz. Scale bar, 2 μm.
To estimate cell volume, cell area was measured by tracing the outline of the cell on the video image at 20 s to 1 min intervals. The outline of a cell was traced three times and the mean value was used for calculation. Cells were first perfused with the control solution for 2 min, and the mean value from five images measured every 30 s in the first 2 min was used as the control value (A0). The variation in the traced areas of the five images in the first 2 min was less than 1.5%. The relative volume of a ciliary cell was expressed as V/V0= (A/A0)1.5, where V is the volume, A is the area, and subscript 0 indicates the control value. The volume changes of a ciliary cell were estimated based on the assumption that the volume changed to the same extent in all three dimensions. This method has been described in detail previously (Foskett & Melvin, 1989; Suzuki et al. 1991). The number of cells used for one experiment is shown as n and the V/V0 values calculated are presented as means ± s.e.m.
The statistical significance of differences between the mean values was assessed using ANOVA. Differences were considered significant at P < 0.05.
Histological examination
The lungs were fixed in a 150 mm phosphate-buffered solution containing 10% formalin for 1 day, and then dehydrated and embedded in paraffin according to a standard protocol. The sections were then stained with haematoxylin–eosin (HE).
Results
Micrographs and video images of ciliary cells
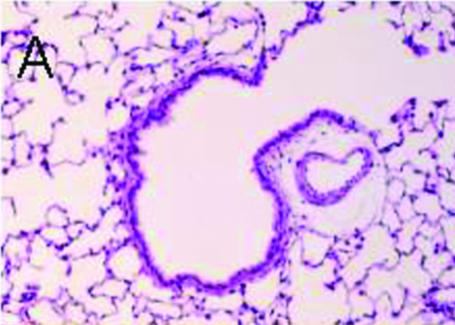
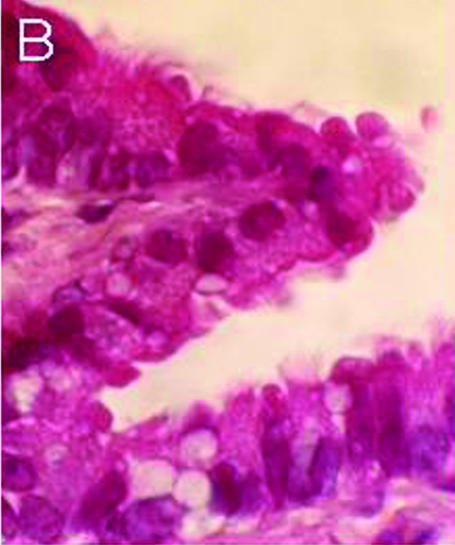
Figure 1 shows the light micrographs of a rat lung section stained with HE. Ciliary cells line the luminal surface of the terminal bronchiole (Fig. 1A). A high-magnification view of the terminal bronchiole shows cilia lining the apical membrane of bronchiolar epithelial cells (Fig. 1B).
Figure 1. Histological examination of rat lung (HE staining).
A, low magnification. Terminal bronchiole and alveolar cavity. The terminal bronchiolar surface is lined with ciliary cells, but not the alveolar surface. B, high magnification. Ciliary cells with cilia on the apical surface line the luminal surface of the terminal bronchiole.
Figure 2 shows video images of a single bronchiolar ciliary cell obtained by elastase treatment. The beating cilia were observed on one side of the single bronchiolar ciliary cell, that is, the apical surface (Fig. 2A). From a morphological viewpoint, single bronchiolar cells after elastase treatment are likely to maintain cellular polarity (Figs 1 and 2). Figure 2B shows 12 consecutive images taken at 30–40 ms intervals. Panels B1–6 and B7–11 show two beating cycles and the CBF was 5.4 Hz in this case. Thus, we could measure CBF in single ciliary cells. In unstimulated bronchiolar ciliary cells, the CBFs were 3–10 Hz. We used ciliary cells with CBFs of 5–8 Hz.
Terbutaline stimulation and CBF
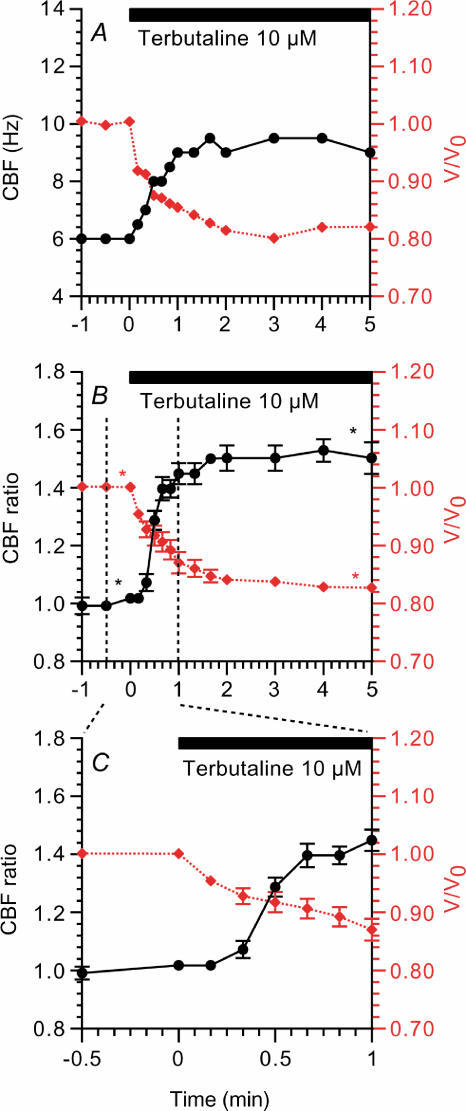
Terbutaline (10 μm) increased CBF and decreased the volume of the bronchiolar ciliary cells. Figure 3A shows a typical response of CBF and cell volume to 10 μm terbutaline. In this case, CBF and the relative cell volume (V/V0) before stimulation were 6 Hz and 1.0, and 3 min after stimulation were 9.5 Hz and 0.8, respectively. Figure 3B shows the CBF ratio and V/V0 during 10 μm terbutaline stimulation obtained from seven experiments. The CBF ratio and V/V0 before stimulation were 1.01 ± 0.00 and 1.00 ± 0.01 and 3 min after stimulation were 1.50 ± 0.04 and 0.89 ± 0.01, respectively. The CBF ratios and V/V0 values in the first minute of 10 μm terbutaline stimulation are shown in Fig. 3C. Cell shrinkage started within 10 s of terbutaline stimulation, while the CBF increase started 20 s after terbutaline stimulation. Thus, cell shrinkage preceded the CBF increase (Fig. 3C).
Figure 3. Changes in CBF and cell volume during 10 μm terbutaline stimulation.
A, a typical response of ciliary beat frequency (CBF, left y-axis, •) and relative cell volume (V/V0, right y-axis, (⋄ (red)). Terbutaline stimulation (period of stimulation shown by horizontal bar) increased CBF and decreased cell volume immediately. B, CBF ratios (CBF/CBF0 (•)) and V/V0 values (⋄ (red)) during terbutaline stimulation in seven experiments. C, the CBF ratios and V/V0 values in the first minute of terbutaline stimulation. Cell shrinkage preceded the CBF increase. *Paired values significantly different from those at time 0 (P < 0.05).
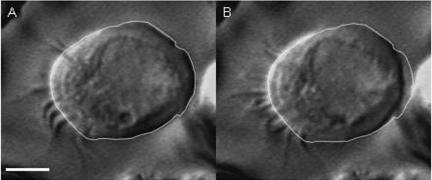
A video frame image of a single brochiolar ciliary cell before terbutaline stimulation is shown in Fig. 4A, in which the outline of the cell is traced. Figure 4B shows the video frame image 2 min after terbutaline (10 μm) stimulation, and the line shows the outline of the cell before terbutaline stimulation as obtained in Fig. 4A. Terbutaline-induced cell shrinkage is shown in Fig. 4B. V/V0 in Fig. 4B was 0.84.
Figure 4. Video DIC images of a single ciliary cell.
A, unstimulated ciliary cell. The outline of the cell was traced. B, ciliary cell 2 min after terbutaline (10 μm) stimulation. The outline of the unstimulated cell (A) was superimposed on the cell in B, and the terbutaline-induced cell shrinkage is clearly shown (V/V0= 0.84). Scale bar, 5 μm.
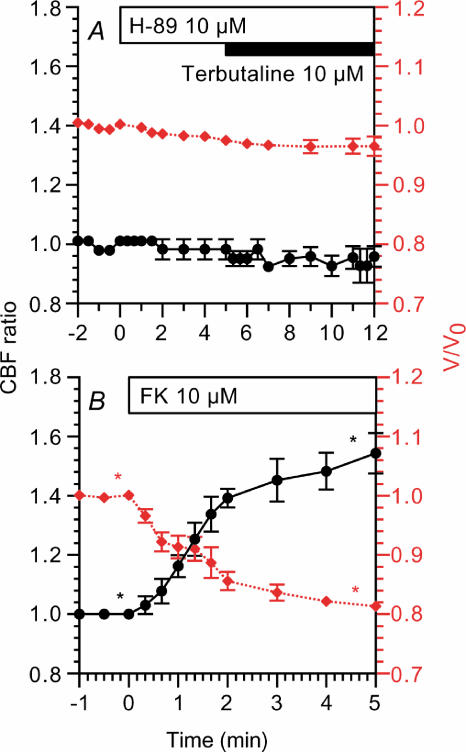
Figure 5A shows the effects of 10 μm H-89 (an inhibitor of PKA). The addition of H-89 did not change the CBF ratio (0.98 ± 0.03, n = 4, 5 min after addition), although it decreased V/V0 slightly (0.98 ± 0.00, 5 min after addition). The subsequent stimulation with 10 μm terbutaline did not induce any increase in CBF ratio (0.95 ± 0.03, 5 min after stimulation) and V/V0 (0.97 ± 0.02, 5 min after stimulation). Thus, the effects of terbutaline were inhibited by H-89 (10 μm). Moreover, forskolin (10 μm) increased CBF and decreased V/V0 (Fig. 5B). The CBF ratio and V/V0 5 min after the addition of forskolin were 1.54 ± 0.06 and 0.81 ± 0.01 (n = 3), respectively.
Figure 5. Effects of H-89 (a PKA inhibitor) and forskolin.
CBF ratios (•) are plotted on the left y-axis and V/V0 values (⋄ (red)) are on the right y-axis. A, H-89 did not induce any changes in CBF, although it decreased V/V0 slightly in unstimulated cells. The subsequent stimulation with terbutaline did not induce any changes in CBF or V/V0. B, 10 μm forskolin (FK) decreased CBF and V/V0 to an extent comparable with 10 μm terbutaline. *Paired values significantly different from those at time 0 (P < 0.05).
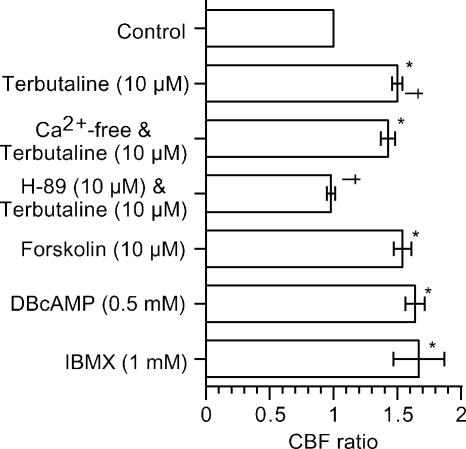
The effects of terbutaline and cAMP on CBF ratio (5 min after addition of the agonists) are summarized in Fig. 6. The increase in CBF during terbutaline stimulation was not affected by the Ca2+-free solution, while it was inhibited by H-89 (10 μm). Forskolin (10 μm), DBcAMP (0.5 mm) and IBMX (1 mm) increased CBF to the same extent as terbutaline (10 μm). These observations indicate that terbutaline increases the CBF mediated by cAMP accumulation in rat bronchiolar ciliary cells.
Figure 6. Effects of cAMP accumulation on CBF.
Sustained CBFs (5 min after the start of stimulation) during various stimulations were plotted. *Significantly different from control value (P < 0.05). †Paired values significantly different (P < 0.05).
Ion transport inhibitors and CBF
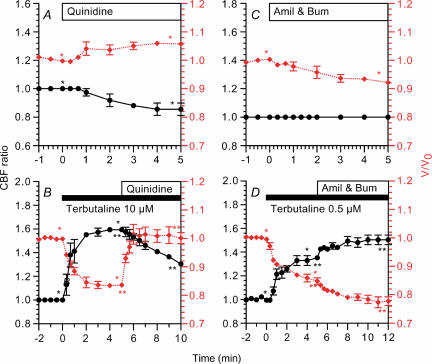
The effects of quinidine, a K+ channel inhibitor, were examined in both unstimulated and terbutaline-stimulated ciliary cells (Fig. 7A and B). Quinidine (500 μm) increased V/V0 (1.06 ± 0.01, n = 5, 5 min after addition) and decreased the CBF ratio (0.86 ± 0.04, 5 min after addition) in unstimulated cells (Fig. 7A). Stimulation with 10 μm terbutaline increased the CBF ratio (1.59 ± 0.02, n = 4, 5 min after stimulation) and decreased V/V0 (0.83 ± 0.01, 5 min after stimulation), and the subsequent addition of 500 μm quinidine increased V/V0 immediately (1.01 ± 0.03, 1 min after addition) and decreased the CBF ratio gradually (1.30 ± 0.01, 5 min after addition) (Fig. 7B).
Figure 7. Changes in CBF and cell volume induced by inhibition of K+ channels (quinidine) or Na+ entry pathways (amiloride and bumetanide).
CBF ratios (•) are plotted on the left y-axis and V/V0 values (⋄ (red)) are on the right y-axis. A, quinidine (500 μm) decreased CBF ratio and increased V/V0 in unstimulated bronchiolar ciliary cells. B, in 10 μm terbutaline-stimulated cells, the subsequent addition of quinidine (500 μm) increased V/V0 immediately and decreased CBF gradually. C, amiloride (Amil) and 20 μm bumetanide (Bum) decreased V/V0 gradually, but did not change CBF in unstimulated cells. D, in 0.5 μm terbutaline-stimulated cells, the subsequent addition of both 1 μm amiloride and 20 μm bumetanide enhanced cell shrinkage and CBF increase. *,**Paired values significantly different (P < 0.05).
The effects of amiloride (1 μm), a Na+ channel inhibitor, and bumetanide (20 μm), an inhibitor of Na+–K+–2Cl− cotransport, on CBF ratio and V/V0 were also examined (Fig. 7C and D). In unstimulated cells, the addition of amiloride and bumetanide did not induce any change in CBF ratio (1.00 ± 0.00, n = 3, 5 min after addition), although they gradually decreased V/V0 (0.92 ± 0.01, 5 min after addition) (Fig. 7C). Stimulation with terbutaline (0.5 μm) increased the CBF ratio (1.35 ± 0.02, n = 5, 5 min after stimulation) and decreased V/V0 (0.85 ± 0.01, 5 min after stimulation), and the subsequent addition of both amiloride (1 μm) and bumetanide (20 μm) induced a further increase in CBF ratio (1.50 ± 0.04, 5 min after addition) and a further decrease in V/V0 (0.78 ± 0.02, 5 min after addition) (Fig. 7D). These observations suggest that cell shrinkage enhances terbutaline-stimulated CBF, and in contrast, cell swelling decreases it.
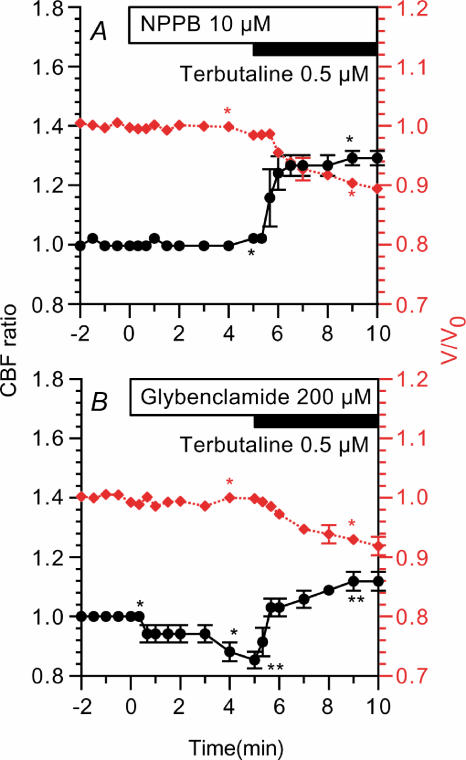
The effects of Cl− channel inhibitors were examined using NPPB (10 μm) and glybenclamide (200 μm). Cells were treated with NPPB (10 μm, an inhibitor of Cl− channels) for 5 min prior to terbutaline stimulation (Fig. 8A). NPPB (10 μm) did not induce any change in CBF ratio or V/V0 in unstimulated cells. Terbutaline (0.5 μm) increased the CBF ratio (1.29 ± 0.01, n = 3, 5 min after stimulation) and decreased V/V0 (0.90 ± 0.01, 5 min after stimulation). Cells were also treated with glybenclamide (200 μm) (Fig. 8B). Glybenclamide (200 μm) did not induce any change in V/V0; however, it decreased the CBF ratio gradually (0.85 ± 0.03, n = 3, 5 min after addition). Terbutaline (0.5 μm) increased the CBF ratio (1.12 ± 0.03, 5 min after addition) and decreased V/V0 (0.91 ± 0.02, 5 min after addition). Thus, NPPB and glybenclamide did not inhibit terbutaline actions, although the cell shrinkage and CBF increase induced by 0.5 μm terbutaline were slightly smaller than those in the absence of Cl− channels blockers (Figs 7D and 8).
Figure 8. Effects of Cl− channel blockers.
CBF ratios (•) are plotted on the left y-axis and V/V0 values (⋄ (red)) are on the right y-axis. A, NPPB (10 μm) did not induce any changes in CBF or volume of the unstimulated cells. Terbutaline (0.5 μm) increased CBF and decreased cell volume. B, glybenclamide (200 μm) did not induce any changes in cell volume but decreased CBF slightly. Terbutaline (0.5 μm) increased CBF and decreased cell volume. *Paired values significantly different (P < 0.05).
Isosmotic cell shrinkage and CBF
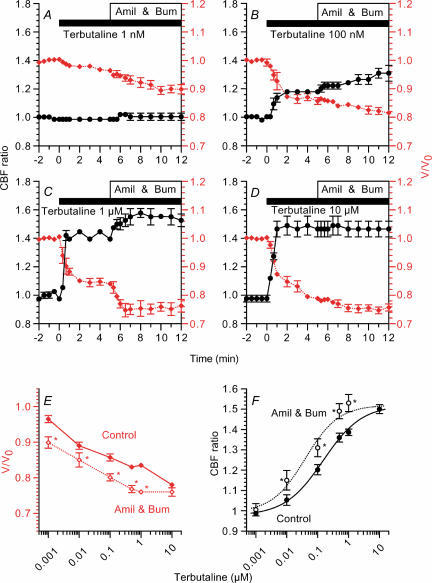
The effects of dose of terbutaline on CBF were examined in the absence and presence of amiloride (1 μm) and bumetanide (20 μm). Stimulation with 1 nm terbutaline did not induce any increase in CBF ratio (0.99 ± 0.01, n = 5, 5 min after stimulation), while it decreased V/V0 slightly (0.96 ± 0.02, 5 min after stimulation). The subsequent addition of amiloride and bumetanide induced no increase in CBF ratio (1.00 ± 0.03, 5 min after addition), whereas it decreased V/V0 (0.90 ± 0.02, 5 min after addition) (Fig. 9A). Stimulation with 100 nm and 1 μm terbutaline (Fig. 9B and C) increased CBF and decreased cell volume, and the subsequent addition of amiloride and bumetanide further increased CBF and further decreased cell volume gradually. The CBF ratio and V/V0 5 min after 1 μm terbutaline stimulation were 1.40 ± 0.00 and 0.84 ± 0.01 (n = 5) and 5 min after the addition of amiloride and bumetanide were 1.53 ± 0.04 and 0.76 ± 0.02, respectively. Stimulation with 10 μm terbutaline (Fig. 9D) also increased the CBF ratio (1.50 ± 0.02, n = 7, 5 min after stimulation) and decreased V/V0 (0.78 ± 0.01, 5 min after stimulation). However, the subsequent addition of amiloride and bumetanide did not increase the CBF ratio (1.50 ± 0.02, 5 min after addition), although it decreased V/V0 slightly (0.76 ± 0.01, 5 min after addition).
Figure 9. Dose effects of terbutaline on CBF and V/V0.
CBF ratios (•) are plotted on the left y-axis and V/V0 values (⋄ (red)) are on the right y-axis. Cells were first stimulated with terbutaline, and then 1 μm amiloride (Amil) and 20 μm bumetanide (Bum) were added. Concentrations of terbutaline used were 1 nm (A), 100 nm (B), 1 μm (C), and 10 μm (D). Terbutaline increased CBF and decreased V/V0 in a dose-dependent manner. The subsequent addition of amiloride and bumetanide increased cell shrinkage and CBF during stimulation with concentrations of terbutaline from 1 nm to 1 μm. However, amiloride and bumetanide did not increase V/V0 or CBF during stimulation with 10 μm terbutaline. E and F, V/V0 and CBF values were plotted against terbutaline concentration 5 min after terbutaline stimulation (Control) and also 5 min after the subsequent addition of 1 μm amiloride and 20 μm bumetanide (Amil & Bum). Terbutaline induced cell shrinkage and CBF increase in a dose-dependent manner. The subsequent addition of bumetanide and amiloride lowered the dose–response curve of cell shrinkage (E) and the dose–response curve of CBF increase was shifted to the left (F). In F, the half-maximum concentrations were 0.15 μm in the control experiments and 0.04 μm in the presence of amiloride and bumetanide. *Significantly different from control values (P < 0.05).
The V/V0 values and CBF ratios before and after the addition of amiloride (1 μm) and bumetanide (20 μm) were plotted against terbutaline concentration (Fig. 9E and F). The cell shrinkage and CBF increase depended on terbutaline concentration; V/V0 decreased and CBF ratio increased with increasing terbutaline concentration. The subsequent addition of amiloride and bumetanide shifted the terbutaline dose–response curve of V/V0 downwards (Fig. 9E). Moreover, it shifted the terbutaline dose–response curve of the CBF ratio to the lower-concentration side (Fig. 9F), and the half-maximum concentrations (EC50 values) of terbutaline before and after the addition of amiloride and bumetanide were approximately 0.15 μm and 0.04 μm, respectively.
Isosmotic cell swelling and CBF
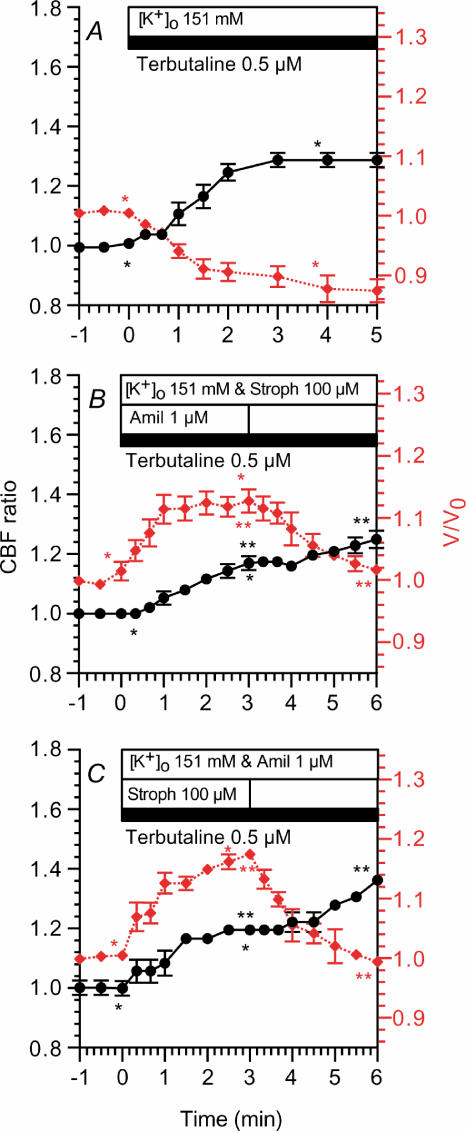
Bronchiolar ciliary cells were first perfused with the control solution and then the perfusion solution was switched to the KCl solution, which contained 0.5 μm terbutaline (Fig. 10A). Stimulation with terbutaline (0.5 μm) increased the CBF ratio (1.29 ± 0.02, n = 4, 3 min after stimulation) and decreased V/V0 (0.90 ± 0.02, 3 min after stimulation). Thus, terbutaline (0.5 μm) increased the CBF ratio and decreased V/V0 during perfusion with the KCl solution as well as the control solution (Fig. 7D). This terbutaline-induced cell shrinkage appears to be caused by Na+ extrusion via Na+ channels and the Na+ pump in the bronchiolar ciliary cells perfused with the KCl solution.
Figure 10. Effects of cell swelling on CBF.
CBF ratios (•) are plotted on the left y-axis and V/V0 values (⋄ (red)) are on the right y-axis. A, infusion of KCl solution containing 0.5 μm terbutaline increased CBF and decreased cell volume. B, infusion of KCl solution containing 1 μm amiloride, 100 μm strophanthidin and 0.5 μm terbutaline. Stimulation with 0.5 μm terbutaline increased V/V0 and CBF to a plateau within 2.5 min. The subsequent removal of amiloride decreased V/V0 gradually and increased CBF gradually. C, in these experiments, strophanthidine, instead of amiloride (B), was removed subsequently. Results obtained were similar to those shown in A. *,**Paired values significantly different (P < 0.05).
In Fig. 10B, the perfusion solution was switched to the KCl solution, which contained 1 μm amiloride, 100 μm strophanthidin and 0.5 μm terbutaline, to block Na+ channels and inhibit the Na+ pump. Stimulation with 0.5 μm terbutaline increased V/V0 to a plateau within 3 min (1.13 ± 0.02, n = 4), and it also increased the CBF ratio to a plateau within 3 min (1.17 ± 0.02); the subsequent removal of amiloride decreased V/V0 (1.02 ± 0.00, 3 min after the removal) and increased CBF gradually (1.25 ± 0.03, 3 min after removal) (Fig. 10B). In Fig. 10C, strophanthidin was removed instead of amiloride. The subsequent removal of strophanthidin also decreased V/V0 and increased the CBF ratio gradually (Fig. 10C). The CBF ratio and V/V0 3 min after the terbutaline stimulation were 1.19 ± 0.01 and 1.17 ± 0.01 (n = 3), and those 3 min after the removal of strophanthidin were 1.36 ± 0.02 and 0.99 ± 0.01, respectively.
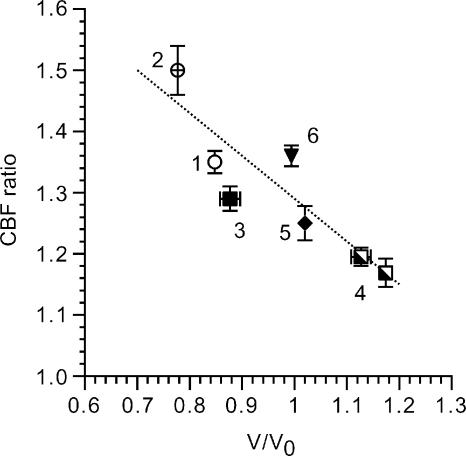
The relationship between the CBF ratio and V/V0 under isosmotic conditions is summarized in Fig. 11, in which the CBF ratio during 0.5 μm terbutaline stimulation was plotted against V/V0. As V/V0 decreased, the CBF ratio increased as shown in Fig. 10; cell shrinkage increased the terbutaline-stimulated CBF, and in contrast, cell swelling suppressed it.
Figure 11. Relationship between CBF ratio and V/V0 during stimulation with 0.5 μm terbutaline.
The numbers by the symbols indicate that the experiments 1 and 2 were NaCl experiments (Fig. 7D) and 3, 4, 5 and 6 were KCl experiments (Fig. 10). 1, terbutaline (0.5 μm) alone. 2, subsequent addition of 1 μm amiloride and 20 μm bumetanide. 3, terbutaline (0.5 μm) alone (KCl experiments in the absence of 1 μm amiloride and 100 μm strophanthidin) (Fig. 10A). 4, KCl experiments in the presence of 1 μm amiloride and 100 μm strophanthidin (Fig. 10B and C). 5, the subsequent removal of 1 μm amiloride (Fig. 10B). 6, the subsequent removal of 100 μm strophanthidin (Fig. 10C). The terbutaline-stimulated CBF ratio increases with decreasing V/V0 (r = 0.91).
Osmotic stress and CBF
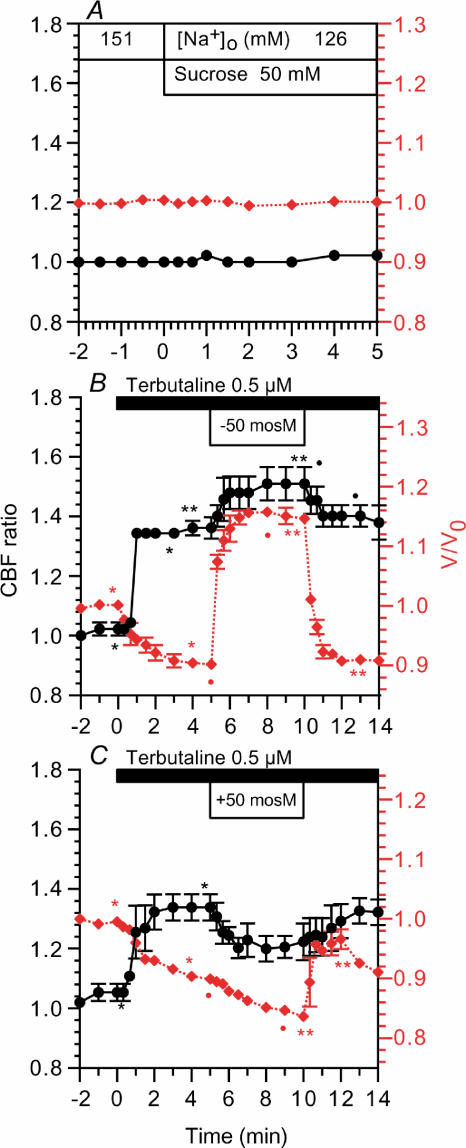
The effects of osmotic shrinkage or swelling on CBF were examined. A hyposmotic or a hyperosmotic stress was applied by removing 50 mm (suchrose) saccharose from solution II or by adding 50 mm saccharose to solution II, keeping the other ionic compositions constant. Switching from the control solution to solution II induced no change in CBF or V/V0 (Fig. 12A). Cells were perfused with solution II prior to 0.5 μm terbutaline stimulation. Terbutaline (0.5 μm) increased CBF and decreased V/V0. The application of hyposmotic stress (–50 mosmol l−1) increased V/V0 to a new plateau within 2 min (from 0.90 to 1.16), and it increased CBF. The CBF ratios before and 5 min after hyposmotic stress were 1.36 ± 0.04 (n = 3) and 1.50 ± 0.06. Upon removing the hyposmotic stress, V/V0 and the CBF ratio returned to their previous levels (Fig. 12B). The application of hyperosmotic stress (+50 mosmol l−1) induced further cell shrinkage. V/V0 values before and 5 min after the hyperosmotic stress were 0.90 ± 0.00 and 0.83 ± 0.00 (n = 3). However, hyperosmotic stress decreased CBF. The CBF ratios before and 5 min after hyperosmotic stress were 1.34 ± 0.04 (n = 3) and 1.22 ± 0.06. Upon removing the hyperosmotic stress, V/V0 increased rapidly and then decreased gradually. The CBF ratio increased to its previous level gradually (Fig. 12C). Upon returning to isosmotic conditions (relative hyposmotic stress), the bronchiolar ciliary cells exhibited a regulatory volume decrease.
Figure 12. Osmotic stress.
CBF ratios (•) are plotted on the left y-axis and V/V0 values (⋄ (red)) are on the right y-axis. A, the perfusion solution was switched from the control solution to solution II, which did not induce any change in CBF or V/V0. B, the application of hyposmotic stress (–50 mosmol l−1) increased V/V0 rapidly and enhanced the CBF increase. On returning to isosmotic conditions, CBF and V/V0 recovered to their previous levels. C, the application of hyperosmotic stress (+50 mosmol l−1) enhanced cell shrinkage and inhibited the CBF increase. On returning to isosmotic conditions, CBF returned to its previous level, and V/V0 increased rapidly and then decreased to its previous level. *,**Paired values significantly different (P < 0.05).
The application of osmotic stresses (±50 mosmol l−1) in terbutaline-stimulated bronchiolar ciliary cells demonstrated that hyperosmotic stress (cell shrinkage) suppresses the CBF increase and hyposmotic stress (cell swelling) enhances it. Thus, the results of direct manipulation of cell volume by changing the osmolarity were the opposite of the findings of the isosmotic experiments: hyposmotic cell swelling enhanced the terbutaline-stimulated CBF increase, while isosmotic cell swelling suppressed it (hyperosmotic cell shrinkage suppressed the terbutaline-stimulated CBF increase, while isosmotic shrinkage enhanced it).
Discussion
The regulations of CBF in airway epithelia have been studied extensively by many investigators (Wanner et al. 1996; Wong et al. 1998; Lieb et al. 2002; Mwimbi et al. 2002). However, most of the studies have been carried out using tracheal or nasal mucosal ciliary cells in primary culture (Wanner et al. 1996). In the present study, single-bronchiolar ciliary cells were obtained from rat lungs by elastase treatment, and CBF and cell volume were measured from video images using VEC microscopy. This is the first report measuring CBF and cell volume using freshly isolated single bronchiolar ciliary cells.
Isolated epithelial cells may loose their polarity, which may change their function. The light micrographs of the lung sections show that cilia only exist on the apical membrane (Fig. 1). The video images of single ciliary cells (Figs 2 and 4) also show that cilia are only present on one side of the isolated bronchiolar ciliary cells, probably the apical side. Reuss (2001) reported that apical ion channel proteins and an apical glycoprotein remain in the apical membrane of isolated polarized gallbladder epithelial cells, while they are distributed across the entire surface of non-polarized cells, and the freeze-fracture studies demonstrated that apical structures, that is, the microvilli and folds, still existed only in the plasma membrane of the small apical domain in the isolated polarized gallbladder cells (Reuss, 2001). Thus, from a morphological viewpoint, the apical structures, that is, the beating cilia, remain in the apical membrane of bronchiolar ciliary cells after elastase treatment, suggesting that the single bronchiolar ciliary cells maintain their polarity. Moreover, when we measured the bronchiolar CBF of lung slices (without elastase treatment) using the same experimental setup (data not shown), terbutaline increased the CBF of bronchiolar ciliary cells in the lung slices to a rate similar to that of the single bronchiolar ciliary cells. The freshly isolated bronchiolar ciliary cells remained dependence of CBF on terbutaline. These observations suggest that cellular functions, particularly with regard to the polarity of the cells and the CBF response to terbutaline, are maintained in the freshly isolated single ciliary cells used in the present experiments.
The CBF of unstimulated bronchiolar ciliary cells was in the 3–10 Hz range, and the maximum CBF during terbutaline stimulation was approximately 12 Hz. The CBF of the single bronchiolar ciliary cells was similar to that reported in tracheal ciliary cells in primary culture. Since the National TV Standards Committee (NTSC) video frame rate is 30 Hz, we are able to measure CBF using standard video equipment, and also to observe the shape of single bronchiolar ciliary cells on the video monitor.
In the present study, terbutaline increased the CBF of single bronchiolar ciliary cells, which was mimicked by forskolin, IBMX and DBcAMP, and inhibited by a PKA inhibitor (H-89). However, the terbutaline-stimulated CBF increase was not affected by the Ca2+-free solution or KCl solution, which decreases Ca2+ entry. These suggest that terbutaline increases the CBF mediated via cAMP accumulation in bronchiolar ciliary cells.
On the other hand, terbutaline decreased cell volume, as did forskolin. However, terbutaline increased cell volume in the presence of quinidine (a K+ channel blocker). This suggests that terbutaline activates K+ channels mediated via cAMP accumulation in bronchiolar ciliary cells. A similar isosmotic cell shrinkage induced by K+ channel activation during terbutaline stimulation was reported in fetal lung cells (Nakahari & Marunaka, 1996, 1997) and rat alveolar type II cells (Hosoi et al. 2002).
We also examined the effects of Cl− channel inhibitors (NPPB and glybenclamide) on CBF and cell volume. In unstimulated ciliary cells, NPPB had no effects on CBF or cell volume. Glybenclamide also had no effects on cell volume but it decreased CBF slightly. Glybenclamide may have some adverse effects on CBF. However, NPPB or glybenclamide slightly suppressed the cell shrinkage induced by terbutaline, although it did not inhibit the CBF increase induced by terbutaline. Thus, terbutaline activated Cl− channels in bronchiolar ciliary cells, which were partially inhibited by NPPB or glybenclamide partially. Since the complete inhibition of Cl− channels is unlikely to induce cell shrinkage, most of the Cl− channels of the bronchiolar ciliary cells seem to be insensitive to NPPB or glybenclamide. Based on these observations, terbutaline stimulates KCl release via the activation of K+ channels and Cl− channels, which decreases the volume of bronchiolar ciliary cells.
Moreover, amiloride (Na+ channel inhibitor) as well as bumetanide (Na+–K+–2Cl− cotransport inhibitor) decreased cell volume, suggesting that bronchiolar ciliary cells have Na+ channels and Na+–K+–2Cl− cotransport as Na+ entry pathways. Na+–H+ exchange is also a well-known Na+ entry pathway. However, the present experiments were performed using a -free solution, in which the activity of the Na+–H+ exchanger is negligible. Moreover, methylisobutyl amiloride (10 μm, an inhibitor of the Na+–H+ exchanger) does not induce any change in cell volume. A low amiloride concentration, such as 1 μm, is known to inhibit only Na+ channels selectively, although a high concentration of amiloride, such as 100 μm, inhibits Na+–H+ exchange. These observations suggest that Na+ enters cells via the amiloride-blockable Na+-permeable channels and bumetanide-sensitive Na+–K+–2Cl− cotransport under the present experimental conditions.
When Na+ entry is suppressed by inhibitors of Na+ entry pathways and the K+ released maintained, the amount of K+ released becomes larger than that of Na+ entering, which decreases cell volume. Amiloride (1 μm) has been reported to decrease the volume of lung cells (Nakahari & Marunaka, 1996, 1997; Hosoi et al. 2002). A similar cell shrinkage occurred in bronchiolar ciliary cells upon the addition of both amiloride and bumetanide.
In terbutaline-stimulated bronchiolar ciliary cells, the KCl solution alone decreased cell volume, and the KCl solution containing either amiloride or strophanthidin still decreased cell volume, although the KCl solution containing both amiloride and strophanthidin increased cell volume. These results suggest that bronchiolar ciliary cells may maintain a high intracellular Na+ concentration during perfusion with the control solution and high activities of Na+ extrusion mechanisms during perfusion with the KCl solution, that is, high activities of Na+ channels and the Na+ pump. These Na+ extrusion mechanisms may decrease the volume of the bronchiolar ciliary cells perfused with the KCl solution, and their inhibition (amiloride and strophanthidin) appears to increase cell volume because K+ enters the cell via K+ channels activated by terbutaline and no Na+ is extruded. At present, however, we have a limited knowledge of intracellular Na+ concentration, amiloride-blockable Na+ channels and the Na+ pump in bronchiolar ciliary cells. Further studies are required.
On the other hand, bumetanide and amiloride, which enhance terbutaline-induced cell shrinkage, when added during 0.5 μm terbutaline stimulation potentiated the CBF increase in bronchiolar ciliary cells. In contrast, quinidine added during terbutaline stimulation, which induced cell swelling, decreased CBF. During perfusion with the KCl solution containing amiloride and strophanthidin, 0.5 μm terbutaline increased the volume and CBF of the bronchiolar ciliary cells. However, the CBF increase induced by 0.5 μm terbutaline was small compared with that induced during perfusion with the KCl solution alone, in which terbutaline decreased the volume of bronchiolar ciliary cells. Moreover, the subsequent removal of either strophanthidin or amiloride, which decreased cell volume, induced a further increase in CBF. Thus, cell swelling inhibits the CBF increase in terbutaline-stimulated bronchiolar ciliary cells, and in contrast, cell shrinkage enhances it.
Moreover, the terbutaline dose–response study demonstrated that amiloride and bumetanide shift the dose–response curve of CBF to the lower-concentration side. However, amiloride and bumetanide did not induce any further increase in CBF during stimulation with 10 μm or 100 μm terbutaline. A high concentration of terbutaline leads to a maximum accumulation of cAMP, which induces the maximum activation of CBF, and cell shrinkage induces no potentiation of the CBF increase. Thus, cell shrinkage increases the cAMP sensitivity of the CBF increase, although it does not increase CBF directly. Moreover, CBF and cell volume showed a linear relationship in bronchiolar ciliary cells stimulated with 0.5 μm terbutaline, although the experimental conditions were different. Thus, the present experiments demonstrated that cell volume modulates the CBF increase during terbutaline stimulation.
Changes in cell volume have already been reported to modulate some cellular functions: amiloride-blockable non-selective cation channels in fetal lung cells (Tohda et al. 1994; Marunaka et al. 1999), exocytosis in antral mucous cells (Fujiwara et al. 1999), and apoptosis; (McCarthy & Cotter, 1997; Maeno et al. 2000), Na+–H+ exchange in rat astrocytes (Shrode et al. 1997) and salivary acinar cells (Robertson & Foskett, 1994).
We also applied hyper- (+50 mosmol l−1) and hyposmotic (–50 mosmol l−1) stresses by adding or removing 50 mm saccharose during 0.5 μm terbutaline stimulation. The application of a hyperosmotic stress induced cell shrinkage, but it decreased terbutaline-stimulated CBF. The application of a hyposmotic stress induced cell swelling, and it potentiated the terbutaline-stimulated CBF increase. Thus, the effects of osmotic cell volume changes on terbutaline-stimulated CBF were the opposite of those of isosmotic cell volume changes; that is, hyposmotic cell swelling enhanced the CBF increase, while isosmotic swelling suppressed it. The signalling pathways triggered by isosmotic volume changes may be different from those triggered by non-isosmotic volume changes in terbutaline-stimulated bronchilar ciliary cells. A similar observation has been reported in antral mucous cells; Ca2+-regulated exocytosis was enhanced by isosmotic cell shrinkage, but it was also enhanced by hyposmotic cell swelling (Fujiwara et al. 1999). The cellular events induced by cell volume changes under isosmotic conditions may not be the same as those induced during osmotic stress, such as a change in intracellular ionic concentration.
Isosmotic cell shrinkage has already been reported to decrease intracellular Cl− concentration, [Cl−]i, in salivary acinar cells (Foskett, 1990) and fetal lung cells (Tohda et al. 1994; Marunaka, 1997). The decrease in intracellular Cl− concentration was reported to modulate non-selective cation channels in fetal lung cells (Tohda et al. 1994; Marunaka et al. 1999), Na+ channels in salivary duct cells (Dinudom et al. 1993), G-proteins (Higashijima et al. 1987; Treharne et al. 1994), and Na+–K+–2Cl− cotransport in airway cells (Haas & McBrayer, 1994). With respect to [Cl−]i during osmotic stress, hyposmotic stress decreases [Cl−]i, and in contrast, hyperosmotic stress increases [Cl−]i. The present study demonstrated that the CBF increase in terbutaline-stimulated bronchiolar ciliary cells was potentiated by hyposmotic stress and suppressed by hyperosmotic stress. These observations suggest that the [Cl−]i decrease induced by isosmotic cell shrinkage may enhance the CBF increase in terbutaline-stimulated bronchiolar ciliary cells. Although, at present, we do not know the intracellular ionic concentrations in bronchiolar ciliary cells, [Cl−]i may be a modulator of CBF during terbutaline stimulation. However, we also have to consider other factors activated by isosmotic cell shrinkage which may modulate CBF. Further study is required to elucidate the underlying mechanisms of cell shrinkage-induced CBF potentiation.
In unstimulated ciliary cells, cell swelling induced by quinidine decreased CBF, although cell shrinkage induced by bumetanide and amiloride did not induce any increase in CBF. Cell swelling may decrease CBFs in unstimulated cells, although we cannot neglect the direct inhibitory effects of quinidine on CBF. Thus, it remains uncertain whether or not cell volume modulates CBF in unstimulated bronchiolar ciliary cells.
Upon stimulation with terbutaline, cell shrinkage preceded the CBF increase. This observation suggests that cell shrinkage during terbutaline stimulation plays an important role in the CBF increase; that is, cell shrinkage may cause a rapid increase in CBF when ciliary cells are stimulated with a small amount of cAMP, such as in the first 30 s of the terbutaline stimulation.
In bronchiolar ciliary cells under isosmotic conditions, terbutaline stimulates cAMP accumulation, which increases CBF and decreases cell volume, and cell shrinkage enhances the CBF increase by increasing cAMP sensitivity.
Acknowledgments
We thank Dr S. Ito for his technical support in connecting the video A/D converter.
References
- Devalia JL, Sapsford C, Rusznak C, Toumbis MJ, Davis RJ. The effects of salmeterol and salbutamol on ciliary beat frequency of cultured human bronchial epithelial cells, in vitro. Pulm Pharmacol. 1992;5:257–263. doi: 10.1016/0952-0600(92)90068-r. [DOI] [PubMed] [Google Scholar]
- Dinudom A, Young JA, Cook DI. Na+ and Cl− conductances are controlled by cytosolic Cl− concentration in the intralobular duct cells of mouse mandibular glands. J Membr Biol. 1993;135:289–295. doi: 10.1007/BF00211100. [DOI] [PubMed] [Google Scholar]
- Dobbs LG, Geppert EF, Williams MC, Greenleaf RD, Mason RJ. Metabolic properties and ultrastructure of alveolar type II cells isolated with elastase. Biochim Biophys Acta. 1980;618:510–523. doi: 10.1016/0005-2760(80)90270-2. [DOI] [PubMed] [Google Scholar]
- Foskett JK. [Ca2+]i modulation of Cl− content controls cell Volume in single salivary acinar cells during fluid secretion. Am J Physiol. 1990;259:C998–C1004. doi: 10.1152/ajpcell.1990.259.6.C998. [DOI] [PubMed] [Google Scholar]
- Foskett JK, Melvin JE. Activation of salivary secretion: coupling of cell Volume and [Ca2+]i in single cells. Science. 1989;244:1582–1585. doi: 10.1126/science.2500708. [DOI] [PubMed] [Google Scholar]
- Fujiwara S, Shimamoto C, Katsu K, Imai Y, Nakahari T. Isosmotic Modulation of Ca2+-Regulated Exocytosis in Guinea-Pig Antral Mucous Cells: Role of Cell. J Physiol. 1999;516:85–100. doi: 10.1111/j.1469-7793.1999.085aa.x. [DOI] [PMC free article] [PubMed] [Google Scholar]
- Haas M, McBrayer DG. Na-K-Cl cotransport in nystatin-treated tracheal cells: regulation by isoproterenol, apical UTP, and [Cl]i. Am J Physiol. 1994;266:C1440–C1452. doi: 10.1152/ajpcell.1994.266.5.C1440. [DOI] [PubMed] [Google Scholar]
- Higashijima T, Ferguson KM, Sternweis PC. Regulation of hormone-sensitive GTP-dependent regulatory proteins by chloride. J Biol Chem. 1987;262:3597–3602. [PubMed] [Google Scholar]
- Hosoi K, Min KY, Shiima C, Hanafusa T, Mori H, Nakahari T. Terbutaline-induced triphasic changes in Volume of rat alveolar type II cells: role of cAMP. Jpn J Physiol. 2002;52:561–572. doi: 10.2170/jjphysiol.52.561. [DOI] [PubMed] [Google Scholar]
- Lieb T, Frei CW, Frohock JI, Boolman RJ, Salate M. Prolonged increase in ciliary beat frequency after short-term purinergic stimulation in human airway epithelial cells. J Physiol. 2002;538:633–646. doi: 10.1113/jphysiol.2001.013222. [DOI] [PMC free article] [PubMed] [Google Scholar]
- Maeno E, Ishizaki Y, Kanaseki T, Hazama A, Okada Y. Normotonic cell shrinkage because of disordered Volume regulation is an early prerequisite to apoptosis. Proc Natl Acad Sci U S A. 2000;97:9487–9492. doi: 10.1073/pnas.140216197. [DOI] [PMC free article] [PubMed] [Google Scholar]
- Marunaka Y. Hormonal and osmotic regulation of NaCl transport in renal distal nephron epithelium. Jpn J Physiol. 1997;47:499–511. doi: 10.2170/jjphysiol.47.499. [DOI] [PubMed] [Google Scholar]
- Marunaka Y, Niisato N, O'Brodovich H, Eaton DC. Regulation of an amiloride-sensitive Na+-permeable channel by a β2-adrenergic agonist, cytosolic Ca2+ and Cl− in fetal rat alveolar epithelium. J Physiol. 1999;515:669–683. doi: 10.1111/j.1469-7793.1999.669ab.x. [DOI] [PMC free article] [PubMed] [Google Scholar]
- McCarthy JV, Cotter TG. Cell shrinkage and apoptosis: a role for potassium and sodium efflux. Cell Death Differ. 1997;4:756–770. doi: 10.1038/sj.cdd.4400296. [DOI] [PubMed] [Google Scholar]
- Mwimbi KMSX, Muimo R, Treharne KJ, Sijumbila G, Green M, Mehta A. 4α-Phorbol negates the inhibitory effects of phorbor-12-myristate-13-acetate on human cilia and alters the phosphorylation of PKC. FEBS Lett. 2002;530:31–36. doi: 10.1016/s0014-5793(02)03358-6. [DOI] [PubMed] [Google Scholar]
- Nakahari T, Fujiwara S, Shimamoto C, Kojima K, Katsu K, Imai Y. cAMP modulation of Ca2+-regulated exocytosis in ACh-stimulated antral mucous cells of guinea pig. Am J Physiol. 2002;282:G844–G856. doi: 10.1152/ajpgi.00300.2001. [DOI] [PubMed] [Google Scholar]
- Nakahari T, Marunaka Y. Regulation of cell Volume by β2-adrenergic stimulation in rat fetal distal lung epithelial cells. J Membr Biol. 1996;151:91–100. doi: 10.1007/s002329900060. [DOI] [PubMed] [Google Scholar]
- Nakahari T, Marunaka Y. β-agonist-induced activation of Na+ absorption and KCl release in rat fetal distal lung epithelium: a study of cell Volume regulation. Exp Physiol. 1997;82:521–536. doi: 10.1113/expphysiol.1997.sp004044. [DOI] [PubMed] [Google Scholar]
- Nakahari T, Murakami M, Yoshida H, Miyamoto M, Sohma Y, Imai Y. Decrease in rat submandibular acinar cell Volume during ACh stimulation. Am J Physiol. 1990;258:G878–G886. doi: 10.1152/ajpgi.1990.258.6.G878. [DOI] [PubMed] [Google Scholar]
- Nguyen T, Chin W-C, O'Brien JA, Verdugo P, Berger AJ. Intracellular pathway regulating ciliary beating of rat brain ependymal cells. J Physiol. 2001;531:131–140. doi: 10.1111/j.1469-7793.2001.0131j.x. [DOI] [PMC free article] [PubMed] [Google Scholar]
- Reuss L. Isolated-polarized epithelial cells as an experimental system for cell physiology studies. J Membr Biol. 2001;179:1–12. doi: 10.1007/s002320010024. [DOI] [PubMed] [Google Scholar]
- Robertson MA, Foskett JK. Na+ transport pathways in secretory acinar cells: membrane cross talk mediated by [Cl−]i. Am J Physiol, Cell Physiol. 1994;267:C146–C156. doi: 10.1152/ajpcell.1994.267.1.C146. 36. [DOI] [PubMed] [Google Scholar]
- Shrode LD, Klein JD, O'Neil WC, Douglas PB, Putnum RW. Shrinkage-induced activation of Na+/H+ exchange: role of cell density and myosin light chain phosphorylation. Am J Physiol. 1997;272:C1968–C1979. doi: 10.1152/ajpcell.1997.272.6.C1968. [DOI] [PubMed] [Google Scholar]
- Suzuki Y, Ohtsuyama M, Samman G, Sato F, Sato K. Ionic basis of methacholine-induced shrinkage of dissociated eccrine clear cells. J Membr Biol. 1991;123:33–41. doi: 10.1007/BF01993960. [DOI] [PubMed] [Google Scholar]
- Takemura T, Sato F, Saga K, Suzuki Y, Sato K. Intracellular ion concentrations and cell Volume during cholinergic stimulation of eccrine secretory coil cells. J Membr Biol. 1991;119:211–219. doi: 10.1007/BF01868726. [DOI] [PubMed] [Google Scholar]
- Tamaoki J, Chiyotani A, Sakai N, Konno K. Stimulation of ciliary motility mediated by atypical β-adrenoceptor in canine bronchial epithelium. Life Sci. 1993;53:1509–1511. doi: 10.1016/0024-3205(93)90558-k. [DOI] [PubMed] [Google Scholar]
- Tamaoki J, Kondo M, Tanizawa T. Effect of cAMP on ciliary function in rabbit tracheal epithelial cells. J Appl Physiol. 1989;66:1035–1039. doi: 10.1152/jappl.1989.66.3.1035. [DOI] [PubMed] [Google Scholar]
- Tohda H, Foskett JK, O'Brodovich H, Marunaka Y. Cl− regulation of a Ca2+-activated nonselective cation channel in β–agonist-treated fetal distal lung epithelium. Am J Physiol. 1994;266:C104–C109. doi: 10.1152/ajpcell.1994.266.1.C104. [DOI] [PubMed] [Google Scholar]
- Treharne KJ, Marshall LJ, Mehta A. A novel chloride-dependent GTP-utilizing protein kinase in plasma membranes from human respiratory epithelium. Am J Physiol, Lung Cell Mol Physiol. 1994;267:L592–L601. doi: 10.1152/ajplung.1994.267.5.L592. 11. [DOI] [PubMed] [Google Scholar]
- Verdugo P, Johnson NT, Tam PY. β-adrenergic stimulation of respiratory ciliary activity. J Appl Physiol. 1980;48:868–871. doi: 10.1152/jappl.1980.48.5.868. [DOI] [PubMed] [Google Scholar]
- Wanner A, Salathe M, O'riordan TG. Mucociliary clearance in the airways. Am J Respir Crit Care Med. 1996;154:1868–1902. doi: 10.1164/ajrccm.154.6.8970383. [DOI] [PubMed] [Google Scholar]
- Wong LB, Park CL, Yeates DB. Neuropeptide Y inhibits ciliary beat frequency in human ciliated cells via nPKC, independent of PKA. Am J Physiol. 1998;275:C440–C448. doi: 10.1152/ajpcell.1998.275.2.C440. (Cell Physiol 44) [DOI] [PubMed] [Google Scholar]
- Zagoory O, Braiman A, Priel Z. The mechanism of ciliary stimulation by acetylcholine: role of calcium, PKA, and PKG. J General Physiol. 2002;119:329–339. doi: 10.1085/jgp.20028519. [DOI] [PMC free article] [PubMed] [Google Scholar]


