

Abstract
Ca2+-activated K+ currents were studied in inner hair cells (IHCs) of mature mice. IK,f, the large-conductance Ca2+-activated K+ current (BK) characteristic of mature IHCs, had a fast activation time constant (0.4 ms at −25 mV at room temperature) and did not inactivate during 170 ms. Its amplitude, measured at −25 mV, and activation time constant were similar between IHCs in the apical and basal regions of the cochlea. IK,f was selectively blocked by 30 nm IbTx but was unaffected by superfusion of Ca2+-free solution, nifedipine or Bay K 8644, excluding the direct involvement of voltage-gated Ca2+ channels in IK,f activation. Increasing the intracellular concentration of the Ca2+ chelator BAPTA from 0.1 mm to 30 mm reduced the amplitude of IK,f at −25 mV and shifted its activation by 37 mV towards more depolarized potentials. A reduction in the size of IK,f and a depolarizing shift of its activation were also seen when either thapsigargin and caffeine or ryanodine were added intracellularly, suggesting that IK,f is modulated by voltage-dependent release from intracellular Ca2+ stores. Mature IHCs had a small additional Ca2+-activated K+ current (IK(Ca)), activated by Ca2+ flowing through L-type Ca2+ channels. This current was still present during superfusion of either IbTx (60 nm) or apamin (300 nm) but was abolished in Cs+-based intracellular solution or during superfusion of 5 mm TEA, suggesting the presence of an additional BK-channel type. Current clamp experiments at body temperature show that IK,f, but not IK(Ca), is essential for fast voltage responses of mature IHCs.
Large-conductance Ca2+-activated K+ channels (BK) are expressed in hair cells of both mammalian and non-mammalian vertebrates (Lewis & Hudspeth, 1983; Art & Fettiplace, 1987; Hudspeth & Lewis, 1988; Fuchs et al. 1988; Kros & Crawford, 1990; Dulon et al. 1995; Kros et al. 1998; Armstrong & Roberts, 2001; Skinner et al. 2003). Non-mammalian auditory hair cells are intrinsically tuned to a particular frequency of sound, which is primarily dictated by the interplay of Ca2+ and BK channels (Art & Fettiplace, 1987; Fuchs et al. 1988). Therefore colocalization between Ca2+ and BK channels (Hudspeth & Lewis, 1988; Roberts et al. 1990), their relative numbers and kinetic properties (Wu et al. 1995; Jones et al. 1999; Ramanathan et al. 2000) as well as local Ca2+ buffering kinetics (Ricci et al. 2000) are important determinants for setting the hair cell's intrinsic resonant frequency.
No evidence for electrical tuning is found in IHCs, the primary sensory receptors of the mammalian cochlea (Kros & Crawford, 1990). The appearance of the fast-activating IK,f at the onset of hearing (around 10–12 days after birth in mice) abolishes the action potentials characteristic of immature IHCs (Kros et al. 1998) and enables the cells to respond to sustained depolarization with graded receptor potentials that are essential for accurate sound encoding. A number of observations suggest that IK,f is likely to flow through BK channels: it is highly sensitive to iberiotoxin (Kros et al. 1998; Skinner et al. 2003), a specific blocker of BK channels (Kaczorowski et al. 1996), to charybdotoxin and to submillimolar concentrations of TEA (Kros et al. 1998) and is resistant to high concentrations of extracellular and intracellular 4-AP (Kros & Crawford, 1990). Moreover, the majority of inside-out patches from the basolateral membrane of guinea-pig IHCs contained BK channels with a single channel conductance of about 230 pS with kinetics similar to IK,f (Appenrodt & Kros, 1997) and currents recorded from inside-out macropatches taken from mouse IHCs were Ca2+ dependent and had fast activation kinetics (Oliver et al. 2003). However, removal of extracellular Ca2+ did not affect the amplitude or activation kinetics of IK,f (Kros & Crawford, 1990). It was thus suggested that IK,f must depend on Ca2+ released within the cell, or operate exclusively by means of its intrinsic voltage sensitivity (Kros & Crawford, 1990). The first direct evidence in mature IHCs for a Ca2+-activated K+ current that was affected by extracellular Ca2+ came from a study on the guinea-pig (Dulon et al. 1995). The authors showed that in mature IHCs when Ca2+ entry through L-type Ca2+ channels was blocked by the superfusion of nifedipine, a reduction of the total outward current occurred. Since the isolated Ca2+-activated K+ current was partially sensitive to charybdotoxin and insensitive to apamin the authors suggested that it might be carried by BK channels. The relatively small amplitude and slow activation of this current compared with those of IK,f (Kros & Crawford, 1990) suggests that both currents might be carried by two distinct BK channel types.
To investigate whether more than one population of BK channels is expressed in mouse IHCs we set out experiments in which the sensitivity of the outward K+ current of mature cells to intracellular and extracellular Ca2+ was tested. To test the basis of the voltage-dependent activation of IK,f we applied various agents that affect intracellular Ca2+ stores, which have been reported in immature IHCs (Kennedy & Meech, 2002). Moreover, we studied whether kinetic variations of the BK channel, like those found in the hair cells of the chick and turtle cochlea, were also present along the tonotopic axis of the mouse cochlea. We show that mouse cochlear IHCs express two distinct Ca2+-activated K+ currents that are both modulated by increases in cytosolic Ca2+ but only one of which is sensitive to extracellular Ca2+.
Methods
Tissue preparation
IHCs (n = 224) were studied in acutely dissected organs of Corti from CD-1 mice (Swiss CD-1, Charles Rivers, Margate, UK) from postnatal day 14 (P14) to P27, where the day of birth is P0. To investigate any effects of BAPTA on the delayed-rectifier K+ current 15 immature IHCs (P9) were also studied. Mice were killed by cervical dislocation in accordance with UK Home Office regulations. The organs of Corti were dissected and transferred to a microscope chamber and immobilized using a nylon mesh fixed to a stainless steel ring. The chamber (volume 2 ml) was perfused at a flow rate of about 10 ml h−1, from a peristaltic pump, with extracellular solution composed of (mm): 135 NaCl, 5.8 KCl, 1.3 CaCl2, 0.9 MgCl2, 0.7 NaH2PO4, 5.6 d-glucose, 10 Hepes-NaOH, 2 sodium pyruvate. Amino acids and vitamins for Eagle's minimum essential medium (MEM) were added from concentrates (Invitrogen, Paisley, UK). The pH was adjusted to 7.5 and the osmolality was about 308 mosmol kg−1. The organs of Corti were observed with an upright microscope (Zeiss ACM, Germany or Olympus, Japan) with Nomarski differential interference contrast optics (×40 water immersion objectives). To expose the basolateral surfaces of the cells, a small tear was made in the epithelium with a suction pipette (tip diameter about 2–4 μm) filled with normal extracellular solution. Only cells of healthy appearance (criteria included smooth surface of the cell membrane, absence of vacuoles in the cytoplasm and lack of Brownian motion of mitochondria) and with well-preserved hair bundles were investigated. The position of IHCs along the cochlea was recorded as fractional distance from the extreme apex. Cells were positioned between 0.06 and 0.19 in the apex and between 0.81 and 0.93 in the base, corresponding to approximate frequency ranges of 0.8–3.0 kHz and 49–75 kHz, respectively (using eqn (13) in Ehret, 1975).
Electrical recording
Membrane currents from IHCs under voltage clamp were studied at room temperature (22–25°C) by the whole-cell patch clamp technique using EPC-8 (HEKA, Lambrecht, Germany) or Optopatch (Cairn Research Ltd, Faversham, UK) amplifiers. To obtain realistic voltage responses, all current clamp experiments (Fig. 9) were performed near body temperature (35–37°C). Patch pipettes were pulled from soda glass capillaries (Harvard Apparatus Ltd, Edenbridge, UK) and electrode resistances in extracellular solution were 2–3 MΩ. In order to reduce the electrode capacitance, the shank of the electrode was coated with surf wax (Mr Zogs SexWax, Carpinteria, CA, USA).
Figure 9. Role of IK,f in shaping voltage responses in mature IHCs.

A and B, voltage responses under current clamp from apical-coil IHCs in the presence of 1 mm EGTA (A, P22) or 30 mm BAPTA (B, P22) in the KCl-based intracellular solution. Current steps were applied between −100 pA and +2000 pA, starting from the resting potential, and for clarity only a few responses are shown. Note the larger and slower voltage responses in 30 mm BAPTA. Recordings of injected current are shown above. EGTA (1 mm): Vm−73 mV; Cm 11.2 pF; Rs 4.6 MΩ; gleak 12 nS; temperature 37°C. BAPTA (30 mm): Vm−74 mV; Cm 9.5 pF; Rs 4.9 MΩ; gleak 3.8 nS; temperature 37°C. C, membrane currents in response to depolarizing voltage steps from −84 mV to the various test potentials shown by some of the traces. Cells as in A and B. D, exponential fits to the onset of the voltage responses to 100 pA depolarizing current for the two Ca2+ buffers. Cells as in A and B. E, time constants of voltage responses of apical-coil IHCs as a function of current injection with either 1 mm EGTA (n = 11, P22) or 30 mm BAPTA (n = 10, P22) in the intracellular solution. F, non-linear behaviour of the peak and steady-state (40 ms) voltage responses of IHCs, obtained by applying depolarizing and hyperpolarizing current steps from rest. EGTA (1 mm): n = 14, P22; 30 mm BAPTA; n = 14, P22. G, expanded version of panel F, over the range −90 pA to +130 pA.
The pipette filling solution for most of the current recordings contained (mm): 131 KCl, 3 MgCl2, 5 Na2ATP, 1 EGTA-KOH, 5 Hepes-KOH, 10 sodium phosphocreatine (pH 7.3, 292 mosmol kg−1). For the experiments designed to determine the specific roles of cytosolic Ca2+ on IK,f, 0.1 mm, 1 mm or 30 mm of the calcium buffer BAPTA (Molecular Probes, Leiden, the Netherlands) was used instead of EGTA. From the access resistance of the electrodes (Oliva et al. 1988), we can estimate that the time constant of diffusion from the patch pipette to the cytoplasm for a substance the size of BAPTA is in the order of 1 min. Therefore, all currents recorded in the presence of BAPTA were obtained between 3 and 14 min from breaking the membrane patch to allow the cytoplasm to equilibrate with the pipette solution. The role of Ca2+ released from intracellular stores on activation of IK,f was assessed by using either 10 mm caffeine and 1 μm thapsigargin or 20 μm or 30 μm ryanodine (Calbiochem, Nottingham, UK) in the above KCl-based intracellular solution. In some cases, including a number of the experiments to assess the effects of caffeine and thapsigargin, a potassium gluconate-based solution was used since its greater viscosity, compared to the normal KCl-based solution, is thought to preserve the cell's intracellular environment more effectively. Its composition was (mm): 110 KOH-gluconate, 16 KCl (11 in the presence of caffeine and thapsigargin), 3 MgCl2, 5 Na2ATP, 1 EGTA-KOH, 5 Hepes-KOH, 10 sodium phosphocreatine (pH 7.3, 294 mosmol kg−1).
In some experiments 15 mm 4-AP (Fluka, Gillingham, UK) was added to the KCl-based intracellular solution mentioned above in order to block the delayed rectifier IK,s (Figs 2C–E and 8C, D and I). When 30 mm BAPTA, 10 mm caffeine or 15 mm 4-AP was used in the intracellular solution, the concentration of KCl was adjusted to keep the osmolality constant. Finally, in the experiments designed to define the nature of IK(Ca) (Fig. 8H) the following CsCl-based intracellular solution was used (mm): 128 CsCl, 3 MgCl2, 5 Na2ATP, 1 EGTA-KOH, 5 Hepes-KOH, 15 4-AP, 10 sodium phosphocreatine (pH 7.3, 292 mosmol kg−1).
Figure 2. Kinetics of IK,f activation.

A, total control current (IK,f+IK,s), current in the presence of 30 nm IbTx (IK,s) and the IbTx-sensitive current (‘IK,f’), obtained by subtracting IK,s from the control current, at a membrane potential near −10 mV. B, isolated IK,f at −10 mV (dotted trace, with single exponential fit superimposed) obtained by subtracting IK,s from the total control current (IK,f+IK,s) after the current traces were corrected point-by-point for the uncompensated series resistance (see Methods). Recordings in A and B are from the same IHC as in Fig. 1. C, current recordings from an apical-coil IHC (P19) in which IK,f was isolated by superfusing the cell with 100 μm linopirdine and with 15 mm 4-AP in the KCl-based intracellular solution. D, currents recorded from the same cell as in C but with the additional superfusion of 60 nm IbTx. E, single exponential fit (continuous line) to the activation of IK,f (dotted trace) at the test potential of −12 mV, from panel C. Cm 10.0 pF; Rs 1.0 MΩ; gleak 3.5 nS; temperature 24°C. F, activation time constants for IK,f as a function of membrane potential in apical-coil (Ac: n = 16, P19–P22) and basal-coil (Bc: n = 11, P12–P26) IHCs.
Figure 8. Characterization of the additional Ca2+-activated K+ current.

A, effect of Ca2+-free solution (red traces) on the total outward K+ current (black traces) recorded when long voltage steps (4 s) were applied. Membrane currents were elicited in response to depolarizing voltage steps from −94 mV to the various test potentials shown by some of the traces, from the holding potential of −84 mV. B, steady-state I–V curves for the recordings shown in A and the isolated Ca2+-sensitive K+ current (in blue). P18 apical coil: Cm 9.8 pF; Rs 1.1 MΩ; gleak 5.4 nS; temperature 24°C. C and D, currents recorded in apical-coil IHCs for voltage steps near −14 mV using 15 mm 4-AP in the intracellular KCl-based solution, and 100 μm linopirdine and 60 nm IbTx in the extracellular solution in order to block IK,s, IK,n and IK,f, respectively. Under these conditions the effects of 50 μm nifedipine (C) and 5 mm Ca2+ (D) were investigated on the remaining outward K+ current. C: P20; Cm 9.5 pF; Rs 1.2 MΩ; gleak 1.6 nS; temperature 23°C. D: P20; Cm 10.9 pF; Rs 1.1 MΩ; gleak 1.5 nS; temperature 22°C. E, amplitude of the isolated Ca2+- or nifedipine-sensitive current measured around −14 mV, from a holding potential of −84 mV, under different conditions. F, double exponential fits to the isolated nifedipine-sensitive current shown in C. G, average time constants (τ1 and τ2) for six apical-coil IHCs. H, effects of superfusion of Ca2+-free solution on currents recorded in an apical-coil IHC using 15 mm 4-AP in the intracellular CsCl solution and 100 μm linopirdine and 60 nm IbTx in the extracellular solution as in C and D. P21: Cm 11.2 pF; Rs 5.8 MΩ; gleak 1.4 nS; temperature 24°C. I, effect of a Ca2+-free solution on the current recorded in a P18 IHC using, in addition to the pharmacological conditions as in C and D, 5 mm TEA in the extracellular solution. Cm 10.0 pF; Rs 1.6 MΩ; gleak 1.0 nS; temperature 24°C.
Data acquisition was performed using pCLAMP software (Axon Instruments, Union City, CA, USA) connected to a LabMaster DMA or a Digidata 1320A. Data were filtered, depending on the protocols used at 2.5 or 10 kHz (8 pole Bessel), sampled at 5, 50 or 100 kHz and stored on computer for off-line analysis using Origin software (OriginLab, Northampton, MA, USA). Current recordings were corrected offline for leak conductance (gleak) of 4.2 ± 0.2 nS (n = 224, P14–P27) measured around −90 mV, as the major outward K+ currents activate positive to −80 mV. This voltage was chosen as the best compromise to minimize the (small) contribution of IK,n to the measured outward current size by incorporating about half of it into the leak conductance (Marcotti et al. 2003a). The residual series resistance (Rs) after compensation (50–90%) was 1.7 ± 0.1 MΩ (n = 224, range from 0.5 to 6.7 MΩ) in mature cells resulting in an average voltage-clamp time constant of 17 μs. Membrane potentials for both voltage- and current-clamp experiments were corrected for residual series resistance and for the liquid junction potential measured between pipette and bath solutions. Liquid junction potentials were −4 mV for the KCl-based intracellular solution, −8 mV in the presence of 30 mm BAPTA and −12 mV for the gluconate-based intracellular solution. The majority of voltage clamp protocols are referred to a holding potential (Vh) of −84 mV. When 30 mm BAPTA was used Vh was −88 mV while in the presence of the gluconate-based intracellular solution Vh was either −82 mV or −92 mV. The holding currents were plotted as zero current.
We attempted to isolate IK,f using three different methods: by blocking most of the other K+ currents expressed in mature IHCs (Fig. 2C–E), by measuring the amplitude of IK,f at a membrane potential of −25 mV at 1.5 ms from the start of the voltage step (Figs 3, 4 and 6) or by subtracting the current in the presence of 30 nm or 60 nm iberiotoxin (IbTx) from the total control current (Figs 1 and 2A and B). The time point of 1.5 ms for the second method was chosen because the fast-activating IK,f had nearly reached its steady-state (about 98% for a 0.4 ms activation time constant at −25 mV, see Fig. 2F) while the other, slower, outward K+ currents were only just beginning to activate. In the last method, due to uncompensated Rs, subtracting large currents with different activation kinetics might produce an artefactual representation of the subtracted current (Fig. 2A) since each recorded current trace may not have been obtained at a constant voltage throughout the duration of the steps. In order to overcome this problem, point-by-point current–voltage curves were plotted and each nominal voltage was corrected for the residual Rs (Fig. 2B). Linear interpolation of the current–voltage (I–V) plots allowed the reconstruction of the corrected current trace at a fixed membrane potential (Santos-Sacchi et al. 1997).
Figure 3. Extracellular Ca2+ does not block IK,f.

A and C, control currents (continuous traces) and currents in the absence of extracellular Ca2+ (dotted traces) recorded from an apical-coil P18 (A) and a basal-coil P22 (C) IHC. Membrane currents were elicited in response to depolarizing voltage steps (10 mV increments) from −104 mV to the various test potentials shown by some of the traces, starting from a holding potential of −84 mV. B and D, I–V curves measured at 1.5 ms from the start of the voltage steps, for the recordings shown in A and C, respectively, and for the Ca2+-sensitive current obtained by subtracting the current in the absence of extracellular Ca2+ from the control current. A and B: Cm 9.8 pF; Rs 1.1 MΩ; gleak 5.4 nS; temperature 24°C. C and D: Cm 10.9 pF; Rs 1.4 MΩ; gleak 5.8 nS; temperature 24°C. E–G, amplitude of IK,f measured at 1.5 ms and at −25 mV in both apical and basal IHCs before and during superfusion of a Ca2+-free solution (E, Ac: P18-P22; Bc: P22-P24), 30 μm nifedipine (F, Ac: P17–P22; Bc: P22–P26) or 5 μm Bay K 8644 (G, Ac and Bc: P22). Numbers of cells are indicated above each pair of columns.
Figure 4. The size of IK,f is affected by intracellular Ca2+ buffering.

A and B, typical currents recorded in the presence of 0.1 mm and 30 mm BAPTA, respectively, from basal-coil IHCs. Currents were recorded by applying voltage steps in 10 mV increments starting from the holding potential. C, I–V curves measured at 1.5 ms from the start of the voltage steps for the recordings shown in A and B. BAPTA (0.1 mm), P25: Cm 10.6 pF; Rs 1.5 MΩ; gleak 6.3 nS; temperature 24°C. BAPTA (30 mm), P26: Cm 10.7 pF; Rs 1.1 MΩ; gleak 1.7 nS; temperature 24°C. D, amplitude of the isolated IK,f, measured at −25 mV, in both apical (Ac) and basal (Bc) coil IHCs using 0.1 mm, 1 mm and 30 mm intracellular BAPTA. Numbers of cells are indicated above each column.
Figure 6. Effects of Ca2+ stores on IK,f amplitude and activation.

A and B, typical outward K+ currents recorded in basal-coil IHCs using a potassium gluconate based intracellular solution (A) and when 10 mm caffeine and 1 μm thapsigargin were added (B). Membrane currents were elicited in response to depolarizing voltage steps (10 mV increments) from −102 mV to the various test potentials shown by some of the traces, starting from the holding potential of −82 mV. C, outward K+ currents in a basal IHC with 20 μm ryanodine in a KCl-based intracellular solution. Holding potential −84 mV, depolarizing voltage steps from −104 mV. A: Cm 10.8 pF; Rs 1.0 MΩ; gleak 5.8 nS; temperature 24°C. B: Cm 10.9 pF; Rs 0.6 MΩ; gleak 2.3 nS; temperature 23°C. C: Cm 10.8 pF; Rs 1.1 MΩ; gleak 3.9 nS; temperature 24°C. D, I–V curves measured 1.5 ms from the start of the voltage steps for the recordings shown in A–C. E, amplitude of the isolated IK,f, measured at 1.5 ms and −25 mV in both apical and basal IHCs using KCl and potassium gluconate based intracellular solutions. F, average steady-state activation curves, measured at 0.1–0.2 ms from stepping to a 2–3 ms test potential near −44 mV, for the isolated IK,f in apical-coil IHCs. The continuous lines are fits using eqn (2). Fitting parameters are: Control, P20–P22, •, Imax = 673 pA, V½ = −46.2 mV, S = 8.5 mV, n = 6; 10 mm caffeine +1 μm thapsigargin: ○, P21−P22, Imax= 735 pA, V½= −24.3 mV, S = 8.8 mV, n = 3. G, V½ (left panel) and S (right panel) for the activation curves shown in F. H, half-activation (V½)voltage of IK,f as a function of BAPTA concentration. The equivalent BAPTA concentration for 1 mm EGTA with and without caffeine and thapsigargin is estimated. Values for EGTA V½ from g and BAPTA V½ from Fig. 5D.
Figure 1. IK,f is selectively blocked by IbTx.

A and B, total control current (IK,f+IK,s) and current in the presence of 30 nm IbTx (IK,s) recorded from a P19 IHC from the apical coil of the cochlea. Membrane currents were elicited in response to depolarizing voltage steps (10 mV increments) from −104 mV to the various test potentials shown by some of the traces, starting from the holding potential of −84 mV. C, steady-state I–V curves for the cell shown in A and B. Cm 8.5 pF; Rs 2.1 MΩ; gleak 3.5 nS; temperature 24°C. Current recordings in this and in the following figures are single traces, unless otherwise stated.
Extracellular superfusion
The K+ channel blockers IbTx (Tocris, Bristol, UK), apamin (Calbiochem, Nottingham, UK) and linopirdine (RBI, Natick, MA, USA) were extracellularly superfused in order to specifically abolish IK,f, ISK and IK,n, respectively. The role of Ca2+ channels in the activation of the outward K+ current was investigated by extracellular application of nifedipine (Sigma), Bay K 8644 (Calbiochem) or a Ca2+-free solution containing 0.5 mm EGTA, in which MgCl2 was increased to 3.9 mm to keep membrane charge screening approximately constant (Blaustein & Goldman, 1968). In a few experiments, extracellular TEA (Fluka) was used in order to test its effects on IK(Ca). When TEA was added to the extracellular solution equimolar substitution of NaCl was used in order to keep the osmolality constant. The extracellular solutions containing drugs were applied through a multibarrelled pipette positioned close to the patched hair cell.
Statistical analysis
Statistical comparisons of means were made by Student's two-tailed t test or, for multiple comparisons, analysis of variance, usually one-way ANOVA followed by Tukey's test (Figs 3E–G, 4D, 5D, 6E, 7G and I, and 8E). Two-way ANOVA, followed by the Bonferroni test, was used to compare current properties between apical and basal IHCs during development (Figs 2F, 5E and F, and 9E and F). P < 0.05 was used as the criterion for statistical significance. Mean values are quoted ±s.e.m. in text and figures. In the bar graphs statistically significant differences are indicated by an asterisk.
Figure 5. Effects of BAPTA concentration on activation and kinetics of IK,f.

A and B, membrane currents recorded from apical-coil IHCs when 0.1 mm and 30 mm BAPTA were used as the intracellular Ca2+ buffer. Currents are averages from six and 10 repetitions, respectively. A: Cm 11.0 pF; Rs 1.2 MΩ; gleak 6.6 nS; temperature 23°C. B: Cm 10.8 pF; Rs 1.0 MΩ; gleak 4.6 nS; temperature 23°C. C, average steady-state activation curves for IK,f in the presence of 0.1 mm, 1 mm and 30 mm BAPTA. The continuous lines are fits using eqn (2). Fitting parameters are: 0.1 mm BAPTA, •, Imax= 1341 pA, V½= −50.4 mV, S = 11.8 mV, n = 6; 1 mm BAPTA: ▵, Imax= 891 pA, V½= −30.1 mV, S = 10.8 mV, n = 3; 30 mm BAPTA: ○, Imax= 1148 pA, V½= −13.1 mV, S = 10.6 mV, n = 9. D, V½ (left panel) and S (right panel) for the activation curves shown in C. Numbers of cells above each column. E, time constant of activation of IK,f, fitted using a single exponential, in the presence of different BAPTA concentrations. F, time constants of deactivating tail currents recorded at a membrane potential near −47 mV following a series of 2–3 ms voltage steps from the holding potential. Number of cells in E and F as in D.
Figure 7. An additional Ca2+-activated K+ current is sensitive to extracellular Ca2+.

A and D, effects of superfusing Ca2+-free solution (dotted traces) on the total outward K+ current (continuous traces) in a P18 apical-coil (A) and a P22 basal-coil (D) IHC. Membrane currents were elicited in response to depolarizing voltage steps (10 mV increments) from −104 mV to the various test potentials shown by some of the traces, starting from a holding potential of −84 mV. Membrane potentials in italics refer to currents in the presence of Ca2+-free solution. B and E, steady-state I–V curves for the recordings shown in A and D, respectively, and the current sensitive to extracellular Ca2+ isolated by subtraction. C and F, enlarged representation of the small isolated Ca2+-sensitive K+ current. Panels A–F same cells as Fig. 3A–D. G, amplitude of the Ca2+-sensitive K+ current in apical-coil (P18-P22) and basal-coil (P22–P26) IHCs obtained by subtracting the current recorded close to −14 mV in the presence of a Ca2+-free solution or 30 μm nifedipine from the control current. H, examples of the Ca2+-sensitive current in apical and basal IHCs obtained by subtraction and fitted by a single exponential. Apical coil: same cell as A. Basal-coil IHC (P23): Cm 10.8 pF; Rs 1.8 MΩ; gleak 2.0 nS; temperature 24°C. I, time constant of activation of the Ca2+-sensitive current isolated in apical and basal IHCs using either a Ca2+-free solution or 30 μm nifedipine.
Results
Kinetics and lack of dependence on extracellular Ca2+ of IK,f
The highly specific BK channel blocker IbTx blocks the IHC current IK,f at low nanomolar concentrations (Kros et al. 1998). We employed this specificity to isolate IK,f from the total outward current of mature IHCs for the purpose of kinetic analysis. A saturating dose of IbTx (30 nm) was applied during repeated presentations of a series of depolarizing voltage steps, 50–170 ms in duration, from −104 mV in 10 mV increments from the holding potential of −84 mV. Figure 1A and B shows that extracellular application of 30 nm IbTx completely removed the fast IK,f and left mainly the slowly activating delayed rectifier IK,s (Kros & Crawford, 1990; Kros et al. 1998). The steady-state I–V relations for the control current and the current in the presence of IbTx are shown in Fig. 1C. To study the activation time course of the isolated IK,f, the current remaining in the presence of IbTx (IK,s) was subtracted from the control current (IK,f+IK,s, Fig. 2A). After subtraction, the IbTx-sensitive current (IK,f) showed rapid activation followed by a decline (Fig. 2A, dotted trace) similar to that previously reported in guinea-pig IHCs when the same current was isolated using a similar procedure (Skinner et al. 2003; Kimitsuki et al. 2003). However, subtracting large currents with different activation kinetics tends to produce an artefactual representation of the subtracted current due to the voltage drop across the uncompensated Rs (see Methods). Therefore, traces recorded in control conditions and in the presence of IbTx were corrected point-by-point for the uncompensated Rs before subtraction. Figure 2B shows for the same cell the total current (IK,f+IK,s) and the current in the presence of IbTx (IK,s) at −10 mV when the above procedure was applied. Under this condition, a true representation of the isolated IK,f (dotted trace) could be obtained by subtracting IK,s from the total current (Fig. 2B). The isolated IK,f showed rapid activation and no signs of inactivation for voltage steps of up to 170 ms. The fitted single-exponential time constant for the activation of the isolated IK,f was 0.41 ms.
An alternative way to isolate IK,f would be to block all the other K+ currents expressed in mature IHCs. These consist of the delayed-rectifier K+ currents, IK,s (80% of which is 4-AP sensitive) and the much smaller linopirdine-sensitive IK,n (Marcotti et al. 2003a). We attempted to block these currents by using 15 mm 4-AP in the intracellular solution (Kros & Crawford, 1990) and superfusing IHCs with 100 μm linopirdine. Under these conditions the outward K+ current (Fig. 2C and E) resembled that obtained after the subtraction procedure (Fig. 2B, dotted trace). To determine whether 15 mm 4-AP and 100 μm linopirdine were sufficient to isolate IK,f, we additionally superfused the same IHCs with a fully blocking concentration of IbTx (30 nm or 60 nm). In the presence of IbTx (Fig. 2D) a small residual IbTx-insensitive current was isolated which at 0 mV and at the steady state represented about 10.2 ± 2.1% (n = 6) of the current recorded in the presence of 4-AP and linopirdine alone. The composition of this residual current will be examined further on in the Results (Figs 7 and 8). This result suggests that the best method for isolating IK,f was by subtracting the current in the presence of IbTx from the total outward K+ current (Fig. 2B) rather than by trying to block all the other K+ currents (Fig. 2C). However, since the kinetics of IK,f are much faster than IK,s, its time constant of activation, evaluated by using a single exponential fit, did not vary significantly between the methods of isolation used (for comparison see Fig. 2B and E). The time constant of IK,f measured at room temperature and at different membrane potentials was found not to differ significantly between apical (P19–P22, n = 16) and basal (P22–P26, n = 11) IHCs (Fig. 2F). To compare the activation kinetics of IK,f in mouse IHCs with those previously obtained in apical-coil guinea-pig IHCs (Kros & Crawford, 1990), we fitted the activation in six apical cells to the sigmoidal equation used by Kros & Crawford (1990):
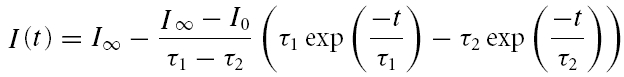 |
where I(t) is the current amplitude at time t, I0 is the current at t = 0, I∞ is the steady-state current and τ1 and τ2 are the activation time constants. We found that in mice τ1 (0.51 ± 0.04 ms, n = 6) and τ2 (0.17 ± 0.02 ms) measured at a membrane potential around −37 mV were about two times faster than those recorded, also at room temperature, in the guinea-pig IHCs (Kros & Crawford, 1990). In these same mouse IHCs the time constant obtained by a single exponential fit (0.53 ± 0.05 around −37 mV, n = 6) was very similar to the principal time constant τ1, for which it thus provided a good approximation. The kinetics of deactivation were studied for tail currents near −46 mV following 2 or 3 ms conditioning steps to more depolarized potentials and could be well fitted with a single exponential time constant of about 0.5 ms for apical-coil IHCs. The deactivation kinetics were about three times faster than in guinea-pig IHCs at room temperature (Kros & Crawford, 1990).
Although there is no doubt about the high IbTx sensitivity of IK,f, one issue of controversy is its Ca2+ sensitivity. An early study reported that in guinea-pig IHCs IK,f was not altered by the removal of extracellular Ca2+ (Kros & Crawford, 1990). However, a few years later it was shown, using the same preparation, that when L-type Ca2+ channels were selectively blocked by nifedipine a K+ current sensitive to Ca2+ could be isolated (Dulon et al. 1995). In order to determine whether IK,f was directly affected by extracellular Ca2+ we measured its amplitude, before and during different Ca2+ manipulations, at a membrane potential of −25 mV and at 1.5 ms from the start of the voltage steps. Figure 3A and C shows examples of the total outward K+ current recorded from an apical- and basal-coil IHC, respectively, before and during the superfusion of a Ca2+-free solution. Current recordings were obtained by applying depolarizing voltage steps in 10 mV nominal increments from −104 mV starting from the holding potential of −84 mV. The I–V curves (measured at 1.5 ms) for the control current, the current in the presence of a Ca2+-free solution and the negligible isolated Ca2+-sensitive current, obtained by subtracting the current recorded during superfusion of a Ca2+-free solution from the control, are shown in Fig. 3B (apical coil) and D (basal coil). As shown in Fig. 3E the amplitude of IK,f at −25 mV in both apical (P17–P22) and basal (P22–P24) IHCs was not significantly affected by the superfusion of a Ca2+-free solution suggesting that the Ca2+ current, known to be present in mature IHCs (see Fig. 9E in Marcotti et al. 2003b), is not directly involved in the activation of IK,f. Although this result confirms earlier observations in isolated IHCs (Kros & Crawford, 1990), we considered whether the inability of the Ca2+-free solution to block IK,f might be due to incomplete exchange of solution around the IHCs in this multicellular preparation. This was not the case since the Ca2+ current was rapidly abolished when cells were superfused with Ca2+-free solution (data not shown) and moreover IK,f was completely blocked by nanomolar concentrations of IbTx (Fig. 1). The lack of a direct interaction between Ca2+ current and IK,f was verified by superfusing nine IHCs with nifedipine and six IHCs with Bay K 8644, a known blocker and activator for the dihydropyridine (DHP)-sensitive L-type Ca2+ channel, respectively (Platzer et al. 2000). When 30 μm nifedipine or 5 μm Bay K 8644 was superfused onto IHCs (P17–P22 for nifedipine, Fig. 3F; P22–P26 for Bay K 8644, Fig. 3G) the size of IK,f was not significantly affected in either apical or basal IHCs. Note that in basal-coil IHCs the current was slightly reduced (by 12%) by a Ca2+-free solution and increased (by 6%) by Bay K 8644, although the effects were not statistically significant. This is probably due to the presence of an additional Ca2+-sensitive K+ current that is different from IK,f and is faster and larger in basally located cells than in apical cells (see Fig. 7).
Nature and modulation of the Ca2+-activated K+ current IK,f
Since IK,f was insensitive to extracellular Ca2+ a series of experiments was performed to evaluate its sensitivity to cytosolic Ca2+. We attempted to reduce any changes in free cytosolic Ca2+ concentration near the Ca2+-activated K+ channels either by using high concentrations of the fast Ca2+ buffer BAPTA (Neher, 1998) or by removing the contribution from the intracellular Ca2+ stores (Verkhratsky, 2002). First of all, BAPTA (0.1 mm, 1 mm and 30 mm) was used in the intracellular solution instead of EGTA (1 mm). Figure 4A and B shows basal hair cells that were recorded from using 0.1 mm or 30 mm BAPTA as the internal Ca2+ buffer. The membrane potential was stepped from −104 mV (0.1 mm BAPTA) or −108 mV (30 mm BAPTA) to different test potentials in 10 mV increments from the holding potential of −84 mV or −88 mV, respectively. Hair cells buffered with 30 mm BAPTA had smaller initial and steady-state currents than did those buffered with 0.1 mm BAPTA, suggesting that IK,f has been substantially reduced. To test whether the delayed rectifier K+ current was also affected by BAPTA, we compared the size of the outward K+ current in P9 IHCs, a time at which IK,f is not yet expressed (Kros et al. 1998; Marcotti et al. 2003a), using different intracellular BAPTA concentrations or EGTA. The amplitude of the delayed rectifier K+ current (measured 160 ms following a voltage step to −25 mV) was not significantly different between the above experimental conditions (0.1 mm BAPTA: 1.6 ± 0.2 nA, n = 2; 1 mm BAPTA: 1.3 ± 0.2 nA, n = 3; 30 mm BAPTA: 1.4 ± 0.3 nA, n = 4; 1 mm EGTA: 1.2 ± 0.1 nA, n = 6).
The I–V curves for the isolated IK,f (measured 1.5 ms from the start of the voltage step) in Fig. 4A and B show that the high BAPTA concentration shifted the potential at which this current first became evident towards more depolarized potentials (Fig. 4C). The amplitude of IK,f in the presence of different BAPTA concentrations was measured in both apical (P20–P22) and basal (P22–P25) IHCs (Fig. 4D). In both regions the size of IK,f at −25 mV decreased significantly (P < 0.001) with increasing BAPTA concentration.
Steady-state activation of the isolated IK,f in the presence of 0.1 mm, 1 mm and 30 mm of BAPTA was evaluated by analysing tail currents at a fixed membrane potential. From the holding potential of −84 mV or −88 mV (when 30 mm BAPTA was used), the membrane potential was stepped to a test potential near −47 mV after a series of short conditioning steps (2 ms or 3 ms in duration) in 10 mV increments from −104 mV or −108 mV (Fig. 5A and B). The activation curves in Fig. 5C were obtained by plotting the normalized instantaneous tail currents (measured at 0.1–0.2 ms from stepping to the test potential) against the different conditioning potentials. Data were fitted by a single first-order Boltzmann equation:
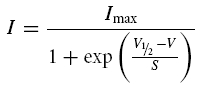 |
where I is the tail current amplitude, Imax is the maximal tail current, V½ is the potential of half-maximal activation, V is the membrane potential of the conditioning voltage step and the slope factor S describes the voltage sensitivity of activation.
Increasing the intracellular BAPTA concentration from 0.1 mm to 30 mm shifted the activation curve by about 37 mV towards a more depolarized potential in apical IHCs (P < 0.0001). The slope factor and maximal tail current did not vary significantly. Figure 5D shows the mean values for V½ (left panel) and S (right panel) when 0.1 mm, 1 mm and 30 mm BAPTA were used. The activation time constants also varied significantly between 0.1 mm, 1 mm and 30 mm BAPTA (P < 0.0001), with the slower time constants at a given potential in 30 mm BAPTA (Fig. 5E) corresponding to a depolarizing shift of about 20 mV. Between 0.1 mm and 1 mm the depolarizing shift was about 5 mV. Figure 5F shows the time constants of deactivating tail currents measured around −47 mV in the presence of the above BAPTA concentrations. The tail current kinetics were also significantly different between the three conditions (P < 0.0001) but becoming faster with increasing BAPTA concentration.
The above results show that although extracellular Ca2+ does not directly affect the activation of IK,f, variations in cytosolic Ca2+ buffering shifted its steady-state activation, suggesting that IK,f could potentially be modulated by Ca2+ released from intracellular stores. We investigated this hypothesis by adding either caffeine and thapsigargin or ryanodine to the intracellular solution. Caffeine is a xanthine that causes the release of Ca2+ from stores by affecting ryanodine receptors in such a way that their affinity for cytoplasmic Ca2+ is increased (Pozzan et al. 1994). On the other hand, thapsigargin is a known inhibitor of sarcoplasmic/endoplasmic reticulum Ca2+-ATPase (SERCA) (Thastrup, 1990), thus preventing the refilling of Ca2+ stores. Using both molecules together would initially empty the Ca2+ stores, due to the action of caffeine, which would not be able to refill, due to thapsigargin, and therefore remove any contribution that the stores have on cytosolic Ca2+ modulation. IHCs were dialysed for up to 14 min after reaching the whole cell configuration with a KCl or potassium gluconate based intracellular solution containing both caffeine (10 mm) and thapsigargin (1 μm). Typical examples of membrane currents recorded, using a potassium gluconate intracellular solution, from basal-coil IHCs in control conditions and when both caffeine and thapsigargin were used are shown in Fig. 6A and B, respectively. Ryanodine at high concentrations (greater than 10 μm) causes a block of the Ca2+ efflux from the stores (Meissner, 1986). Figure 6C shows membrane currents of a basal-coil IHC in the presence of 20 μm ryanodine in a KCl-based intracellular solution. Note that when caffeine and thapsigargin or ryanodine were present the fast initial current was reduced in size. The I–V curves (Fig. 6D), measured at 1.5 ms, indicate that in the presence of the drugs IK,f started to activate at a more depolarized potential, similar to that found when 30 mm BAPTA was used (Fig. 4C). The amplitude of the isolated IK,f in apical and basal IHCs (at 1.5 ms and at a membrane potential of −25 mV) in control conditions and in the presence of the drugs is shown in Fig. 6E. The amplitude of IK,f was significantly reduced in the presence of caffeine and thapsigargin compared to that measured in control conditions (KCl based: Ac, P < 0.05; Bc, P < 0.01. Potassium gluconate based: Bc, P < 0.01). Ryanodine also reduced the size of IK,f (KCl based: Ac, P < 0.01; Bc, P < 0.05). The amplitude of IK,f at −25 mV recorded using 1 mm EGTA as the Ca2+ buffer under control conditions (Fig. 6E) was found not to differ significantly from that recorded with either 1 mm or 0.1 mm BAPTA (Fig. 4D). The modulation of the activation of IK,f by the intracellular Ca2+ stores was further investigated in apical IHCs by comparing tail currents recorded in control conditions and when both caffeine and thapsigargin were added to the intracellular solution. Tail currents were recorded at a fixed membrane potential following short (2 ms or 3 ms in duration) depolarizing voltage steps that fully activated IK,f (currents not shown), as in Fig. 5A and B. The activation curves in Fig. 6F were obtained by plotting the normalized instantaneous tail currents measured at around −44 mV against the different conditioning potentials. Data were fitted by a single first-order Boltzmann equation (eqn (2)). When both caffeine and thapsigargin were used the activation of IK,f was shifted positively by about 22 mV with a V½ (Fig. 6G, left panel) significantly more depolarized (P < 0.0001) than that in control conditions. Again the slope factor (Fig. 6G, right panel) and Imax did not vary significantly. Activation was slowed and deactivation speeded up by caffeine and thapsigargin, but to a lesser extent than in 30 mm BAPTA. Figure 6H shows V½ for the current recorded using 1 mm EGTA as the intracellular Ca2+ buffer expressed as an equivalent BAPTA concentration. In control conditions V½ corresponded to about 0.2 mm BAPTA. In the presence of caffeine and thapsigargin the V½ was equivalent to about 3 mm BAPTA.
Do mature IHCs express another Ca2+-activated K+ current?
The experiments so far indicate that IK,f is not directly activated by extracellular Ca2+. However, the total outward K+ current was not completely insensitive to extracellular Ca2+ since the steady-state current was reduced in amplitude in both apical and basal IHCs when a Ca2+-free solution was applied (Fig. 7A and D respectively, dotted traces). This became evident for voltage steps lasting longer than a few milliseconds (cf. Fig. 3A and C, which shows currents from the same apical and basal IHCs in response to shorter voltage steps). The steady-state I–V curves, measured at 160 ms, for the control, the current in the presence of a Ca2+-free solution and the isolated Ca2+-activated K+ current, obtained by subtracting the current in the absence of Ca2+ from the control current, are shown in Fig. 7B (apical) and E (basal). The Ca2+-activated currents are shown expanded in Fig. 7C and F, where the bell shape of the I–V curve can be appreciated. The maximal amplitude of the Ca2+-activated K+ current, measured around −14 mV, was obtained by subtraction when apical and basal IHCs were superfused with either a Ca2+-free solution or 30 μm nifedipine. Using either of these isolation procedures, the Ca2+-sensitive K+ current was significantly (P < 0.01) larger in basal IHCs compared to that isolated in apical cells (Fig. 7G). The Ca2+-sensitive current could be isolated by subtracting the current recorded in a Ca2+-free solution from the control current. Examples for an apical and a basal IHC are shown in Fig. 7H and their activation is fitted by a single exponential. The activation time constants of the isolated Ca2+-sensitive currents were significantly faster (P < 0.01) in basal than in basal IHCs (Fig. 7I). The range of time constants was quite wide: 2.2 ms to 11 ms in basal IHCs and 12 ms to 48 ms in apical IHCs. The larger size and faster activation of this current may account for the small reduction in the size of the outward current, measured at 1.5 ms, in basal IHCs in a Ca2+-free solution (Fig. 3E).
A reduction in the total outward K+ current in the presence of a Ca2+-free solution was also observed using very long lasting (4 s) voltage steps (Fig. 8A red traces). The ‘steady-state’I–V curves, measured at 4 s, for the control, the current in Ca2+-free solution and the isolated Ca2+-activated K+ current are shown in Fig. 8B. Note that the total outward K+ currents, also in the control condition, are considerably smaller than for shorter protocols of up to 170 ms duration (e.g. Fig. 7A). This may be due to a slow inactivation process on a time scale of seconds or to K+ accumulation and depletion effects, but was not investigated in detail for this study. Since previous results (Fig. 3) demonstrated that IK,f is not significantly affected by extracellular Ca2+, we designed a series of experiments to find out whether indeed another type of Ca2+-activated K+ current was present or whether instead either one of the other K+ currents known to be expressed in mature IHCs (IK,s and IK,n: Marcotti et al. 2003a) was modulated by extracellular Ca2+. To differentiate between these possibilities we largely removed the delayed-rectifier current IK,s, by including 15 mm 4-AP in the intracellular solution, and completely blocked IK,n by superfusing IHCs with 100 μm linopirdine. The superfused solution also contained a fully blocking concentration of IbTx (30 nm or 60 nm) to remove IK,f. Under these conditions a small outward current of between 300 pA and 800 pA remained (labelled ‘Control’ in Fig. 8C and D). Recordings were obtained by applying a voltage step to a nominal value of −14 mV from the holding potential of −84 mV. We stepped the voltage to −14 mV as it represents the potential at which the peak of the Ca2+-sensitive current occurs in 1.3 mm extracellular Ca2+ (Fig. 8B). When the current recorded in the presence of 30 μm or 50 μm nifedipine (Fig. 8C) or a Ca2+-free solution (data not shown) was subtracted from the control current, a Ca2+-activated current of a similar size to when all outward K+ currents were present could still be isolated. In contrast to the responses to 170 ms voltage steps (Fig. 7G), the size of the Ca2+-activated K+ current in response to 4 s voltage steps was not obviously different between apical and basal IHCs. The size of the Ca2+-sensitive current was directly dependent on the extracellular Ca2+ concentration since its amplitude increased when 5 mm Ca2+ was used instead of 1.3 mm Ca2+ (Fig. 8D and E). Any involvement of Ca2+ released from intracellular stores in the activation of this Ca2+-activated K+ current was excluded since similar results to those shown in Fig. 8C and D were obtained in five apical-coil IHCs when 10 mm caffeine and 1 μm thapsigargin were added to the intracellular solution (data not shown). These results suggest that a Ca2+-activated K+ current, sensitive to extracellular Ca2+ flowing through voltage gated Ca2+ channels, is expressed in mature IHCs in addition to IK,f. Using the 4 s voltage step stimulus, the amplitude of the Ca2+- or nifedipine-sensitive current was similar, whether it was isolated from the total outward current (Fig. 8E, black column) or when using the different K+ channel blockers (Fig. 8E, hatched columns). The persistence of the current sensitive to extracellular Ca2+ in the presence of the blockers shows that it is not a component of IK,s or IK,n. From now on this Ca2+-activated current will be referred to as IK(Ca). A careful examination of the time course of activation of IK(Ca) (Fig. 8C and D) revealed that the slow activation was preceded by a much faster component. Figure 8F shows double exponential fits to the faster and the slower component for the isolated nifedipine-sensitive current (Fig. 8C). The two time constants of activation of IK(Ca) are shown in Fig. 8G. The fast time constant τ1 was not significantly different from that recorded in apical IHCs for the Ca2+- and nifedipine-sensitive current obtained using the 170 ms voltage steps (Fig. 7I). Because the fast and slow components shared the same pharmacological sensitivity we assume they represent a single population of channels. The most likely possibility is that the slow component reflects a slow increase in intracellular Ca2+ near the channels during long depolarizations.
The next step was to identify the type of channel responsible for IK(Ca), in particular whether it is likely to be carried by BK or SK channels. In contrast to BK channels, SK channels are usually permeable to Cs+ (Park, 1994; Erostegui et al. 1994) and only blocked by high concentrations of TEA (> 20 mm, Sah, 1996). Under the same pharmacological and recording conditions described above (Fig. 8C and D control traces) we tested the sensitivity of this current in apical IHCs to extracellular TEA (5 mm) and to substitution of intracellular K+ by Cs+. Our findings show that IK(Ca) is abolished by Cs+ and TEA. First of all, the control outward current was absent in Cs+ (Fig. 8H) or much reduced in TEA (Fig. 8I), compared to the control current in Fig. 8C and D. The average control current was −14 ± 20 pA (n = 4, P21) in Cs+ and +50 ± 8 pA (n = 4, P18) in TEA. Secondly, superfusion with a Ca2+-free solution now produced an increase (rather than a decrease as in Fig. 8C) in the outward K+ current, due to block of the inward Ca2+ current (ICa). ICa is evident after subtraction (Fig. 8H and I). The small outward current in the presence of a Ca2+-free solution (Fig. 8H and I, red traces) it is likely to be due to a residual IK,s that was not fully blocked by 4-AP (see Fig. 2D). A similar increase rather than a decrease in outward current upon removal of extracellular Ca2+ was observed in four apical IHCs when 30 mm BAPTA replaced 1 mm EGTA as the intracellular Ca2+ buffer (data not shown), suggesting that strong buffering also abolished IK(Ca). The block of IK(Ca) by intracellular Cs+ and by low concentrations of TEA makes the presence of SK channels unlikely. The absence of SK channels has also been previously reported in mature IHCs of the guinea-pig cochlea (Kros & Crawford, 1990; Skinner et al. 2003). This was confirmed in a few experiments similar to that of Fig. 8C in which 300 nm apamin, a concentration that fully blocked the SK current in immature IHCs (authors' unpublished observation), did not reduce the control current during 4 s voltage steps (data not shown) but instead produced a small increase in the residual K+ current (of about 20%), possibly due to an interaction with the other K+ channel blockers present (4-AP, linopirdine and IbTx).
Effects of IK,f and IK(Ca) on voltage responses under current clamp
Since IK,f is already partially activated at the resting membrane potential of mature IHCs (−73 ± 1 mV, n = 14, apical coil P22), we investigated the functional importance of the current's modulation by cytosolic Ca2+ by studying voltage responses to current clamp steps. This gives an approximate idea of the receptor potentials in response to steps of transducer current or to high-frequency auditory stimuli well above the corner frequency (f3dB) of the low-pass RC filter due to the resistance and capacitance of the cell membrane (Kros, 1996). In control conditions (apical-coil IHCs, P22, 1 mm EGTA in the intracellular solution) hyperpolarizing and depolarizing current injections from the resting membrane potential, elicited fast, graded voltage responses (Fig. 9A) as previously observed in guinea-pig (Kros & Crawford, 1990) and mouse (Kros et al. 1998) IHCs. Current steps larger than about 1000 pA, but well inside the range of transducer currents expected in vivo (Kennedy et al. 2003), caused an initial fast voltage transient (Fig. 9A, 2000 pA) which declined to a steady level of around −45 mV. When age-matched IHCs were recorded in the presence of 30 mm BAPTA instead of 1 mm EGTA in the intracellular solution, both hyperpolarizing and depolarizing current steps caused larger but slower voltage responses (Fig. 9B). Although the reduced IK,f affects the receptor potential, the resting membrane potential of IHCs was not significantly altered by changing the intracellular Ca2+ buffer (1 mm EGTA: −73 ± 1 mV, n = 14, P22; 30 mm BAPTA: −75 ± 1 mV, n = 14, P22). This is consistent with previous experiments in which the resting potential was also not significantly affected when IK,f was fully blocked using IbTx or TEA (Marcotti et al. 2003a). Figure 9C shows currents under voltage clamp in the presence of 1 mm EGTA or 30 mm BAPTA for the same two IHCs shown in Fig. 9A and B. While IK,f was large in the presence of 1 mm EGTA (Fig. 9C, top panel) it was almost completely abolished when 30 mm BAPTA was used as seen from the lack of the initial fast current (Fig. 9C, bottom panel). In this cell 30 mm BAPTA was particularly effective for an apical-coil IHC, but qualitatively similar results were obtained in all 14 cells tested under this buffering condition.
To quantify the effects of BAPTA on kinetics of the voltage responses we fitted single exponentials to their onsets, over a range of injected currents between −100 pA and +500 pA, when either 1 mm EGTA or 30 mm BAPTA were used. The fits shown in Fig. 9D are to the voltage responses elicited using a 100 pA depolarizing current injection for the same IHCs as in A and B. The average time constants of the voltage responses measured in apical-coil IHCs (Fig. 9E) in the presence of 1 mm EGTA (n = 11, P22) were significantly faster (P < 0.001) than those obtained when 30 mm BAPTA was used (n = 10, P22). With 30 μm ryanodine in the intracellular solution the time constants of apical-coil IHCs (n = 5, P22) were intermediate (data not shown) in that they were also slowed compared to 1 mm EGTA (P < 0.001), but were faster than in the presence of 30 mm BAPTA (P < 0.005). The relation between injected current and the resulting membrane potential, measured at the peak and at the steady state (40 ms) of the responses in the presence of the two Ca2+ buffers, is shown in Fig. 9F. Significantly larger voltage responses over the entire range of injected currents between −100 pA and +2000 pA were obtained when 30 mm BAPTA was used instead of 1 mm EGTA (P < 0.0001, both for steady-state and peak responses). When 30 μm ryanodine was used in the intracellular solution (apical-coil IHCs, n = 8, P22) the voltage responses were again intermediate relative to the other two conditions.
Because reducing the size of IK,f by 30 mm BAPTA or blocking it altogether with TEA or IbTx had a negligible effect on the resting potential it might be assumed that its conductance at this potential is very small compared to that of, in particular, IK,n, which is about 70% activated at the resting potential (Marcotti et al. 2003a; Oliver et al. 2003). This is not the case as can be appreciated from the effects of 30 mm BAPTA near the resting potential: it alters both the membrane time constant (Fig. 9E) and the slope of the voltage–current relationship (Fig. 9G). As the peak and steady-state slope conductances were near identical for small current injections, we only quote steady-state values: 9.2 ± 1.0 nS (n = 14) in 1 mm EGTA and 5.1 ± 0.2 nS (n = 14) in 30 mm BAPTA (P < 0.001), near the resting potential. Consistent with this difference in slope conductance, the average membrane time constants for small (±10 pA) current injections were 1.6 ms in EGTA and 3.1 ms in 30 mm BAPTA (from Fig. 9E). IK,f thus contributes about 50% of the resting conductance of IHCs. The likely explanation for the lack of effect on the resting potential of blocking IK,f is that its reversal potential (−71.0 ± 1.4 mV, n = 5, calculated from tail currents following a 2 ms step to around −20 mV) is closer to the resting potential than that for IK,n (−78.8 ± 1.3 mV, n = 13, calculated from the current blocked by 100 μm linopirdine).
Finally we tested the contribution of IK(Ca) under current clamp by comparing voltage responses in the same IHCs (n = 6, P21–P22, apical coil) before and during superfusion with a Ca2+-free extracellular solution. No significant differences were observed over the range of injected currents (40 ms steps) between −100 pA and +2000 pA, for either steady-state or peak responses, although there was a systematic 1 mV depolarizing shift in zero Ca2+ (data not shown). This negligible effect of IK(Ca) is most likely due to its small size relative to the other K+ conductances.
Discussion
IK,f is modulated by cytosolic but not by extracellular Ca2+
Around the onset of hearing, IHCs of the mouse cochlea start to express the rapidly activating outward K+ current IK,f. This current appears to be of particular importance for mature mammalian cochlear IHCs since it is a major component of the outward K+ current of both guinea-pig and mouse IHCs (Kros & Crawford, 1990; Kros et al. 1998). Although IK,f was found to be extremely sensitive to IbTx (Kros et al. 1998), therefore showing the typical pharmacology of Ca2+-activated K+ currents of the BK family (Kaczorowski et al. 1996), the apparent inability of extracellular Ca2+ to modulate its activation remained one of the unsolved questions in IHC physiology.
Membrane currents carried by BK channels have been recorded in hair cells from different species and are normally reduced in size when a Ca2+-free solution is superfused onto these cells (Hudspeth & Lewis, 1988; Fuchs & Evans, 1990; Fuchs & Sokolowski, 1990; Art et al. 1993; Armstrong & Roberts, 2001) or when a high concentration of intracellular BAPTA is used (Ricci et al. 2000). The fact that intracellular BAPTA affects the amplitude and kinetic properties of IK,f indicates the direct dependence of K,f channels on cytosolic Ca2+. The apparent inability of extracellular Ca2+, flowing through voltage-gated Ca2+ channels, to affect IK,f (Fig. 3 and Kros & Crawford, 1990) can be tentatively explained by a lack of colocalization between Ca2+ and K,f channels. Although it appears to be missing in mammalian IHCs, colocalization between Ca2+ and BK channels is an important requirement in lower vertebrate hair cells in order to set their intrinsic resonant frequency (Art & Fettiplace, 1987; Hudspeth & Lewis, 1988; Fuchs & Evans, 1990; Roberts et al. 1990). In mouse IHCs the absence of a direct interaction between Ca2+ and K,f channels is also suggested by the more hyperpolarized activation of IK,f (starting at about −85 mV defined as 1% of gmax in the presence of EGTA as the intracellular Ca2+ buffer: Fig. 6F and Oliver et al. 2003) compared to that of the Ca2+ current (positive to −65 mV: Platzer et al. 2000; Marcotti et al. 2003b) recorded in the presence of 1.3 mm Ca2+.
The question arises whether the intracellular Ca2+ concentration around the K,f channels is constant or whether it varies as a function of membrane potential. A constant Ca2+ concentration is unlikely because the slope of the activation curves, at around 8–10 mV per e-fold change in potential (Figs 5D and 6G), is considerably steeper than that of BK channels studied in inside-out patches from IHCs at a constant Ca2+ concentration (18 mV: Oliver et al. 2003). The very hyperpolarized activation and the faster activation kinetics of IK,f (Fig. 6F control and Fig. 2F, respectively) compared to those recorded for BK channels in lower-vertebrate hair cells (Art & Fettiplace, 1987; Hudspeth & Lewis, 1988; Fuchs & Evans, 1990) suggest that in mammalian IHCs IK,f might be modulated in a voltage-dependent manner by Ca2+ coming from a source other than through L-type Ca2+ channels. Using ryanodine or a mixture of thapsigargin and caffeine in the intracellular solution we demonstrate a role for intracellular Ca2+ stores, known to be present in immature mouse cochlear IHCs (Kennedy & Meech, 2002), in regulating the Ca2+ concentration around the K,f channel and thus influencing the activation of IK,f. Our findings demonstrate the continued presence of intracellular Ca2+ stores in mature IHCs. There may be some parallels with the coupling of BK channels and ryanodine receptors in smooth muscle (Pérez et al. 1999). Release of Ca2+ from intracellular stores can be induced by Ca2+ influx through the cell membrane, for example in smooth and cardiac muscle excitation–contraction coupling (Bolton et al. 1999; Lamb, 2000). As IK,f is unaffected by the removal of extracellular Ca2+ another trigger for Ca2+ release from the stores has to be postulated. In skeletal muscle Ca2+ release from the stores does not depend on extracellular Ca2+ but is mediated by voltage sensors acting on RyR1 ryanodine receptors (Lamb, 2000). It is possible that a similar voltage-dependent mechanism operates in IHCs and it would be interesting to examine the subtypes of ryanodine receptors in these cells.
In the presence of 1 mm BAPTA IK,f has a more depolarized activation than in 1 mm EGTA (Fig. 6H). Although BAPTA and EGTA have similar affinities for Ca2+, BAPTA has a much higher binding rate constant (Naraghi & Neher, 1997). The faster association kinetics enable BAPTA to buffer increases in intracellular Ca2+ closer to the source of Ca2+ (Neher, 1998). Therefore the different effects observed in the presence of the same concentration (1 mm) of either of the two buffers suggests that the increase in cytosolic Ca2+, required for the activation of IK,f, originates in the close vicinity of the K,f channels. From Naraghi & Neher's (1997) estimate of the space constant for 2 mm BAPTA of 28 nm, the space constant for 1 mm BAPTA would be about greater (see eqn (2) in Neher, 1998). Considering then that 1 mm BAPTA significantly shifted the activation curve of IK,f when compared to 0.1 mm BAPTA (Fig. 5) we estimate that the Ca2+ source is in the order of 40 nm away from the K,f channels. Such a distance is compatible with the very rapid submillisecond activation and deactivation kinetics of the K,f channels which may be in part Ca2+ dependent as they are slowed down and speeded up, respectively, by increasing the BAPTA concentration (Figs 2F and 5E and F). However, it is equally possible that the gating kinetics of IK,f depend on a dynamic equilibrium for cytosolic Ca2+ in the vicinity of the channels. Store depletion would then cause a decrease in cytosolic Ca2+ at the K,f channels at steady state at any given potential, thus altering gating kinetics in the same fashion as increasing the BAPTA concentration. Although the results presented in this paper show that Ca2+ released from intracellular stores is involved in the activation of IK,f at negative potentials, other mechanisms could also be involved. For example, protein kinase A (PKA) produced a hyperpolarizing shift in IK,f activation (Jagger & Ashmore, 1999). PKA could potentially act on phosphorylation sites present on both α- and β-subunits and therefore increase the Ca2+ sensitivity of the BK channel directly (Toro et al. 1998) or indirectly via activating ryanodine receptors (Reiken et al. 2003).
It thus appears that IHCs are different from auditory hair cells in lower vertebrates in that the majority of BK channels are not coupled to the L-type Ca2+ channels that regulate neurotransmitter release (Moser & Beutner, 2000). This leads to a more hyperpolarized activation of IK,f than that of ICa, by about 20 mV, and prevents electrical resonance, important for frequency tuning in auditory hair cells of various lower vertebrates, conceivably because electrical resonance would become progressively less efficient for frequencies above a few kilohertz (Wu et al. 1995). The contribution of IK,f to the membrane's RC time constant at a given potential can be appreciated by comparing the steady-state slope conductances in 1 mm EGTA and 30 mm BAPTA (Fig. 9F and G). Due to the voltage-dependent activation of the membrane currents, the time constants become faster with depolarization of the membrane potential. Assuming a more depolarized resting potential in vivo (due to the resting transducer current) of say −55 mV, the membrane time constants were 0.30 ms in 1 mm EGTA and 0.82 ms in 30 mm BAPTA. This corresponds to corner frequencies of the low-pass membrane filter of about 530 Hz and 190 Hz, respectively, at this potential. Activation of IK,f by intracellular Ca2+ is thus essential for high-frequency phase locking in the auditory nerve (Palmer & Russell, 1986). The corner frequency of 530 Hz is within the range of 480–940 Hz previously found for guinea-pig IHCs at this potential (Kros & Crawford, 1990).
Mature IHCs express an additional Ca2+-activated K+ current that is sensitive to extracellular Ca2+
An outward K+ current sensitive to Ca2+ influx through L-type Ca2+ channels was isolated even when all major K+ currents expressed in mature IHCs (IK,s, IK,n and IK,f) were blocked (Fig. 8C and D). These results indicate that mature mouse IHCs express, in addition to IK,f, a Ca2+-activated K+ current (IK(Ca)) with different pharmacological and kinetic properties and sensitivity to extracellular Ca2+. A small current with activation kinetics slower than IK,f has been identified in IHCs of the guinea-pig where it could be reduced in size when Ca2+ channels were blocked by nifedipine (Dulon et al. 1995). Similar to our findings, this small current also showed slower activation when compared with the IbTx-sensitive current (IK,f) isolated in guinea-pig IHCs (Skinner et al. 2003). IHCs of the mouse and guinea-pig might thus express two distinct types of Ca2+-activated K+ current only one of which (IK(Ca)) appears to be colocalized with voltage-gated Ca2+ channels (Fig. 10). The finding that IK(Ca) was larger and activated more rapidly in basal than in apical IHCs in response to 170 ms voltage steps suggests there may be more L-type Ca2+ channels and a higher afferent innervation density in high-frequency basal IHCs, as found for turtle auditory hair cells (Ricci et al. 2000). A tonotopic gradient in afferent innervation has been found in the feline cochlea (Liberman et al. 1990), but it is not known whether this also applies to the mouse. The slow increase in IK(Ca) on a time scale of seconds may be due to local buffer saturation and hence accumulation of Ca2+ near the IK(Ca) channels (Ricci et al. 2000). Since IK(Ca) could still be isolated when IbTx (up to 60 nm) and apamin (300 nm) were used, its exact nature remains unclear although BK channels with a very low sensitivity to IbTx have recently been described in hair cells of the bullfrog sacculus (Armstrong & Roberts, 2001). Additional evidence for the presence of BK rather than SK channels underlying IK(Ca) comes from experiments in which extracellular TEA (5 mm) or a Cs+-based intracellular solution was used. TEA is a general blocker for a variety of K+ currents including the Ca2+-activated K+ current although its potency depends on the type of channel being investigated (Hille, 2001). While BK channels are usually blocked by submillimolar concentrations of TEA the block of the SK channel requires higher concentrations (> 20 mm: Sah, 1996). A similar variability in the blocking sensitivity for Ca2+-activated K+ channels also exists with respect to Cs+, with BK channels being blocked by the ion whereas a large Cs+ current can flow through SK channels of rat adrenal chromaffin cells (Park, 1994) and hair cells from the guinea-pig (Erostegui et al. 1994). In contrast to IK,f this smaller and slower IK(Ca) is influenced by Ca2+ entering the cell through the L-type Ca2+ channels and appears to be insensitive to Ca2+ released from intracellular stores. Its function in IHCs is at present not clear as it did not affect voltage responses to 40 ms current injections, but it may turn out to play some role on a longer time scale, for example in regulating neurotransmitter release.
Figure 10. Two mechanisms of activation of Ca2+-activated K+ channels in mature IHCs.

Schematic representation showing the presence in mature IHCs of two different Ca2+-activated K+ currents: IK(Ca) and the larger and faster IK,f. The experiments described in this paper are consistent with IK,f being activated by cytoplasmic Ca2+ regulated by intracellular stores and IK(Ca) being directly activated by Ca2+ flowing into the cell through voltage-gated Ca2+ channels.
Structure and modulation of BK channels
Large-conductance voltage and Ca2+-activated K+ channels can be expressed as either the integral membrane pore-forming α-subunit alone or as a complex of the α-subunit and the regulatory β-subunit (Vergara et al. 1998; Orio et al. 2002). When coexpressed with the α-subunit, the transmembrane β-subunit produces a hyperpolarizing shift in the voltage range of channel activation by increasing its apparent Ca2+ sensitivity although this is usually accompanied by a slowing of the activation and deactivation kinetics (Meera et al. 1996). Functional differences between BK channels (such as Ca2+ sensitivity and kinetics) can be explained either by the expression of splice variants of the same gene encoding the α-subunit (Saito et al. 1997) or by differential association with modulatory β-subunits (McManus et al. 1995; Meera et al. 1996). To date, four distinct auxiliary β-subunits for the BK channel have been cloned and are named β1–β4 (Orio et al. 2002). Of these subunits β2 and β3 confer fast inactivation with a time constant in the order of milliseconds (Xia et al. 2000; Armstrong & Roberts, 2001; Bentrop et al. 2001) upon the BK channels when coexpressed with the α-subunit, and are thus inconsistent with the non-inactivating (in response to voltage steps up to 170 ms) Ca2+-activated K+ currents in IHCs, IK,f (Fig. 2B, C) and IK(Ca) (Fig. 7H).
BK channels in hair cells
Recent findings in chick and turtle cochlear hair cells have shown the expression, along the tonotopic axis of the sensory epithelium, of various BK channel isoforms with different kinetic properties (Navaratnam et al. 1997; Rosenblatt et al. 1997; Jones et al. 1998; Ramanathan et al. 1999). Moreover, the coexpression of the different α-subunit splice variants with the modulatory β-subunit, predicted only to occur in the apical, low-frequency portion of the chick and turtle cochlea (Jones et al. 1999; Ramanathan et al. 1999, 2000), increased the Ca2+ sensitivity of the channel and slowed the current kinetics (Jones et al. 1999; Ramanathan et al. 2000).
Our electrophysiological findings are consistent with the expression of two different populations of Ca2+-activated K+ channels in IHCs that differ in their activation kinetics, sensitivity to IbTx and nature of Ca2+ dependence (Fig. 10). If IK,f and IK(Ca) both flow through BK channels the differences between the two channel populations might be related to splice variance of the α-subunit, the presence or absence of a β-subunit, or the association with different β-subunits. Mammalian IHCs show only a minimal internal splice variance of the α-subunit (Langer et al. 2003) but they express the modulatory β1 and β4 subunits and not β2 and β3, in agreement with our electrophysiological experiments indicating that neither IK,f nor IK(Ca) showed significant inactivation. While β1 is expressed from around the onset of hearing, β4 appears to be only present in immature mouse IHCs (Langer et al. 2003). Therefore, the most obvious hypothesis consistent with the literature is that the rapidly activating IK,f is only composed of the α-subunit while the slower IK(Ca) is carried by the coexpression of α and β1. The β1 subunit has been reported to confer a reduced sensitivity to IbTx (Dworetzky et al. 1996) when compared to the α-subunit alone.
Acknowledgments
This work was supported by the MRC.
References
- Appenrodt P, Kros CJ. Single-channel recordings of large conductance Ca2+-activated K+ channels from guinea-pig inner hair cells. J Physiol. 1997;501.P:147. P. [Google Scholar]
- Armstrong CE, Roberts WM. Rapidly inactivating and non-inactivating calcium-activated potassium currents in frog saccular hair cells. J Physiol. 2001;536:49–65. doi: 10.1111/j.1469-7793.2001.00049.x. [DOI] [PMC free article] [PubMed] [Google Scholar]
- Art JJ, Fettiplace R. Variation of membrane properties in hair cells isolated from the turtle cochlea. J Physiol. 1987;385:207–242. doi: 10.1113/jphysiol.1987.sp016492. [DOI] [PMC free article] [PubMed] [Google Scholar]
- Art JJ, Fettiplace R, Wu Y-C. The effects of low calcium on the voltage-dependent conductances involved in tuning of turtle hair cells. J Physiol. 1993;470:109–126. doi: 10.1113/jphysiol.1993.sp019850. [DOI] [PMC free article] [PubMed] [Google Scholar]
- Bentrop D, Beyermann M, Wissmann R, Fakler B. NMR structure of the ‘ball-and-chain’ domain of KCNMB2, the β2-subunit of large conductance Ca2+- and voltage-activated potassium channels. J Biol Chem. 2001;276:42116–42121. doi: 10.1074/jbc.M107118200. [DOI] [PubMed] [Google Scholar]
- Blaustein MP, Goldman DE. The action of certain polyvalent cations on the voltage-clamped lobster axon. J General Physiol. 1968;51:279–291. doi: 10.1085/jgp.51.3.279. [DOI] [PMC free article] [PubMed] [Google Scholar]
- Bolton TB, Prestwich SA, Zholos AV, Gordienko DV. Excitation-contraction coupling in gastrointestinal and other smooth muscles. Annu Rev Physiol. 1999;61:85–115. doi: 10.1146/annurev.physiol.61.1.85. [DOI] [PubMed] [Google Scholar]
- Dulon D, Sugasawa M, Blanchet C, Erostegui C. Direct measurements of Ca2+-activated K+ currents in inner hair cells of the guinea-pig cochlea using photolabile Ca2+ chelators. Pflugers Arch. 1995;430:365–373. doi: 10.1007/BF00373911. [DOI] [PubMed] [Google Scholar]
- Dworetzky SI, Boissard CG, Lum-Ragan JT, McKay MC, Post-Munson DJ, Trojnacki JT, Chang CP, Gribkoff VK. Phenotypic alteration of a human BK (hSlo) channel by hSlobeta subunit coexpression: changes in blocker sensitivity, activation/relaxation and inactivation kinetics, and protein kinase A modulation. J Neurosci. 1996;16:4543–4550. doi: 10.1523/JNEUROSCI.16-15-04543.1996. [DOI] [PMC free article] [PubMed] [Google Scholar]
- Ehret G. Masked auditory thresholds, critical ratios, and scales of the basilar membrane of the housemouse (Mus musculus) J Comp Physiol. 1975;103:329–341. [Google Scholar]
- Erostegui C, Nenov AP, Norris CH, Bobbin RP. Acetylcholine activates a K+ conductance permeable to Cs+ in guinea pig outer hair cells. Hear Res. 1994;81:119–129. doi: 10.1016/0378-5955(94)90159-7. [DOI] [PubMed] [Google Scholar]
- Fuchs PA, Evans MG. Potassium currents in hair cells isolated from the cochlea of the chick. J Physiol. 1990;429:529–551. doi: 10.1113/jphysiol.1990.sp018271. [DOI] [PMC free article] [PubMed] [Google Scholar]
- Fuchs PA, Nagai T, Evans MG. Electrical tuning in hair cells isolated from the chick cochlea. J Neurosci. 1988;8:2460–2467. doi: 10.1523/JNEUROSCI.08-07-02460.1988. [DOI] [PMC free article] [PubMed] [Google Scholar]
- Fuchs PA, Sokolowski BH. The acquisition during development of Ca-activated potassium currents by cochlear hair cells of the chick. Proc R Soc Lond B. 1990;241:122–126. doi: 10.1098/rspb.1990.0075. [DOI] [PubMed] [Google Scholar]
- Hille B. Ionic Channels of Excitable Membranes. 3. Sunderland, MA, USA: Sinauer; 2001. [Google Scholar]
- Hudspeth AJ, Lewis RS. Kinetic analysis of voltage- and ion-dependent conductances in saccular hair cells of the bull-frog, Rana catesbeiana. J Physiol. 1988;400:237–274. doi: 10.1113/jphysiol.1988.sp017119. [DOI] [PMC free article] [PubMed] [Google Scholar]
- Jagger DJ, Ashmore JF. The fast activating potassium current, IK,f, in guinea-pig inner hair cells is regulated by protein kinase A. Neurosci Lett. 1999;263:145–148. doi: 10.1016/s0304-3940(99)00128-7. [DOI] [PubMed] [Google Scholar]
- Jones EM, Gray-Keller M, Fettiplace R. The role of Ca2+-activated K+ channel spliced variants in the tonotopic organization of the turtle cochlea. J Physiol. 1999;518:653–665. doi: 10.1111/j.1469-7793.1999.0653p.x. [DOI] [PMC free article] [PubMed] [Google Scholar]
- Jones EM, Laus C, Fettiplace R. Identification of Ca2+-activated K+ channel splice variants and their distribution in the turtle cochlea. Proc R Soc Lond B. 1998;265:685–692. doi: 10.1098/rspb.1998.0348. [DOI] [PMC free article] [PubMed] [Google Scholar]
- Kaczorowski GJ, Knaus HG, Leonard RJ, McManus OB, Garcia ML. High-conductance calcium-activated potassium channels; structure, pharmaccology, and function. J Bioenerg Biomembr. 1996;28:255–267. doi: 10.1007/BF02110699. [DOI] [PubMed] [Google Scholar]
- Kennedy HJ, Evans MG, Crawford AC, Fettiplace R. Fast adaptation of mechanoelectrical transducer channels in mammalian cochlear hair cells. Nat Neurosci. 2003;6:832–836. doi: 10.1038/nn1089. [DOI] [PubMed] [Google Scholar]
- Kennedy HJ, Meech RW. Fast Ca2+ signals at mouse inner hair cell synapse: a role for Ca2+-induced Ca2+ release. J Physiol. 2002;539:15–23. doi: 10.1113/jphysiol.2001.013171. [DOI] [PMC free article] [PubMed] [Google Scholar]
- Kimitsuki T, Kawano K, Matsuda K, Haruta A, Nakajima T, Komune S. Potassium current properties in apical and basal inner hair cells from guinea-pig cochlea. Hear Res. 2003;180:85–90. doi: 10.1016/s0378-5955(03)00109-6. [DOI] [PubMed] [Google Scholar]
- Kros CJ. Physiology of mammalian cochlear hair cells. In: Dallos P, Popper AN, Fay RR, editors. The Cochlea. New York: Springer; 1996. pp. 318–385. [Google Scholar]
- Kros CJ, Crawford AC. Potassium currents in inner hair cells isolated from the guinea-pig cochlea. J Physiol. 1990;421:263–291. doi: 10.1113/jphysiol.1990.sp017944. [DOI] [PMC free article] [PubMed] [Google Scholar]
- Kros CJ, Ruppersberg JP, Rüsch A. Expression of a potassium current in inner hair cells during development of hearing in mice. Nature. 1998;394:281–284. doi: 10.1038/28401. [DOI] [PubMed] [Google Scholar]
- Lamb GD. Excitation-contraction coupling in skeletal muscle: comparisons with cardiac muscle. Clin Exp Pharmacol Physiol. 2000;27:216–224. doi: 10.1046/j.1440-1681.2000.03224.x. [DOI] [PubMed] [Google Scholar]
- Langer P, Grunder S, Rüsch A. Expression of Ca2+-activated BK channel mRNA and its splice variants in the rat cochlea. J Comp Neurol. 2003;455:198–209. doi: 10.1002/cne.10471. [DOI] [PubMed] [Google Scholar]
- Lewis RS, Hudspeth AJ. Voltage- and ion-dependent conductances in solitary vertebrate hair cells. Nature. 1983;304:538–541. doi: 10.1038/304538a0. [DOI] [PubMed] [Google Scholar]
- Liberman MC, Dodds LW, Pierce S. Afferent and efferent innervation of the cochlea: quantitative analysis with light and electron microscopy. J Comp Neurol. 1990;301:443–460. doi: 10.1002/cne.903010309. [DOI] [PubMed] [Google Scholar]
- Marcotti W, Johnson SL, Holley MC, Kros CJ. Developmental changes in the expression of potassium currents of embryonic, neonatal and mature mouse inner hair cells. J Physiol. 2003a;548:383–400. doi: 10.1113/jphysiol.2002.034801. [DOI] [PMC free article] [PubMed] [Google Scholar]
- Marcotti W, Johnson SL, Rüsch A, Kros CJ. Sodium and calcium currents shape action potentials in immature mouse inner hair cells. J Physiol. 2003b;552:743–761. doi: 10.1113/jphysiol.2003.043612. [DOI] [PMC free article] [PubMed] [Google Scholar]
- McManus OB, Helms LM, Pallanck L, Ganetzky B, Swanson R, Leonard RJ. Functional role of the beta subunit of high conductance calcium-activated potassium channels. Neuron. 1995;14:645–650. doi: 10.1016/0896-6273(95)90321-6. [DOI] [PubMed] [Google Scholar]
- Meera P, Wallner M, Jiang Z, Toro L. A calcium switch for the functional coupling between alpha (hslo) and beta subunits (KV,Ca beta) of maxi K channels. FEBS Lett. 1996;382:84–88. doi: 10.1016/0014-5793(96)00151-2. [DOI] [PubMed] [Google Scholar]
- Meissner G. Ryanodine activation and inhibition of the Ca2+ release channel of sarcoplasmic reticulum. J Biol Chem. 1986;261:6300–6306. [PubMed] [Google Scholar]
- Moser T, Beutner D. Kinetics of exocytosis and endocytosis at the cochlear inner hair cell afferent synapse of the mouse. Proc Natl Acad Sci U S A. 2000;97:883–888. doi: 10.1073/pnas.97.2.883. [DOI] [PMC free article] [PubMed] [Google Scholar]
- Naraghi M, Neher E. Linearized buffered Ca2+ diffusion in microdomains and its implications for calculation of [Ca2+] at the mouth of a calcium channel. J Neurosci. 1997;17:6961–6973. doi: 10.1523/JNEUROSCI.17-18-06961.1997. [DOI] [PMC free article] [PubMed] [Google Scholar]
- Navaratnam DS, Bell TJ, Tu TD, Cohen EL, Oberholtzer JC. Differential distribution of Ca2+-activated K+ channel splice variants among hair cells along the tonotopic axis of the chick cochlea. Neuron. 1997;19:1077–1085. doi: 10.1016/s0896-6273(00)80398-0. [DOI] [PubMed] [Google Scholar]
- Neher E. Vesicle pools and Ca2+ microdomains: new tools for understanding their roles in neurotransmitter release. Neuron. 1998;20:389–399. doi: 10.1016/s0896-6273(00)80983-6. [DOI] [PubMed] [Google Scholar]
- Oliva C, Cohen IS, Mathias RT. Calculation of time constants for intracellular diffusion in whole cell patch clamp configuration. Biophys J. 1988;54:791–799. doi: 10.1016/S0006-3495(88)83017-0. [DOI] [PMC free article] [PubMed] [Google Scholar]
- Oliver D, Knipper M, Derst C, Fakler B. Resting potential and submembrane calcium concentration of inner hair cells in the isolated mouse cochlea are set by KCNQ-type potassium channels. J Neurosci. 2003;23:2141–2149. doi: 10.1523/JNEUROSCI.23-06-02141.2003. [DOI] [PMC free article] [PubMed] [Google Scholar]
- Orio P, Rojas P, Ferreira G, Latorre R. New disguises for an old channel: MaxiK channel beta-subunits. News Physiol Sci. 2002;17:156–161. doi: 10.1152/nips.01387.2002. [DOI] [PubMed] [Google Scholar]
- Palmer AR, Russell IJ. Phase-locking in the cochlear nerve of the guinea-pig and its relation to the receptor potential of inner hair-cells. Hear Res. 1986;24:1–15. doi: 10.1016/0378-5955(86)90002-x. [DOI] [PubMed] [Google Scholar]
- Park YB. Ion selectivity and gating of small conductance Ca2+-activated K+ channels in cultured rat adrenal chromaffin cells. J Physiol. 1994;481:555–570. doi: 10.1113/jphysiol.1994.sp020463. [DOI] [PMC free article] [PubMed] [Google Scholar]
- Pérez GJ, Bonev AD, Patlak JB, Nelson MT. Functional coupling of ryanodine receptors to KCa channels in smooth muscle cells from rat cerebral arteries. J General Physiol. 1999;113:229–238. doi: 10.1085/jgp.113.2.229. [DOI] [PMC free article] [PubMed] [Google Scholar]
- Platzer J, Engel J, Schrott-Fischer A, Stephan K, Bova S, Chen H, Zheng H, Striessnig J. Congenital deafness and sinoatrial node dysfunction in mice lacking class D L-type Ca2+ channels. Cell. 2000;102:89–97. doi: 10.1016/s0092-8674(00)00013-1. [DOI] [PubMed] [Google Scholar]
- Pozzan T, Rizzuto R, Volpe P, Meldolesi J. Molecular and cellular physiology of intracellular calcium stores. Physiol Rev. 1994;74:595–636. doi: 10.1152/physrev.1994.74.3.595. [DOI] [PubMed] [Google Scholar]
- Ramanathan K, Michael TH, Fuchs PA. β subunits modulate alternatively spliced, large conductance, calcium-activated potassium channels of avian hair cells. J Neurosci. 2000;20:1675–1684. doi: 10.1523/JNEUROSCI.20-05-01675.2000. [DOI] [PMC free article] [PubMed] [Google Scholar]
- Ramanathan K, Michael TH, Jiang GJ, Hiel H, Fuchs PA. A molecular mechanism for electrical tuning of cochlear hair cells. Science. 1999;283:215–217. doi: 10.1126/science.283.5399.215. [DOI] [PubMed] [Google Scholar]
- Reiken S, Lacampagne A, Zhou H, Kherani A, Lehnart SE, Ward C, Huang F, Gaburjakova M, Gaburjakova J, Rosemblit N, Warren MS, He KL, Yi GH, Wang J, Burkhoff D, Vassort G, Marks AR. PKA phosphorylation activates the calcium release channel (ryanodine receptor) in skeletal muscle: defective regulation in heart failure. J Cell Biol. 2003;160:919–928. doi: 10.1083/jcb.200211012. [DOI] [PMC free article] [PubMed] [Google Scholar]
- Ricci AJ, Gray-Keller M, Fettiplace R. Tonotopic variations of calcium signalling in turtle auditory hair cells. J Physiol. 2000;524:423–436. doi: 10.1111/j.1469-7793.2000.00423.x. [DOI] [PMC free article] [PubMed] [Google Scholar]
- Roberts WM, Jacobs RA, Hudspeth AJ. Colocalization of ion channels involved in frequency selectivity and synaptic transmission at presynaptic active zones of hair cells. J Neurosci. 1990;10:3664–3684. doi: 10.1523/JNEUROSCI.10-11-03664.1990. [DOI] [PMC free article] [PubMed] [Google Scholar]
- Rosenblatt KP, Sun ZP, Heller S, Hudspeth AJ. Distribution of Ca2+-activated K+ channel isoforms along the tonotopic gradient of the chicken's cochlea. Neuron. 1997;19:1061–1075. doi: 10.1016/s0896-6273(00)80397-9. [DOI] [PubMed] [Google Scholar]
- Sah P. Ca2+-activated K+ currents in neurones: types, physiological roles and modulation. Trends Neurosci. 1996;19:150–154. doi: 10.1016/s0166-2236(96)80026-9. [DOI] [PubMed] [Google Scholar]
- Saito M, Nelson C, Salkoff L, Lingle CJ. A cysteine-rich domain defined by a novel exon in a slo variant in rat adrenal chromaffin cells and PC12 cells. J Biol Chem. 1997;272:11710–11717. doi: 10.1074/jbc.272.18.11710. [DOI] [PubMed] [Google Scholar]
- Santos-Sacchi J, Huang GJ, Wu M. Mapping the distribution of outer hair cell voltage-dependent conductances by electrical amputation. Biophys J. 1997;73:1424–1429. doi: 10.1016/S0006-3495(97)78174-8. [DOI] [PMC free article] [PubMed] [Google Scholar]
- Skinner LJ, Enee V, Beurg M, Jung HH, Ryan AF, Hafidi A, Aran JM, Dulon D. Contribution of BK Ca2+-activated K+ channels to auditory neurotransmission in the guinea pig cochlea. J Neurophysiol. 2003;90:320–332. doi: 10.1152/jn.01155.2002. [DOI] [PubMed] [Google Scholar]
- Thastrup O. Role of Ca2+-ATPases in regulation of cellular Ca2+ signalling, as studied with the selective microsomal Ca2+-ATPase inhibitor, thapsigargin. Agents Actions. 1990;29:8–15. doi: 10.1007/BF01964706. [DOI] [PubMed] [Google Scholar]
- Toro L, Wallner M, Meera P, Tanaka Y. Maxi-K(Ca), a unique member of the voltage-gated K channel superfamily. News Physiol Sci. 1998;13:112–117. doi: 10.1152/physiologyonline.1998.13.3.112. [DOI] [PubMed] [Google Scholar]
- Vergara C, Latorre R, Marrion NV, Adelman JP. Calcium-activated potassium channels. Curr Opin Neurobiol. 1998;8:321–319. doi: 10.1016/s0959-4388(98)80056-1. [DOI] [PubMed] [Google Scholar]
- Verkhratsky A. The endoplasmic reticulum and neuronal calcium signalling. Cell Calcium. 2002;32:393–404. doi: 10.1016/s0143416002001896. [DOI] [PubMed] [Google Scholar]
- Wu YC, Art JJ, Goodman MB, Fettiplace R. A kinetic description of the calcium-activated potassium channel and its application to electrical tuning of hair cells. Prog Biophys Mol Biol. 1995;63:131–158. doi: 10.1016/0079-6107(95)00002-5. [DOI] [PubMed] [Google Scholar]
- Xia X-M, Ding J-P, Zeng X-H, Duan K-L, Lingle CJ. Rectification and rapid activation at low Ca2+ of Ca2+-activated, voltage-dependent BK currents: consequences of rapid inactivation by a novel β subunit. J Neurosci. 2000;20:4890–4903. doi: 10.1523/JNEUROSCI.20-13-04890.2000. [DOI] [PMC free article] [PubMed] [Google Scholar]