

Abstract
During long-term potentiation (LTP) at mossy fibre–granule cell synapses in rat cerebellum synaptic transmission and granule cell intrinsic excitability are enhanced. Although it is clear that changes in granule cell excitability are mediated postsynaptically, there is as yet no direct evidence for the site and mechanism of changes in transmission. To approach this problem, evoked postsynaptic currents (EPSCs) and miniature synaptic currents (mEPSCs) were recorded by patch-clamp in cerebellar slices obtained from P17–P23 rats. LTP was induced by theta-burst stimulation paired with depolarization. During LTP, the EPSCs showed a significant decrease in the coefficient of variation (CV; 28.9 ± 5.2%, n = 8; P < 0.002), the number of failures (87.1 ± 41.9%, n = 8; P < 0.04), and the paired-pulse ratio (PPR; 25.5 ± 4.1%n = 5; P < 0.02). Similar changes were observed by increasing neurotransmitter release (extracellular solutions with high Ca2+/Mg2+ ratio), whereas increases in CV, numbers of failures and PPR occurred when release was decreased (extracellular solutions with low Ca2+/Mg2+ ratio; 10 μm Cl-adenosine). No changes followed modifications of postsynaptic holding potentials, while CV and failures were reduced when the number of active synapses was increased. LTP was prevented by use of solutions with high Ca2+/Mg2+ ratio. Moreover, LTP and the associated CV decrease were observed in the spillover-mediated component of AMPA EPSCs and in NMDA EPSCs. During LTP, mEPSCs did not change in amplitude or variability but significantly increased in frequency (47.6 ± 16%, n = 4; P < 0.03). By binomial analysis changes in EPSCs were shown to be due to increased release probability (from 0.6 ± 0.08 to 0.73 ± 0.06, n = 7; P < 0.02) with a constant number of three to four releasing sites. These observations provide evidence for increased neurotransmitter release during LTP at mossy fibre–granule cell synapses.
Cerebellar synapses show numerous forms of synaptic plasticity. In addition to parallel fibre–Purkinje cell long-term depression (Hansel et al. 2001), long-term potentiation (LTP) occurs at mossy fibre–granule cell synapses. LTP is induced through postsynaptic NMDA receptor activation, postsynaptic Ca2+ increase, and nitric oxide production (D'Angelo et al. 1999; Maffei et al. 2003). The expression phase of LTP is characterized by an increase in AMPA and NMDA receptor-mediated components of EPSCs. Moreover, mossy fibre terminal and granule cell excitability are enhanced (Armano et al. 2000; Maffei et al. 2002). Nevertheless the detailed mechanism that give rise to changes in EPSCs is not established.
LTP has been accounted for at several central synapses (for review see Hawkins et al. 1993; Bliss & Collingridge, 1993; Malenka & Nicoll, 1999) by increased neurotransmitter release (Bekkers & Stevens, 1990; Malinow & Tsien, 1990; Schulz et al. 1994; Malgaroli et al. 1995; Kullmann et al. 1996; Arancio et al. 1996; Gasparini et al. 2000), or by increased postsynaptic receptor responsiveness (Manabe et al. 1992; Isaac et al. 1996; Benke et al. 1998; Hayashi et al. 2000), or both (Kullman & Nicoll, 1992; Larkman et al. 1992), or alternatively by the awakening of silent synapses (Liao et al. 1995). LTP mechanisms depend on the structural and functional organization of the synapse being investigated (Malinow, 1991; Edwards, 1995). In this respect, the cerebellar mossy fibre–granule cell relay shows some peculiar properties. Granule cells receive only three to five mossy fibre synapses (Eccles et al. 1967) and are electrotonically compact, which improves the resolution of mEPSCs and EPSCs (D'Angelo et al. 1993, 1995; Silver et al. 1996). Postsynaptic AMPA and NMDA receptors are probably not saturated by synaptically released glutamate and spillover affects the synaptic response (DiGregorio et al. 2002; Rossi et al. 2002; Cathala et al. 2003; Xu-Friedman & Regehr, 2003). Finally, silent synapses have been observed at immature but not mature developmental stages (Losi et al. 2002).
Here we show that, during mossy fibre–granule cell LTP, there are increases in AMPA and NMDA EPSCs and in spillover-mediated current. The enhanced EPSCs showed reduced variability, fewer failures, and decreased paired-pulse ratio, which mimicked changes induced by enhancing glutamate release. mEPSC amplitudes remained constant, indicating that quantum size did not change, whereas their frequency increased. Binomial statistics explained EPSC changes through a rise in release probability. These results point to an increased neurotransmitter release as the major component of cerebellar mossy fibre–granule cell LTP.
Methods
Slice preparation and solutions
All experiments were carried out according to the guidelines laid down by the institution's animal welfare committee. Patch-clamp recordings in acute cerebellar slices were performed as previously reported (D'Angelo et al. 1993, 1995, 1999; Armano et al. 2000). Briefly, 17- to 23-day-old Wistar rats were anaesthetized with halothane (Aldrich, USA) and killed by decapitation. Acute 250-μm-thick slices were cut in the sagittal plane from the cerebellar vermis in cold Krebs solution and maintained at room temperature before being transferred to a 1.5 ml recording chamber mounted on the stage of an upright microscope (Axioscope FS2; Zeiss, Germany). The preparations were perfused with Krebs solution (2 ml min−1) and maintained at 30°C with a Peltier feedback device (TC-324B, Warner Instrument Corp., Hamden, CT, USA).
Krebs solution for slice cutting and recovery contained (mm): NaCl 120, KCl 2, MgSO4 1.2, NaHCO3 26, KH2PO4 1.2, CaCl2 2, glucose 11, and was equilibrated with 95% O2 and 5% CO2 (pH 7.4). During recordings, solutions were added with the GABAA receptor blocker, 10 μm bicuculline. Local drug perfusion was performed through a multibarrelled pipette. Perfusion with control extracellular solution was commenced before seal formation and was maintained until switching to the test solutions. In some experiments, slices were pre-incubated with a low-Ca2+ solution and Ca2+ concentration was changed by bulk bath perfusion. Krebs solutions with different Ca2+ concentrations (from 1 mm to 4 mm) were prepared maintaining the total concentration of divalent cations constant by corresponding changes in Mg2+. With 6 mm Ca2+ no Mg2+ was added. The patch-clamp pipette solution contained (mm): Cs2SO4 81, NaCl 4, MgSO4 2, CaCl2 0.02, BAPTA 0.1, glucose 15, ATP-Mg 3, GTP 0.1, Hepes 15. This solution maintained resting free [Ca2+] at 100 nm and pH was adjusted to 7.2 with CsOH. Patch-clamp pipettes filled with this solution had a resistance of 5–8 MΩ before seal formation. All drugs were obtained from Sigma, except BAPTA tetrapotassium salt (Molecular Probes, Eugene, OR, USA) and 1,2,3,4-tetrahydro-6-nitro-2,3-dioxo-benzo[f]quinoxaline-7-sulphonamide disodium (NBQX; Tocris-Cookson, Avonmouth, UK).
Data recording and analysis
Granule cells were voltage-clamped at −70 mV with an Axopatch 200-B amplifier (Axon Instruments, Union City, CA, USA) and currents sampled with a Labmaster 1200B interface (low-pass filter = 10 kHz, sampling rate = 100 kHz). Mossy fibres were stimulated with a bipolar tungsten electrode or a patch pipette via an isolation unit at a frequency of 0.33 Hz–0.1 Hz. In specific experiments, the acquisition program automatically alternated EPSC with background activity recordings (1 s and 9 s, respectively), from which mEPSCs were detected. LTP was induced by eight bursts of 10 impulses at 100 Hz, which were repeated every 250 ms while stepping membrane potential to −30 mV (theta-burst stimulation, TBS). EPSCs and mEPSCs were digitally filtered at 3 kHz and analysed off-line with pCLAMP (Axon Instruments) and Igor (Wavemetrics, Inc., Lake Oswego, OR, USA) software. For both EPSCs and mEPSCs, peak amplitude, rise time from 10% to 90% of peak amplitude (RT10–90), and duration at 50% of peak amplitude (HW) were computed.
mEPSC analysis was performed automatically with a home-made program. Spontaneous signals were detected when their amplitude was 5–7 times the baseline noise s.d. (1.5 ± 0.3 pA, n = 7), and were recognized as mEPSCs if RT10-90 < 0.4 ms and 0.15 ms < HW < 0.7 ms. These criteria and a further visual inspection of detected signals allowed us to reject noise artefacts. Comparison of noise with mEPSC distributions indicated that a small percentage of mEPSCs could be lost in noise (<11.9 ± 2.5%; n = 7; data not shown).
A 5-min period was adopted to evaluate mean EPSC amplitude and coefficient of variation (CV); longer periods did not usually improve the estimate. The error introduced in EPSC CV by the indirect response, which causes non-zero failures (see Fig. 1C and D), was eliminated by setting all indirect responses to zero. Recording noise, which was measured from 30 10-ms baseline stretches, did not significantly influence EPSC and mEPSC coefficient of variation (difference <1%).
Figure 1. Mossy fibre–granule cell EPSCs.

EPSCs were elicited by mossy fibre stimulation at 0.33 Hz. A, the drawing shows 4 mossy fibres (mf) connected to a granule cell (GrC). Increasing stimulus intensity causes wider electric fields and mossy fibre recruitment. The plot at the bottom shows the time course of EPSC amplitude while increasing stimulation intensity. Levels I–IV correspond to recruitment of 1–4 synapses (failures are indicated with open symbols). Note the step-like activation of larger responses with small changes in stimulus intensity. Current tracings are the average of 30 consecutive EPSCs taken from the corresponding amplitude levels. B, average amplitude of minimal mossy fibre EPSCs with (•) or without (○) failures (mean ± s.e.m. (n = 12). As in panel A, stimulation intensity was increased until minimal EPSCs could be generated. Individual time courses have been aligned so that the beginning of synaptic responses coincided (arrow). C, individual EPSCs showed both a direct and indirect response. The indirect response emerged in isolation when the direct failed. The inset shows marginal overlapping of the direct and indirect response at the EPSC peak. D, plot of RT10–90versus EPSC amplitude for the same tracings in C. The direct (♦) and indirect (⋄) responses form distinct clusters.
The indirect EPSC component was evaluated by measuring EPSC amplitudes 10 ms after stimulation. Figure 2B and C, shows that mEPSCs subsided after 5 ms. To this time must be added 1–3 ms of synaptic delay, which extends the time occupied by direct EPSCs to 7 ms. This allowed the EPSC amplitude at 10 ms to reveal the contribution of spillover.
Figure 2. Sources of EPSC variability.

A, histograms of EPSC amplitudes at 3 different Ca2+ concentrations (1, 2 and 6 mm). Each histogram is made up of 200 responses with a bin width of 4 pA. Note the decrease in failures and the shift of the histogram to the right when the Ca2+ concentration is increased. No clear quantal peaks can be observed. B, single EPSC tracings taken from a low-Ca2+ experiment (1 mm, same cell as in panel A) show scatter in quantal delay. Tracings are aligned at the stimulus artefact (0.5 ms before tracings, not shown). Average tracings from 100 non-failure EPSCs are synchronized by the stimulus artefact (unaligned EPSCs, thick line) or aligned at the beginning of the raising phase (dashed line). It should be noted that the unaligned average EPSC is smaller (−11.3 pA) than the aligned average EPSC (−15.1 pA) and that the latter has faster kinetics. C, asynchronous quantal release at normal Ca2+ concentration (2 mm; same experiment as in panel A). A late quantum is indicated by the arrow (thick tracing). The dotted tracing shows an EPSC in which release is synchronous and amplitude is higher. D, single mEPSCs show amplitude variability. The average tracing was taken from 100 mEPSCs. The similarity of the average mEPSC with the aligned average EPSC shown in panel B suggests that the latter is probably due to release of a single quantum.
The stability of synaptic transmission can be influenced by slow modifications of neurotransmitter release and series resistance. Stability was assessed from average EPSC amplitudes over 5-min periods (Larkman et al. 1992). Average amplitude changed by less than 10% either during controls or after LTP had attained steady-state. The series resistance was monitored by analysing passive current transients induced by 10-mV hyperpolarizing voltage steps from a holding potential of −70 mV. The cerebellar granule cell has a compact structure and behaves like a single electrotonic compartment (D'Angelo et al. 1993, 1995; Silver et al. 1996; Cathala et al. 2003). Accordingly, the transients were reliably fitted with a mono-exponential function yielding membrane capacitance Cm= 3.8 ± 0.2 pF (n = 42), membrane resistance Rm= 2.1 ± 0.2 GΩ (n = 42), and series resistance Rs= 28.7 ± 2.4 MΩ (n = 42). The −3dB cell + electrode cut-off frequency was fVC= (2πRsCm)−1= 2.1 ± 0.2 kHz (n = 42) and did not significantly change during LTP (5 ± 1%, P = 0.83) attesting stability of recording conditions.
Data are reported as means ± s.e.m., and unless otherwise indicated statistical comparisons were done using paired Student's t test. Although data in the text are averages of individual EPSC measurements, in several figures we show triggered EPSC averagings. Triggered averaging causes slowing of EPSCs and amplitude reduction, because of asynchronous release of neurotransmitter quanta (see Fig. 2B and the quantal analysis section).
Application of binomial statistics to EPSC and mEPSC measurements
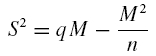
In this paper quantal properties of release have been assessed by several independent techniques. The quantal theory states that the mean number of quanta released at each impulse (m, mean quantum content) depends on the number of releasing sites (n) and on the probability (p) that each quantum (q, quantum size) is released. The statistics can be analysed using different techniques based on determination of EPSC amplitude and variability. EPSC variance (S2=s.d.2) and mean amplitude (M = mq) are related through a parabolic function (Clements & Silver, 2000):
 |
(1) |
EPSC variability depends on the number of released quanta and on intrinsic quantum variability. This, in turn, can be divided in intrasite (type-I) and intersite (type-II) variability. Intrasite variability (cvI) reflects fluctuation in the number of open channels at single sites (cvI-ss) and asynchrony in quantal delay at the EPSC peak (cvI-qd). Intersite variability (cvII) reflects differences among postsynaptic densities. Thus, the total quantal variance at the EPSC peak can be expressed as:
All the terms contributing to cv2tot could be determined (see Results). The variability of mEPSCs (cvq) includes intrasite and intersite quantal variability, cv2q= cv2I-ss+ cv2II. Since cv2I-ss is known from the analysis of single-site mossy fibre–granule cell synapses (Silver et al. 1996), cvII was obtained by difference. The term cvI-qd was obtained by measuring the difference in variance associated with stimulus aligned EPSCs compared to onset aligned quantal EPSCs in low Ca2+ solutions (Silver, 2003).
The relationship between EPSC S2 and M constructed by using different Ca2+ concentrations in the extracellular solution was fitted using the equation derived from multiple-probability fluctuation analysis (MPFA):
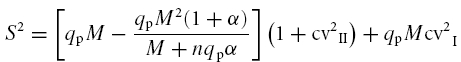 |
(2) |
in which α determines the distortion of the parabola caused by inhomogeneous release probability. Large α values indicate that release probability is homogeneous (Silver, 2003). Analysis of experimental data (see Fig. 3A) showed very large α values (>1000) and cv2I≈ cv2II, suggesting that eqn (2)could be approximated by a simple binomial model corrected for type-I variance (Clements, 2003):
Figure 3. Variance–mean plots.

Variance–mean plots were constructed using EPSCs taken from 11 cells recorded under different extracellular Ca2+ concentrations (including 0.5, 1, 2, 4 and 6 mm). Up to 3 different concentrations were tested in each recording. The data are described by a parabolic trajectory. A, fitting with eqn (2): qp= 12.9, n = 3.6, α= 100, cv2I= 0.123, cv2II= 0.167 (χ2= 680.4, r2= 0.89). The fitting did not appreciably improve for α > 100. B, fitting with eqn (3): qp= 13.4, n = 3.2, cv2I= 0.123 (χ2= 712.1, r2 = 0.89). The two fittings reported in A and B are virtually indistinguishable.
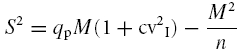 |
(3) |
This equation (see Figs 3B and 11A), combined with estimates of quantal parameters, was used to test whether EPSC changes during LTP are those expected for a change in p, n, or q. In particular, a change in p causes points to move along the parabolic trajectory, whereas points will fall outside the trajectory with a change in n or q.
Figure 11. Further statistical properties of LTP changes.

Different experimental conditions are compared in a graphical form. A, in the variance–mean plot, points corresponding to LTP of the direct response (⋆, n = 8) fall on the parabola obtained from eqn (3) (thick line). Changes in quantum size (⋄ increased membrane potential, n = 5) or in the number of releasing sites (♦ increased stimulus intensity, n = 5) move points above the parabola. The dotted and dashed lines show trajectories computed under the hypothesis that LTP is due to an increased quantum size or number of releasing sites, respectively. The 2nd EPSC in paired-pulse recordings (*, n = 11) draws a lower trajectory, probably reflecting reduction of quantum size caused by AMPA receptor desensitization. B, the (CVB/CVA)−2versus (MB/MA) plot shows that the LTP points (⋆ direct component, n = 8; • indirect component, n = 8; NMDA component, n = 4) fall in the sector of increased quantal release together with the point obtained with a high Ca2+/Mg2+ ratio (▵, n = 5). Points corresponding to reduced release probability (▵ low Ca2+/Mg2+ ratio, n = 5; □ Cl-adenosine, n = 4) fall in the complementary sector. The point corresponding to increased number of releasing sites (♦ increased stimulus intensity, n = 5) fall on the diagonal. The point corresponding to an increased quantum size (⋄ increased membrane potential, n = 5) fall on the axis (CVB/CVA)−2= 1. Data are shown as means ± s.e.m.
The simple binomial model, which was originally applied to the neuromuscular junction, provides useful predictions about the neurotransmission mechanism (Wernig, 1975; McLachlan, 1978), since the parameters p and n can be calculated from the mean amplitude and coefficient of variation of EPSCs (M = mqp and CV =S/M, where S is EPSC s.d.). In this model m =np, s.d.2=np(1 –p), and the probability p is:
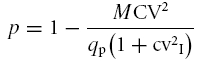 |
(4) |
The error inherent in p and n estimates was calculated according to McLachlan (1978). An estimate of p could also be obtained from the failure rate (N0/N) as:
| (5) |
Comparison of the two p estimates is useful since eqn (2) does not depend on quantum properties, at least as far as failures can be reliably identified (see Fig. 1C and D).
In a simple binomial process, the probability that the number of quanta x is released is
| (6) |
Theoretical distributions obtained with this equation are shown in Fig. 10A.
Figure 10. Binomial interpretation of LTP changes.

A, EPSC amplitude histograms were reproduced using a simple binomial distribution (eqn (2)). The p and n values were those obtained applying eqn (1) to experimental data (p = 0.6 in control, p = 0.73 during LTP; n = 3.0 in both cases). The theoretical distributions reproduce experimental EPSC histograms and their changes during LTP. The arrow indicates the mode shift caused by LTP. B, in the upper plot, p changes during LTP are reported against initial p values. Linear regression over the points has slope = −1.6 and intercept = 1.23 (r2 = 0.78; P < 0.008, F-test). In the lower plot, LTP is reported against initial p values. Linear regression over the points has slope = −0.7 and intercept = 0.7 (r2 = 0.61; P < 0.03, F-test).
The binomial distribution gives a precise interpretation to the inequality
 |
(7) |
where A and B indicate two different experimental conditions to be compared and <=> is less than, equal to or more than depending on which of the following statements (i, ii, iii) is used. The inequality leads to a topological representation of neurotransmission changes (see Fig. 11B) and has been extensively used to interpret the LTP mechanism (Malinow & Tsien, 1990; Bekkers & Stevens, 1990). The graph of eqn (5) has the following properties. For an M increase:
when (CVB/CVA)−2 > MB/MA both n and p can increase,
when (CVB/CVA)−2=MB/MA only n can increase,
when (CVB/CVA)−2 < MB/MA neither n nor p can increase (implying an increase in q). A pure increase in q will lie on the axis (CVB/CVA)−2= 1.
For an M decrease, complementary parameter changes are predicted. A confident interpretation of the plot can be achieved only providing independent estimates of q and cv, since simultaneous changes of the parameters cannot be excluded by inspection (von Kitzing et al. 1994; Sakmann, 1998).
Results
Mossy fibre–granule cell EPSCs and mEPSCs
As a first step we exploited the anatomy of mossy fibre–granule cell connections to determine the number of active synapses (Isaac et al. 1996). Granule cells have three to five short dendrites, each forming an excitatory synapse with a different mossy fibre (Eccles et al. 1967). With slow increases in the strength of stimulation (from 5 V to 10 V in 20 min), EPSCs suddenly appeared that showed oscillations in amplitude that could be attributed to quantal variations. With increases in the strength of stimulation, EPSCs became larger. EPSC averaging showed three to five regularly spaced levels in the synaptic response, indicating recruitment of mossy fibre synapses (Fig. 1A; see also D'Angelo et al. 1995). Responses obtained with minimal stimulation were integer fractions of larger responses, and were likely to correspond to EPSCs activated at a single mossy fibre contact (Fig. 1B). In LTP recordings, to validate the correct identification of putative single fibre EPSCs, we verified that the nearest multiple level was twice as large as that identified with minimal stimulation. This was indeed the case, with a ratio of 2.1 ± 0.3 (n = 8). Unless otherwise stated, subsequent experiments were performed using minimal stimulation and therefore putative single mossy fibre–granule cell connections.
Two other issues in LTP investigation are the presence of spillover and the determination of failures. Mossy fibre–granule cell EPSCs were characterized by a major fast component followed by a slower one (Fig. 1C). It was recently shown that the fast (direct) component is mediated by glutamate released at the synaptic contact impinging on the recorded granule cell, while the slow (indirect) component is generated by glutamate spillover from neighbouring contacts in the glomerulus (DiGregorio et al. 2002). Both current components were abolished by 10 μm NBQX (n = 4, data not shown). Distinction of the two components was enhanced by plotting RT10–90 against peak amplitude. The plot revealed that the direct component had RT10–90 of about 100 μs (confirming fast voltage-clamp of synaptic currents, see Methods), while the isolated indirect component formed a distinct cluster with RT10–90 > 500 μs and small amplitude (Fig. 1D). The indirect component measured −4.0 ± 1.8 pA (n = 7) and peaked 4.5 ± 0.5 ms after the stimulus, whereas EPSCs including the direct component measured −25.8 ± 3.3 pA (n = 7) and peaked at 0.7 ± 0.1 ms (n = 7). At the peak of the direct component, the indirect component was negligible (0.5 ± 0.1 pA, n = 7; see inset to Fig. 2A). Thus, when the direct component was present, it could be measured without correcting for the coexisting indirect one. When the direct component was absent, the response was regarded as a failure.
When extracellular Ca2+ was reduced (Fig. 2A), amplitude distributions showed a higher percentage of failures and small EPSCs indicating that putative single fibre EPSCs were multiquantal. Average EPSC amplitude (excluding failures) in low Ca2+ extracellular solution was −15.8 ± 5.7 pA (n = 7). In only 1 cell out of 12, following extracellular Ca2+ reduction, did the failure rate increase without changes in the size of non-failure responses (not shown), indicating uniquantal release at a single-site synapse (Silver et al. 1996).
EPSC delays were scattered over about 1 ms (Fig. 2B). At normal-to-high Ca2+ concentration, when most EPSCs are probably multiquantal, the occasional observation of one to two indents in the rising phase could be ascribed to asynchronous quantal release (Fig. 2C). This effect slowed down EPSC kinetics and reduced EPSC amplitude to 0.84 ± 0.07 of aligned EPSCs.
A closer understanding of mossy fibre–granule cell neurotransmission was obtained by analysing miniature EPSCs (mEPSCs). Since mossy fibres do not discharge spontaneously in cerebellar slice preparations (1 μm TTX did not significantly change either mEPSC amplitude or frequency, n = 3, data not shown), granule cell spontaneous synaptic activity was accounted for by mEPSCs. mEPSCs occurred at low frequency (0.21 ± 0.04 Hz; n = 4) presumably reflecting the small number of mossy fibres impinging on granule cells. mEPSCs did not show indents in their rising phase (Fig. 2D), as expected for release of single neurotransmitter quanta (Cathala et al. 2003). Thus, mEPSCs could be used to estimate the quantum size (q =−14.1 ± 2.8 pA, n = 4) and coefficient of variation (cvq= 0.47 ± 0.2, range 0.28–0.57, n = 4). The fact that the average mEPSC had nearly the same size as the average EPSC (failures excluded) obtained in low Ca2+ (cf. Fig. 2B and D) but lower size than average EPSCs in normal Ca2+ supported the multiquantal nature of mossy fibre–granule cell neurotransmission. The probability that an mEPSC falls into the 1 ms window delimiting the EPSC raising phase is very low (0.02%), making it extremely unlikely that indents in EPSC raising phase could be determined by mEPSCs.
Neurotransmission statistics at the mossy fibre–granule cell synapse
The statistical properties of transmission at the mossy fibre–granule cell synapse were investigated by analysing EPSC variability, which depends on fluctuations in the number of released quanta and in quantum size. In 11 recordings in which two or three different Ca2+ concentrations were used, points of the EPSC variance–mean plot described a parabolic trajectory (Fig. 3), consistent with the multiquantal nature of release (Silver et al. 1996; Clements & Silver, 2000). In order to perform a quantitative analysis of the variance–mean plot, the sources of quantal variability must be determined. mEPSCs are generated at all synaptic sites impinging on the granule cell, so that their amplitude fluctuates because of variability originating within single sites (cvI-ss) and across different sites (cvII). An estimate of cv2I-ss= 0.053 can be obtained from the analysis of single site EPSCs reported by Silver et al. (1996) (a similar value was measured in our single-site synapse recording, data not shown). By difference, cv2II= cv2q− cv2I-ss= 0.167. The presence of asynchronous quantal release (see Fig. 2B–D) indicates that a further source of variability affects the EPSC, namely the variability of quantum delay (cvI-qd). Since quanta contribute differently to EPSC peak depending on their relative time of occurrence, cvI-qd increases type-I variance. An estimate of cvI-qd was obtained by measuring the effect of quantal delay scattering on EPSC variability in low Ca2+, yielding cv2I-qd= 0.07 ± 0.01 (n = 7). The total type-I coefficient of variation is then cv2I= cv2I-ss+ cv2I-qd= 0.123.
Based on estimates of quantal variability, multiple-probability fluctuation analysis (MPFA; Silver, 2003) was applied. Fitting the variance–mean plot with eqn (2) (Fig. 3A) gave values for the quantum size at EPSC peak, qp= 12.9 pA and the number of releasing sites, n = 3.63. The parameter α tended to infinity indicating that the plot does not contain information reflecting p variability between sites. Since α determines the shape of a β function covering a broad family of probability distributions, it is likely that p was homogeneous. The calculated p value in normal Ca2+ was 0.55. By correcting for quantum delay we obtained q =qp (EPSCaligned/EPSCunaligned) = 15.3 pA, in agreement with the value obtained from mEPSCs (see also Fig. 2B).
The homogeneity of release probability and the considerable contribution of intrasite variability (cv2I≈ cv2II) suggested that our data could be approximated with a simple binomial model corrected for type-I variability (Clements, 2003). The data were therefore fitted with eqn (3), yielding qp= 13.4 pA, n = 3.2, and p = 0.6. The error in eqn (3)relative to eqn (2)is 3.8% for qp, 11.8% for n, and 9% for p indicating that simple binomial statistics are indeed applicable at the mossy fibre–granule cell synapse. Simple binomial statistics are used below to analyse neurotransmission changes during LTP.
EPSC changes during LTP
LTP was induced by theta-burst stimulation (TBS) paired with membrane depolarization at −30 mV (D'Angelo et al. 1999). The majority of granule cells (8/9) showed LTP (>10% amplitude increase) following TBS. TBS caused a 31.1 ± 8.6%(n = 8) EPSC increase (average changes including failures between 10 min and 30 min following TBS; Fig. 4A).
Figure 4. EPSC changes during LTP.

A, EPSCs recorded before and 20 min after LTP induction (top). During LTP, EPSCs are increased and show reduced variability. A failure revealing an indirect response is clearly visible among control tracings. Average EPSCs are shown at the bottom. B, time course of EPSC amplitude and CV during LTP. Points are means ± s.e.m. (n = 8). TBS is applied at the arrowhead. C, EPSC amplitude distributions before (continuous lines) and during LTP (broken lines). EPSC amplitude histograms were constructed with 5 pA per bin and smoothed with b-spline interpolation (n = 300 in control and n = 200 during LTP). Note disappearance of failures and shift of the histogram mode without change in maximum EPSC amplitude. D, relative frequency of failures, maximum amplitude and mode of EPSCs in amplitude histograms (means ± s.e.m., n = 8). Note that EPSC failures and mode show a significant change during LTP (**P < 0.01).
During LTP, EPSC CV (0.65 ± 0.10, n = 8) decreased by 28.9 ± 5.2%(P < 0.002; n = 8). The CV change followed the time course of LTP (Fig. 4B), suggesting that the quantal content had increased. EPSC failures, which were identified by the absence of the direct component (4.1 ± 1.9% of responses, n = 8 cells), decreased by 87.1 ± 14.8% (n = 8; P < 0.04; see Fig. 4D). No significant changes were observed in EPSC latency (1.38 ± 0.08 versus 1.27 ± 0.03 ms; n = 8) and time to peak (from 0.74 ± 0.08 ms to 0.80 ± 0.09 ms; n = 8). An increased quantal content may reflect either increased neurotransmitter release or expression of new postsynaptic receptor clusters, or possibly, in theory, a simultaneous increase in quantum size (Malenka & Nicoll, 1999).
Further evidence about LTP mechanisms was given by analysing EPSC amplitude distributions. EPSC amplitude distributions were bell shaped and no reliable peaks could be discerned with the present resolution (Fig. 4C). Accordingly we measured the mode of the distributions, reflecting the most frequent EPSC amplitude, and the maximum EPSC size (Fig. 4D). During LTP, the histogram mode showed a significant shift toward larger amplitudes (13.7 ± 4.2 pA shift; n = 8, P < 0.01) while EPSC maximum amplitude did not change (2.5 ± 3.1 pA shift; n = 8). Since increasing the quantum size or awakening silent synapses would increase the maximum EPSC amplitude, these data favour the hypothesis that mossy fibre–granule cell LTP is determined by increased neurotransmitter release.
If neurotransmitter release is increased, then the paired-pulse ratio (PPR, i.e. the ratio between the 2nd and 1st EPSC in a pair) should decrease because of lower vesicle availability (Schulz et al. 1994) and postsynaptic receptor desensitization in the 2nd EPSC (Xu-Friedman & Regehr, 2003). While stimulating mossy fibres at low frequency (0.33 Hz), EPSCs were elicited in pairs with an interpulse interval of 20 ms (Fig. 5A). PPR was 1.1 ± 0.13 ms (n = 5) in control and 0.82 ± 0.06 (n = 5) during LTP, showing a significantly reduction of 25.5 ± 4.1% (P < 0.02, n = 5).
Figure 5. Changes in EPSC amplitude, CV, failures and PPR in different recording conditions.

Paired-pulse recordings (20 ms interpulse interval) were performed in different recording conditions. Experimental conditions increasing the synaptic response included LTP induced by TBS (n = 8), a 20-fold increase in the extracellular Ca2+/Mg2+ ratio (n = 5), an increase in membrane potential from −40 mV to −70 mV (n = 5), and an increased stimulus intensity (n = 5). Experimental conditions decreasing the synaptic response included a 50-fold decrease in the extracellular Ca2+/Mg2+ ratio (n = 5) and application of 10 μm Cl-adenosine (n = 4). A, average tracings from 50 to 100 consecutive EPSCs. Thin line indicates control, thick line indicates treatment. B, the time course of EPSC and PPR changes during perfusion of solutions with modified extracellular Ca2+/Mg2+ ratio. Perfusion is indicated by the horizontal bar. C, bar graph of relative changes (mean ± s.e.m.) in amplitude, failures, and CV of the 1st EPSC, and in PPR. Changes that are statistically significant compared to control are indicated (*P < 0.05, **P < 0.01). Note that LTP mimics the pattern caused by raising release probability (high extracellular Ca2+/Mg2+ ratio) but differs from any other patterns.
Testing the origin of EPSC changes
The EPSC changes observed during LTP were compared with those determined by known pre- or postsynaptic modulators (Fig. 5A; cf. Manabe et al. 1993). (i) A change in neurotransmitter release was induced by altering the extracellular Ca2+/Mg2+ ratio (Dodge & Rahamimoff, 1967; Katz & Miledi, 1968) while keeping the total concentration of divalent cations constant. Increasing the Ca2+/Mg2+ ratio 20-fold raised the EPSC but reduced CV, failures, and PPR (n = 5). Conversely, decreasing the Ca2+/Mg2+ ratio 50-fold reduced the EPSC but increased CV, failures, and PPR (n = 5). (ii) A reduction in neurotransmitter release was induced by 10 μm Cl-adenosine (Lupica et al. 1992), which reduces mossy fibre–granule cell neurotransmission through a presynaptic mechanism (Maffei et al. 2002). Cl-adenosine reduced the EPSC together with a significant increase in CV, failures, and PPR (n = 4). (iii) The number of active synapses, and therefore of releasing sites, was increased by raising the stimulus intensity. The EPSC increase was associated with a reduction in CV and failures while PPR did not change (n = 5). (iv) Finally, a postsynaptic increase in quantum size was determined by increasing the AMPA current driving force (holding potential was changed from −40 mV to −70 mV). This manipulation increased the EPSC without any significant reduction in either CV, failures, or PPR (n = 5). Thus, changes in CV, failures, and PPR during LTP are compatible with an increased release probability. It should be noted that the time course of EPSC changes caused by increasing (or decreasing) extracellular Ca2+ were similar (or opposite) to those elicited by LTP (Fig. 5B). Average results are summmarized in Fig. 5C.
Our observations suggest that LTP should be prevented by raised levels of neurotransmitter release. In four experiments, we applied extracellular solution with a high Ca2+/Mg2+ ratio; as a result the EPSC was increased by 96.9 ± 37.9% (n = 4). Subsequent TBS application caused a marginal EPSC change (2.0 ± 8.9%; n = 4), demonstrating LTP occlusion (Fig. 6).
Figure 6. LTP is prevented by increasing release probability.

EPSCs were increased by an extracellular solution with high Ca2+/Mg2+ (horizontal bar) before applying TBS (arrowhead). TBS did not cause any LTP. Results are reported as means ± s.e.m. (n = 5). Tracings shown at the left are averaging of 10 EPSCs recorded in control (a), in high Ca2+/Mg2+ solution (b), and following TBS (c).
LTP of the indirect AMPA response and of the NMDA EPSC
If LTP is due to increased neurotransmitter release, the indirect AMPA receptor-mediated component should be potentiated and its CV should decrease (Kullman et al. 1996). The amplitude of the indirect component was estimated by measuring the EPSC 10 ms after stimulation (at this time the direct component had subsided; Fig. 7A; cf. Figs 1C and 2B–2D). In controls, the indirect component measured −4.7 ± 1.7 pA (n = 9) with CV = 0.53 ± 0.22 (n = 9). During LTP, the indirect component measured −5.8 ± 1.9 pA (n = 9) with CV = 0.42 ± 0.17 (n = 9). Thus, LTP caused a 22.3 ± 11.2% increase (P < 0.05) of the indirect component and reduced its CV by 19.1 ± 5.0% (P < 0.005). Similar changes were caused by raising neurotransmitter release with extracellular solutions with high Ca2+/Mg2+ ratio (Fig. 7C).
Figure 7. LTP of the indirect AMPA response and of the NMDA EPSC.

A, tracings at the left show AMPA EPSC potentiation at −70 mV. The arrow indicates where the indirect response was measured. Comparison of peak-scaled tracings shows that both the direct and indirect AMPA response are potentiated. In this particular example, the indirect is more potentiated than the direct response (the dashed line is the difference between LTP and control tracing), probably causing the unusual extension of EPSC rising phase during LTP. B, NMDA currents measured at −70 mV in Mg2+-free solution before and after TBS. C, changes in amplitude and CV (mean ± s.e.m.) for the indirect AMPA response (n = 8) and for the NMDA EPSC (n = 5) during LTP. The changes caused in the indirect AMPA response by an extracellular solution with high Ca2+/Mg2+ ratio (n = 5) are also shown. All changes were statistically significant (P < 0.01). In A and B, tracings are average of 100 EPSCs.
Similarly, increased glutamate release should increase the amplitude and reduce CV of the NMDA receptor-mediated response (D'Angelo et al. 1999; Rossi et al. 2002). The NMDA EPSC was elicited in isolation at −70 mV in Mg2+-free solution in the presence of the AMPA receptor blocker, 10 μm NBQX (Fig. 7B). The NMDA EPSC area, which was measured to reduce the effect of NMDA channel fluctuations on EPSC peak amplitude, measured −493.1 ± 170.5 pC (n = 4) with CV = 1.1 ± 0.3 (n = 4). Following TBS, EPSCs measured −760.5 ± 275.3 pC (n = 4) with CV = 0.8 ± 0.2 (n = 4). Thus, TBS induced a 52.1 ± 4.2% increase (P < 0.05) of the NMDA response and reduced its CV by 19.5 ± 4.3% (P < 0.05).
Increased frequency but invariant mEPSC size during LTP
mEPSCs have often been used to investigate LTP (Manabe et al. 1992; Kullman & Nicoll, 1992; Malgaroli et al. 1995). Since mEPSCs accounted for the whole spontaneous mossy fibre activity, in LTP experiments mEPSCs could be recorded without TTX and EPSCs could be used to control LTP expression. In LTP experiments, in order to prevent mEPSC changes from being obscured by the contribution of non-potentiated synapses, we activated as many synapses as possible (Fig. 8A and B). Indeed, EPSCs elicited at low frequency measured −83.2 ± 19.1 pA (n = 5) indicating activation of three to four mossy fibres. Following TBS, LTP showed a 57.1 ± 22.9% EPSC increase (n = 5; P < 0.02). Interestingly, mEPSCs showed marginal amplitude or cvq changes (−4.2 ± 6.3 and −7.9 ± 13.2%, respectively; P > 0.4), whereas their frequency significantly increased (47.6 ± 16%, n = 4; P < 0.03). The lack of mEPSC amplitude increase during LTP was unlikely to reflect synaptic current filtering, since no negative correlation between mEPSC amplitude and RT10–90 emerged either before or during LTP (Fig. 8C).
Figure 8. mEPSC recordings during LTP.

A, consecutive tracings showing spontaneous activity before and during LTP. B, following TBS, EPSC but not mEPSC amplitude increased. Tracings are averages of 30 EPSCs or mEPSCs, respectively. C, plot of mEPSC amplitude versus RT10–90 in control (○) and during LTP (•). Regression lines demonstrate absence of any correlation between the two variables (control, dashed line, r2 = 0.02; LTP, continuous line, r2 = 0.0001).
The time course of mEPSC changes during LTP is shown in Fig. 9 for five granule cells. Amplitude and RT10–90 of mEPSC did not change, while mEPSC frequency increased following a biphasic time course. A transient enhancement corresponding to post-tetanic potentiation was followed by a persistent enhancement corresponding to LTP. No comparable changes were observed in control recordings (n = 5).
Figure 9. Time course of mEPSC changes during LTP.

Changes in mEPSC frequency, amplitude, and rise-time (RT10–90) in control (○) and LTP experiments (•). TBS in LTP experiments was applied at the arrowhead. Whereas amplitude and RT10–90 remained stable, mEPSC frequency showed a rapid increase following TBS (post-tetanic potentiation) followed by a smaller but persistent increase at longer times (LTP). Points are means ± s.e.m. (n = 5 both in control and LTP experiments).
Statistical analysis of LTP mechanisms
EPSC changes during synaptic plasticity were analysed with simple binomial statistics. Quantal parameters were calculated before and after LTP induction using eqn (4), which establishes a relationship between EPSC mean (M) and CV and performs a linear correction for type-I variability (Wernig, 1975; McLachlan, 1978). Since q, cvq and EPSC activation kinetics did not substantially change during LTP, in eqn (4) qp and cvI were held fixed at their control values. In controls, the probability of release was p = 0.6 ± 0.08 (n = 7) and the number of releasing sites n = 3.5 ± 0.6 (n = 7). During LTP, p significantly increased (p = 0.73 ± 0.06, n = 7; P < 0.02) while n did not change (n = 3.4 ± 0.55, n = 7; P = 0.8). The p error arising from eqn (4) (5.1%) was small compared to the p change (21.6%). Similar p values (0.66 in control and 0.83 during LTP) were calculated from the failure rate (eqn (5)), although this estimate becomes less accurate during LTP as p increases and the number of failures becomes small.
Binomial distributions (eqn (6)) constructed using p and n values obtained from eqn (4) explained EPSC histogram changes (cf. Fig. 10A to Fig. 4C). In particular, eqn (6) predicted the change in failure rate, Px = 0, and the mode shift observed during LTP. The p change and the intensity of LTP were negatively correlated with the initial p value (Fig. 10B) and the average p change (21.6%) accounted for most of LTP in the same cells (27.0%).
The parabolic function representing the EPSC variance–mean relationship obtained in Fig. 3B was compared with LTP results (Fig. 11A). If LTP is explained by a p increase, then its (variance, mean) point should be in accord with the theoretical parabola. If, conversely, LTP is explained by an increase in q or n, then the (variance, mean) point should move above the parabola. The LTP point fell on the parabola, whereas points corresponding to alteration of n (increased stimulus intensity) or q (increased driving force) moved above the parabola. Points corresponding to the 2nd EPSC in paired-pulse recordings drew a lower trajectory probably reflecting q reduction by desensitization.
A method to determine whether EPSC changes (from state A to B) depend on quantum content or quantum size is to plot (CVB/CVA)−2versus (MB/MA) (Malinow & Tsien, 1990; Bekkers & Stevens, 1990). Using binomial statistics (eqn (7)), this plot has the property that the unitary slope diagonal divides points determined by increased quantum content (on or above the diagonal) from those determined by increased quantum size (below the diagonal). In our experiments (Fig. 11B), LTP of the direct AMPA component fell above the diagonal, together with the point corresponding to a rise in release probability (extracellular solution with high Ca2+/Mg2+ ratio). LTP of the indirect AMPA component and of the NMDA EPSC fell close to the diagonal, together with the point corresponding to increased number of release sites (increased stimulus intensity). Points corresponding to a reduction in quantum content (extracellular solution with low Ca2+/Mg2+ ratio; Cl-adenosine) fell in the complementary sector. The point corresponding to quantum size increase (membrane potential change) fell on the axis (CVB/CVA)−2= 1. These results are consistent with LTP being associated with increased neurotransmitter release.
Discussion
In this paper we investigated the nature of neurotransmission changes occurring during cerebellar mossy fibre–granule cell LTP. Potentiation was expressed by AMPA and NMDA receptors and involved currents generated by glutamate spillover. Moreover, mEPSC frequency increased whereas their amplitude remained constant. The combination of EPSC and mEPSC measurements, pharmacological manipulations, and statistical analysis support the conclusion that LTP changes mostly reflect an increased neurotransmitter release.
Fundamental aspects of mossy fibre–granule cell synaptic transmission
As previously demonstrated (D'Angelo et al. 1995), it was possible to count up to four active mossy fibres by regulating stimulation intensity. Thus, identification of a putative single fibre response was constrained both by being just suprathreshold and by being an integer fraction of multifibre EPSCs. This procedure limited the uncertainty in identifying single synaptic contacts, an aspect that has generated controversy in LTP analysis (Isaac et al. 1996).
Following a fast (direct) EPSC component, a protracted (indirect) AMPA receptor activation revealed the spillover-mediated current reported by DiGregorio et al. (2002). Since spillover depends on release from sites formed by the same mossy fibre (though on different granule cells) within the glomerulus, the indirect response allowed us to rule out failures of mossy fibre excitation or transmission at branching points. Glomeruli are about 10 μm apart and are wrapped in a glial sheet, so that cross-talk between them is very unlikely to occur.
The coefficient of variation estimated from mEPSCs (cvq= 0.47) was larger than that of single releasing sites (cvI-ss= 0.23; Silver et al. 1996) indicating intersite quantal variability (see discussion in Auger & Marty, 2000). Moreover, type-I variability at the EPSC peak was increased by scattering in quantal delay. The large quantal variability at the EPSC peak suggests that, at the mossy fibre–granule cell synapse, quantal peaks in EPSC histograms are unlikely to be resolved even with larger data samples than those used in the present investigation.
MPFA (Silver, 2003) suggested that p was homogeneous and a marginal difference emerged by accounting only for type-I variability (Clements, 2003). Thus, release conformed fairly well to simple binomial statistics with independent variability sources, as previously reported for the neuromuscular junction (Wernig, 1975; McLachlan, 1978). Consistent with stimulation of single fibre connections, the estimated number of releasing sites (n = 3–4) corresponds to that of morphologically identified synaptic contacts located on as many terminal digits of granule cell dendrites (Jakab & Hamori, 1988). Consistent with the absence of stimulation failures, release probability estimated from CV (p = 0.55 with compound and p = 0.6 with simple binomial statistics) is in good agreement with that estimated from failures (p = 0.66). This synapse showed therefore a rather high release probability, although p as low as 0.2 was observed in some recordings.
EPSC changes during LTP
During LTP, EPSC coefficient of variation (CV) and failure rate decreased. These changes, though consistent with an increased quantal content, may also reflect activation of new receptor clusters (for review see Malenka & Nicoll, 1999). Moreover, CV and failure reduction cannot rule out a simultaneous change in quantum size. A presynaptic mechanism was favoured by the lack of any increase in the maximum EPSC amplitude, which would be expected by increasing the quantum size (Manabe et al. 1992) or by awakening silent synapses (Liao et al. 1995). Moreover, the paired-pulse ratio (PPR) decreased during LTP, as expected if an increased neurotransmitter release accelerated synaptic vesicle depletion (Schulz et al. 1994) and AMPA receptor desensitization (Xu-Friedman & Regehr, 2003).
The above conclusion was supported by observing that the pattern of CV, failure, and PPR changes during LTP was reproduced by raising neurotransmitter release with extracellular solutions with high Ca2+/Mg2+ ratio. An opposite pattern was observed by reducing release with extracellular solutions with low Ca2+/Mg2+ ratio or with Cl-adenosine. Different patterns were found by increasing postsynaptic responsiveness or recruiting additional synapses.
Extracellular solutions with high Ca2+/Mg2+ ratio, which raise neurotransmitter release by enhancing presynaptic Ca2+ influx (Dodge & Rahamimoff, 1967; Katz & Miledi, 1968), prevented LTP. Mossy fibre terminal current changes and LTP were also prevented by K+ channel block by TEA (Maffei et al. 2002). These observations support the involvement of mechanisms regulating presynaptic terminal excitability, Ca2+ influx, and ultimately neurotransmitter release in the LTP expression pathway.
NMDA and spillover-mediated current changes during LTP
During LTP, as well as during perfusion of extracellular solution with a high Ca2+/Mg2+ ratio, the indirect AMPA response increased while its CV decreased. An increased spillover indicates that releasing sites other than those impinging on the recorded granule cell are potentiated, as expected by the observation that LTP could develop in unclamped granule cells (Armano et al. 2000; Maffei et al. 2002, 2003). The increase of the spillover response implies that granule cell AMPA receptors are not saturated by a single mossy fibre impulse (Silver et al. 1996; A. Silver, personal communication). Thus, increasing AMPA receptor number (Hayashi et al. 2000) would not markedly increase the EPSC. Spillover could also play a role in potentiating the NMDA EPSC (Rossi et al. 2002), as originally postulated for hippocampal synapses (Kullmann et al. 1996).
mEPSC changes during LTP
Measurements of mEPSC parameters allowed us to assess potential quantum size changes. The contribution of non-tetanized synapses was minimized by activating virtually all mossy fibres impinging on the granule cell, and electrotonic alterations were ruled out by the absence of correlation between mEPSC rise time and amplitude. Under these conditions, the stable amplitude of mEPSCs during LTP speaks against an increased AMPA channel number or conductance (Manabe et al. 1992; Benke et al. 1998; Hayashi et al. 2000). The significant increase in mEPSC frequency, although favouring the hypothesis that vesicular release is enhanced (Malgaroli et al. 1995), cannot rule out expression of new postsynaptic receptor clusters (Malenka & Nicoll, 1999).
Statistical analysis of EPSC changes during LTP
In summary, an increased neurotransmitter release during LTP is indicated by the decrease in EPSC variance, failures, and PPR and by the fact that these changes are mimicked by increasing extracellular Ca2+. Increased neurotransmitter release also explains potentiation in AMPA spillover and NMDA currents and the increase in mEPSC frequency. The possibility of an increased postsynaptic responsiveness is ruled out by the absence of mEPSC amplitude changes. The possibility that additional synapses are recruited is improbable since, contrary to our observation, mean EPSC amplitude should nearly double (synapse recruitment caused 2.1 times EPSC increase compared to 1.3 times LTP), the maximum EPSC amplitude should increase (while it showed a non-significant 4% change), and PPR should be constant (while it shows a significant 25% reduction).
These conclusions were supported by binomial statistics which explained changes in EPSC CV, failure rate, and amplitude distribution during LTP through a p increase that was proportional to the initial p value. Since the p change accounted for about 80% of LTP, a minor fraction of potentiation may be due to simultaneous undetected changes in q or n, as reported at hippocampal synapses (Kullman & Nicoll, 1992; Larkman et al. 1992). As when p was experimentally changed with different Ca2+/Mg2+ ratios, LTP points moved along the theoretical variance–mean parabola (eqn (4); Clements & Silver, 2000) constructed using control EPSC and mEPSC measurements. Changes in q (increased driving force) or n (recruitment of an additional synapses) moved points above the theoretical parabola and could not therefore explain LTP. The location of the 2nd EPSC in paired-pulse recordings below the theoretical parabola suggests reduction of the quantum size by desensitization.
Interpretation of the (CVB/CVA)−2versusMB/MA plot (eqn (5); Malinow & Tsien, 1990; Bekkers & Stevens, 1990) was consistent with LTP being caused by an increased quantum content. The LTP point fell with those caused by increasing neurotransmitter release (p or n), while those related to reduced release fell in the complementary sector, the one related to increased n on the diagonal, and that related to an increased q on the axis (CVB/CVA)−2= 1. The location of points corresponding to the indirect AMPA component and to the NMDA EPSC close to the diagonal may reflect the contribution of additional releasing sites by spillover. It should be noted that this plot does not exclude a simultaneous change in q (Von Kitzing et al. 1994; Sakmann, 1998).
Comparison with other synapses and mechanisms
Increased neurotransmitter release was proposed to occur during LTP at other central synapses in situ (Malinow & Tsien, 1990; Schulz et al. 1994; Kullmann et al. 1996; Gasparini et al. 2000) and in neuronal cell cultures (Bekkers & Stevens, 1990; Malgaroli et al. 1995). Coupling between postsynaptic NMDA receptor-dependent induction and presynaptic expression may be provided by NO (Arancio et al. 1996), a putative retrograde neurotransmitter inducing LTP at the mossy fibre–granule cell synapse (Maffei et al. 2003).
The present observation does not exclude that, in different functional or developmental conditions, LTP expression might change. For instance, silent synapse awakening characterizes the developmental process of the cerebellar mossy fibre–granule cell relay, leading from purely NMDA to mixed AMPA–NMDA EPSCs (D'Angelo et al. 1993; Losi et al. 2002). Moreover, NMDA receptor stimulation leads to CREB activation in granule cells (Monti et al. 2002), and may therefore prime postsynaptic gene expression and protein synthesis in later LTP phases.
Conclusions and functional implications
The demonstration that mossy fibre–granule cell LTP is determined by an enhanced release probability may have consequences for cerebellar computation. Since EPSC potentiation was associated with enhanced short-term synaptic depression, mossy fibre–granule cell LTP may play a role in regulating cerebellar dynamics (Hansel et al. 2001; Carey & Lisberger, 2002). Moreover, since EPSC variability decreased, LTP should improve the reliability of neurotransmission. Different roles may be played by the coexisting postsynaptic increase in intrinsic excitability (Armano et al. 2000), which is suited for determining the number of active granule cells minimizing redundancy and optimizing sparse representation of mossy fibre activity (Schweighofer et al. 2001).
Acknowledgments
We thank Profesor John Nicholls for careful reading of the manuscript, Dr Elena Saftenku and Dr Thierry Nieus for discussion on quantal analysis, and Dr Jonathan Mapelli for experimental assistance. This work was supported by European Community grants IST-2001-35271 and QLG3-CT-2001-02256, by MIUR and INFM of Italy.
References
- Arancio O, Kiebler M, Lee CJ, Lev-Ram V, Tsien RY, Kandel ER, et al. Nitric oxide acts directly in the presynaptic neuron to produce long-term potentiation in cultured hippocampal neurons. Cell. 1996;87:1025–1035. doi: 10.1016/s0092-8674(00)81797-3. [DOI] [PubMed] [Google Scholar]
- Armano S, Rossi P, Taglietti V, D'Angelo E. Long-term potentiation of intrinsic excitability at the mossy fibre – granule cell synapse of rat cerebellum. J Neurosci. 2000;20:5208–5216. doi: 10.1523/JNEUROSCI.20-14-05208.2000. [DOI] [PMC free article] [PubMed] [Google Scholar]
- Auger C, Marty A. Quantal currents at single-site central synapses. J Physiol. 2000;526:3–11. doi: 10.1111/j.1469-7793.2000.t01-3-00003.x. [DOI] [PMC free article] [PubMed] [Google Scholar]
- Bekkers JM, Stevens CF. Presynaptic mechanism for long-term potentiation in the hippocampus. Nature. 1990;346:724–729. doi: 10.1038/346724a0. [DOI] [PubMed] [Google Scholar]
- Benke TA, Luthi A, Isaac JTR, Collingridge GL. Modulation of AMPA receptor unitary conductance by synaptic activity. Nature. 1998;393:793–797. doi: 10.1038/31709. [DOI] [PubMed] [Google Scholar]
- Bliss TVP, Collingridge GL. A synaptic model of memory: long-term potentiation in the hippocampus. Nature. 1993;361:31–39. doi: 10.1038/361031a0. [DOI] [PubMed] [Google Scholar]
- Carey MR, Lisberger SG. Embarassed, but not depressed: eye opening lessons for cerebellar learning. Neuron. 2002;35:223–226. doi: 10.1016/s0896-6273(02)00771-7. [DOI] [PubMed] [Google Scholar]
- Cathala L, Brickley S, Cull-Candy S, Farrant M. Maturation of EPSCs and intrinsic membrane properties enhances precision at a cerebellar synapse. J Neurosci. 2003;23:6074–6085. doi: 10.1523/JNEUROSCI.23-14-06074.2003. [DOI] [PMC free article] [PubMed] [Google Scholar]
- Clements JD. Variance-mean analysis: a simple and reliable approach for investigating synaptic transmission and modulation. J Neurosci Meth. 2003;130:115–125. doi: 10.1016/j.jneumeth.2003.09.019. [DOI] [PubMed] [Google Scholar]
- Clements JD, Silver RA. Unveiling synaptic plasticity: a new graphical and analytical approach. Trends Neurosci. 2000;23:105–113. doi: 10.1016/s0166-2236(99)01520-9. [DOI] [PubMed] [Google Scholar]
- D'Angelo E, De Filippi G, Rossi P, Taglietti V. Synaptic excitation of individual rat cerebellar granule cells in situ: evidence for the role of NMDA receptors. J Physiol. 1995;484:397–413. doi: 10.1113/jphysiol.1995.sp020673. [DOI] [PMC free article] [PubMed] [Google Scholar]
- D'Angelo E, Rossi P, Armano S, Taglietti V. Evidence for NMDA and mGlu receptor-dependent long-term potentiation of mossy fibre – granule cell transmission in rat cerebellum. J Neurophysiol. 1999;81:277–287. doi: 10.1152/jn.1999.81.1.277. [DOI] [PubMed] [Google Scholar]
- D'Angelo E, Rossi P, Taglietti V. Different proportions of N-methyl-D-aspartate and non-N-methyl-D-aspartate receptor currents at the mossy fibre-granule cell synapse of developing rat cerebellum. Neuroscience. 1993;53:121–130. doi: 10.1016/0306-4522(93)90290-v. [DOI] [PubMed] [Google Scholar]
- DiGregorio DA, Nusser Z, Silver RA. Spillover of glutamate onto synaptic AMPA receptors enhances fast transmission at a cerebellar synapse. Neuron. 2002;35:521–533. doi: 10.1016/s0896-6273(02)00787-0. [DOI] [PubMed] [Google Scholar]
- Dodge FA, Jr, Rahamimoff R. Co-operative action a calcium ions in transmitter release at the neuromuscular junction. J Physiol. 1967;193:419–432. doi: 10.1113/jphysiol.1967.sp008367. [DOI] [PMC free article] [PubMed] [Google Scholar]
- Eccles JC, Ito M, Szentagothai J. The Cerebellum as a Neuronal Machine. Berlin: Springer Verlag; 1967. [Google Scholar]
- Edwards FA. Anatomy and electrophysiology of fast central synapses lead to a structural model for long-term potentiation. Physiol Rev. 1995;75:759–787. doi: 10.1152/physrev.1995.75.4.759. [DOI] [PubMed] [Google Scholar]
- Gasparini S, Saviane C, Voronin LL, Cherubini E. Silent synapses in the developing hippocampus: lack of functional AMPA receptors or low probability of glutamate release? Proc Natl Acad Sci U S A. 2000;97:9741–9746. doi: 10.1073/pnas.170032297. [DOI] [PMC free article] [PubMed] [Google Scholar]
- Hansel C, Linden DJ, D'Angelo E. Beyond parallel fibre LTD: the diversity of synaptic and non-synaptic plasticity in the cerebellum. Nature Neurosci. 2001;4:467–475. doi: 10.1038/87419. [DOI] [PubMed] [Google Scholar]
- Hawkins RD, Kandel ER, Siegelbaum SA. Learning to modulate transmitter release: themes and variations in synaptic plasticity. Annu Rev Neurosci. 1993;16:625–665. doi: 10.1146/annurev.ne.16.030193.003205. [DOI] [PubMed] [Google Scholar]
- Hayashi Y, Shi S-H, Esteban JA, Piccini A, Poncer J-C, Malinow R. Driving AMPA receptors into synapses by LTP and CaMKII: requirement for GluR1 and PDZ domain interaction. Science. 2000;287:2262–2267. doi: 10.1126/science.287.5461.2262. [DOI] [PubMed] [Google Scholar]
- Isaac JTR, Hjelmstad GO, Nicoll RA, Malenka RC. Long-term potentiation at single fiber inputs to hippocampal CA1 pyramidal cells. Proc Natl Acad Sci U S A. 1996;93:8710–8715. doi: 10.1073/pnas.93.16.8710. [DOI] [PMC free article] [PubMed] [Google Scholar]
- Jakab J, Hamori J. Quantitative morphology and synaptology of cerebellar glomeruli in the rat. Anat Embriol. 1988;179:81–88. doi: 10.1007/BF00305102. [DOI] [PubMed] [Google Scholar]
- Katz B, Miledi R. The role of calcium in neuromuscular facilitation. J Physiol. 1968;195:481–492. doi: 10.1113/jphysiol.1968.sp008469. [DOI] [PMC free article] [PubMed] [Google Scholar]
- Kullmann DM, Erdemli G, Asztely F. LTP of AMPA and NMDA receptor-mediated signals: evidence for presynaptic expression and extrasynaptic glutamate spillover. Neuron. 1996;17:461–474. doi: 10.1016/s0896-6273(00)80178-6. [DOI] [PubMed] [Google Scholar]
- Kullmann DM, Nicoll RA. Long-term potentiation is associated with increases in quantal content and quantal amplitude. Nature. 1992;357:240–244. doi: 10.1038/357240a0. [DOI] [PubMed] [Google Scholar]
- Larkman A, Hannay T, Stratford K, Jack J. Presynaptic release probability influences the locus of long-term potentiation. Nature. 1992;360:70–73. doi: 10.1038/360070a0. [DOI] [PubMed] [Google Scholar]
- Liao D, Hessler NA, Malinow R. Activation of postsynaptically silent synapses during pairing-induced LTP in CA1 region of hippocampal slice. Nature. 1995;375:400–404. doi: 10.1038/375400a0. [DOI] [PubMed] [Google Scholar]
- Losi G, Prybylowski K, Fu Z, Luo JH, Vicini S. Silent synapses in developing cerebellar granule neurons. J Neurophysiol. 2002;87:1263–1270. doi: 10.1152/jn.00633.2001. [DOI] [PubMed] [Google Scholar]
- Lupica CR, Proctor WR, Dunwiddie TV. Presynaptic inhibition of excitatory synaptic transmission by adenosine in rat hippocampus: analysis of unitary EPSP variance measured by whole-cell recordings. J Neurosci. 1992;12:3753–3764. doi: 10.1523/JNEUROSCI.12-10-03753.1992. [DOI] [PMC free article] [PubMed] [Google Scholar]
- Maffei A, Prestori F, Rossi P, Taglietti V, D'Angelo E. Presynaptic current changes at the mossy fiber-granule cell synapse of cerebellum during LTP. J Neurophysiol. 2002;88:627–638. doi: 10.1152/jn.2002.88.2.627. [DOI] [PubMed] [Google Scholar]
- Maffei A, Prestori F, Shibuki K, Rossi P, Taglietti V, D'Angelo E. NO enhances presynaptic currents during cerebellar mossy fiber-granule cell LTP. J Neurophysiol. 2003;90:2478–2483. doi: 10.1152/jn.00399.2003. [DOI] [PubMed] [Google Scholar]
- Malenka RC, Nicoll RA. Long-term potentiation – A decade of progress? Science. 1999;285:1870–1874. doi: 10.1126/science.285.5435.1870. [DOI] [PubMed] [Google Scholar]
- Malgaroli A, Ting AE, Wendland B, Bergamaschi A, Villa A, Tsien RW, et al. Presynaptic component of long-term potentiation visualized at individual hippocampal synapses. Science. 1995;268:1624–1628. doi: 10.1126/science.7777862. [DOI] [PubMed] [Google Scholar]
- Malinow R. Is maintenance of LTP presynaptic. Nature. 1991;350:282. doi: 10.1038/350282a0. [DOI] [PubMed] [Google Scholar]
- Malinow R, Tsien RW. Presynaptic enhancement shown by whole-cell recording of long-term potentiation in hippocampal slices. Nature. 1990;346:177–180. doi: 10.1038/346177a0. [DOI] [PubMed] [Google Scholar]
- Manabe T, Renner P, Nicoll RA. Postsynaptic contribution to long-term potentiation revealed by the analysis of miniature synaptic currents. Nature. 1992;355:50–55. doi: 10.1038/355050a0. [DOI] [PubMed] [Google Scholar]
- Manabe T, Wyllie DJ, Perkel DJ, Nicoll RA. Modulation of synaptic transmission and long-term potentiation: effects on paired-pulse facilitation and EPSC variance in the CA1 region of the hippocampus. J Neurophysiol. 1993;70:1451–1459. doi: 10.1152/jn.1993.70.4.1451. [DOI] [PubMed] [Google Scholar]
- McLachlan EM. The statistics of transmitter release at chemical synapses. In: Porter R, editor. International Rev Physiol Neurophysiol III. Vol. 17. Baltimore: University Park Press; 1978. [PubMed] [Google Scholar]
- Monti B, Marri L, Contestabile A. NMDA receptor-dependent CREB activation in survival of cerebellar granule cells during in vivo and in vitro development. Eur J Neurosci. 2002;16:1490–1498. doi: 10.1046/j.1460-9568.2002.02232.x. [DOI] [PubMed] [Google Scholar]
- Rossi P, Sola E, Taglietti V, Borchardt T, Steigerwald F, Utvik K, et al. NMDA receptor 2 (NR2) C-terminal control of NR open probability regulates synaptic transmission and plasticity at a cerebellar synapse. J Neurosci. 2002;22:9687–9697. doi: 10.1523/JNEUROSCI.22-22-09687.2002. [DOI] [PMC free article] [PubMed] [Google Scholar]
- Sakmann B. Unitary EPSPs in pairs of anatomically reconstructed cortical pyramidal neurons. In: Faber DS, Korn H, Redman SJ, Thomson SM, Altman JS, editors. Central Synapses: Quantal Mechanisms and Plasticity. HFSP Strasbourg: 1998. pp. 64–73. [Google Scholar]
- Schulz PE, Cook EP, Johnston D. Changes in paired-pulse facilitation suggest presynaptic involvement in long-term potentiation. J Neurosci. 1994;14:5325–5337. doi: 10.1523/JNEUROSCI.14-09-05325.1994. [DOI] [PMC free article] [PubMed] [Google Scholar]
- Schweighofer N, Doya K, Lay F. Unsupervised learning of granule cell sparse codes enhances cerebellar adaptive control. Neuroscience. 2001;103:35–50. doi: 10.1016/s0306-4522(00)00548-0. [DOI] [PubMed] [Google Scholar]
- Silver RA. Estimation of nonuniform quantal parameters with multiple-probability fluctuation analysis: theory, application and limitations. J Neurosci Meth. 2003;130:127–141. doi: 10.1016/j.jneumeth.2003.09.030. [DOI] [PubMed] [Google Scholar]
- Silver RA, Cull-Candy SG, Takahashi T. Non-NMDA glutamate receptor occupancy and open probability at a rat cerebellar synapse with single and multiple releases sites. J Physiol. 1996;494:231–250. doi: 10.1113/jphysiol.1996.sp021487. [DOI] [PMC free article] [PubMed] [Google Scholar]
- Von Kitzing E, Jonas P, Sakmann B. Quantal analysis of excitatory postsynaptic currents at the hippocampal mossy fiber – CA3 pyramidal cell synapse. In: Stjärne L, Greengard P, Grillner S, Öchfelt T, Ottoson D, editors. Molecular and Cellular Mechanisms of Neurotransmitter Release. New York: Raven Press Ltd; 1994. pp. 235–260. [DOI] [PubMed] [Google Scholar]
- Wernig A. Estimates of statistical release parameters from crayfish and frog neuromuscular junctions. J Physiol. 1975;244:207–221. doi: 10.1113/jphysiol.1975.sp010792. [DOI] [PMC free article] [PubMed] [Google Scholar]
- Xu-Friedman MA, Regehr WG. Ultrastructural contributions to desensitization at cerebellar mossy fiber to granule cell synapses. J Neurosci. 2003;23:2182–2192. doi: 10.1523/JNEUROSCI.23-06-02182.2003. [DOI] [PMC free article] [PubMed] [Google Scholar]