Abstract
Nitric oxide (NO) has been postulated to be required, together with reactive oxygen species (ROS), for the activation of the hypersensitive reaction, a defense response induced in the noncompatible plant-pathogen interaction. However, its involvement in activating programmed cell death (PCD) in plant cells has been questioned. In this paper, the involvement of the cellular antioxidant metabolism in the signal transduction triggered by these bioactive molecules has been investigated. NO and ROS levels were singularly or simultaneously increased in tobacco (Nicotiana tabacum cv Bright-Yellow 2) cells by the addition to the culture medium of NO and/or ROS generators. The individual increase in NO or ROS had different effects on the studied parameters than the simultaneous increase in the two reactive species. NO generation did not cause an increase in phenylalanine ammonia-lyase (PAL) activity or induction of cellular death. It only induced minor changes in ascorbate (ASC) and glutathione (GSH) metabolisms. An increase in ROS induced oxidative stress in the cells, causing an oxidation of the ASC and GSH redox pairs; however, it had no effect on PAL activity and did not induce cell death when it was generated at low concentrations. In contrast, the simultaneous increase of NO and ROS activated a process of death with the typical cytological and biochemical features of hypersensitive PCD and a remarkable rise in PAL activity. Under the simultaneous generation of NO and ROS, the cellular antioxidant capabilities were also suppressed. The involvement of ASC and GSH as part of the transduction pathway leading to PCD is discussed.
The mechanism of plant resistance to pathogens starts with specific recognition between molecules produced in the plant-pathogen interaction and plant receptors. The interaction between elicitors and receptors triggers a complex response network aimed at determining resistance to infection by stopping pathogen penetration into host tissues or inducing pathogen death (McDowell and Dangl, 2000). During incompatible plant-pathogen interactions, recognition of a potential pathogen often results in a hypersensitive reaction (HR), a localized activation of programmed cell death (PCD), that generates a physical barrier restraining nutrient availability because of the rapid dehydration caused by tissue death (Parker and Coleman, 1997). It is believed that the coordinated activation of PCD and other defense mechanisms at the site of infection requires tight control of the production of the reactive oxygen species (ROS), such as superoxide and hydrogen peroxide. Besides having a direct antimicrobial activity (Lamb and Dixon, 1997), ROS contribute to the construction of barriers against phytopathogens. H2O2 is used by apoplastic peroxidases, which reinforce the cell wall and hinder pathogen penetration by catalyzing the cross-linking between the structural cell wall polymers and the oxidative polymerization of cinnamyl alcohol to lignin (Ros Barceló, 1997). Moreover, H2O2, being able to cross cellular membranes, is also a diffusible signal for the activation of defense genes and systemic acquired resistance (Levine et al., 1994; Alvarez et al., 1998). However, different signaling molecules are required for the activation of plant defense responses, because ROS do not seem to be directly involved in the rapid induction of genes coding for the enzymes of the phenylpropanoid pathway, which leads to the synthesis of phytoalexins, lignin, and salicylic acid (Dorey et al., 1999). It has recently been reported that the simultaneous production of H2O2 and nitric oxide (NO) is required to induce the PCD occurring during the HR (Delledonne et al., 1998). NO also seems to act independently from ROS in the induction of specific genes responsible for the synthesis of defense metabolites (Noritake et al., 1996; Delledonne et al., 1998). In mammals, the involvement of NO in pathological conditions has been widely investigated. NO, being a stable and reactive molecule at the same time, has been considered one of the more appropriate bioactive molecules in the intra- and inter-cellular signal transduction for the regulation of physiological and pathological processes (Stamler, 1994). Both in animals and plants NO seems to induce the production of the second messenger cyclic GMP; moreover, in animal cells, it affects redox-sensitive ion channels and transcription factors (Stamler, 1994; Durner et al., 1998). The recent findings reporting that NO is also synthesized in plants via both nitrate reductase and NO synthase (Yamasaki and Sakihama, 2000; Ribeiro et al., 1999) support the possibility of NO being involved in physiological and/or pathological processes in plants too.
It is well known that the PCD occurring during the HR is preceded by an oxidative burst that is mainly attributable to the activation of several enzymatic systems involved in ROS generation. It has recently been suggested that reduction in the activity/expression of enzymes responsible for ROS catabolism is also relevant for ROS increase in death-designated cells. Both catalase and ascorbate (ASC) peroxidase (APX), enzymes responsible for hydrogen peroxide scavenging in plant cells, seem to be locally down-regulated during the HR (Dorey et al., 1998; Mittler et al., 1998, 1999). The involvement of ASC and GSH metabolisms in the defense mechanisms activated in plants by pathogen attacks has also been suggested (Vanacker et al., 1998, 2000). Nevertheless, molecular signals and mechanisms that trigger the decrease in the enzymatic ROS-scavenging capability are not well known, and it has not been clarified whether PCD induced in the HR requires alteration of other components of the antioxidant systems. Both in plant and animal cells, ROS detoxification is carried out by a network of reactions involving enzymes and metabolites with redox properties. The ASC-glutathione (GSH) cycle is a key part of this network (Noctor and Foyer, 1998). In this cycle ASC is oxidized directly by ROS or enzymatically by APX. The first product of its oxidation, ASC free radical (AFR; also known as monodehydroascorbate) is partly reduced back by a NAD(P)H-dependent reductase and partly undergoes spontaneous dismutation producing dehydroascorbate (DHA), the final oxidation product of ASC. DHA can be reduced by DHA reductase, an enzyme that, using GSH as electron donor, cooperates with AFR reductase in the recycling of the oxidized ASC. Finally, GSH disulfide (GSSG), produced in DHA reduction, is reconverted to GSH by a NADPH-dependent GSSG reductase. Interestingly, all the components of the ASC-GSH cycle are copresent in all organelles in which ROS detoxification is needed, such as chloroplasts, mitochondria, and microbodies (De Leonardis et al., 1995, 2000; Jiménez et al., 1998; Asada, 1999). Under abiotic stress conditions, a coordinated increase in the activities of the ASC-GSH redox enzymes has been widely reported to enable plants to overcome oxidative stress (Noctor and Foyer, 1998; Di Cagno et al., 2001). On the other hand, very little information is yet available on the involvement of ASC and GSH pairs and redox enzymes in hypersensitive PCD.
In this paper, the relationship between cell death induced by NO and/or ROS and the antioxidant systems has been studied. The obtained results suggest that changes in ASC and GSH metabolisms caused by the interplay between NO, ROS, and plant cells can be part of the transduction signals that triggers PCD.
RESULTS
PCD
The NO and ROS levels were altered singularly or together in tobacco (Nicotiana tabacum cv Bright-Yellow 2 [BY-2]) cells by the addition to the culture medium of sodium nitroprusside (SNP), an NO generator, and Glc plus Glc oxidase (GOG) to generate H2O2 (Delledonne et al., 1998; see also “Materials and Methods”).
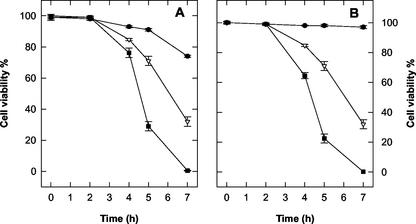
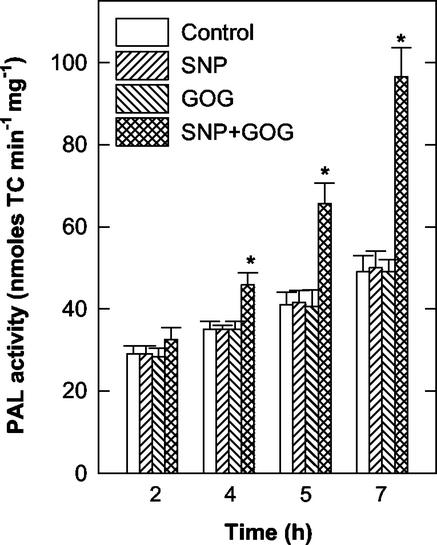
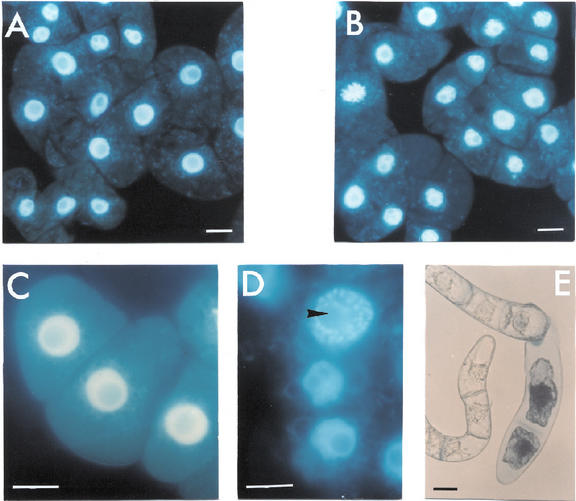
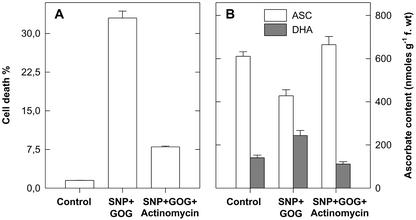
Treatments with the NO generator SNP, at concentrations between 0.05 to 5 mm, had no effect on the viability of tobacco cv BY-2 cells. H2O2 generated by GOG had no significant effect on cell viability during the first 7 h of treatment when Glc oxidase was used at concentrations of 0.05 to 1 units mL−1. Induction of cell death was evident only when the amount of Glc oxidase was raised to 2 units mL−1 (35%–40% cell death after 7 h of treatment). The simultaneous production of NO plus H2O2 reduced tobacco cv BY-2 cell viability in a dose-dependent manner. Cell death occurred even when NO and H2O2 are generated at concentrations that are completely ineffective when the two chemical species are produced singularly (Fig. 1). Because the concentrations of NO and H2O2 generators produced by 0.5 mm SNP and 0.5 mm Glc plus 0.5 units mL−1 Glc oxidase give a clear, but not too fast, effect on cell viability and these concentrations are commonly used in the literature (Delledonne et al., 1998; Clarke et al., 2000), most of the results reported in this paper were obtained under these experimental conditions. Figure 2 shows the effects of the alteration of NO or H2O2 and NO plus H2O2 on Phe ammonia-lyase (PAL) activity, chosen as a marker of activation of defense responses. Neither NO nor H2O2 affected PAL activity when singularly produced, because the variations in PAL activity occurring during the analyzed period were similar in control cells and in those grown in a medium with increased levels of NO or ROS alone. The behavior of PAL was quite different when NO and H2O2 were simultaneously produced in the cell culture, because a remarkable rise in PAL activity occurred under such treatment. To confirm whether cell death induced by simultaneous production of NO and H2O2 is a programmed event and not a consequence of cell necrosis triggered by an overproduction of reactive species, cytological and biochemical markers of PCD, such as chromatin condensation, cytoplasm shrinkage, and the effect of transcription inhibitors (Mittler and Lam, 1996), were analyzed. The nuclear morphology of cells treated with SNP plus GOG were studied using 4,6-diamino-2-phenylindole (DAPI) staining coupled with fluorescence microscopy. Control cell nuclei had a large central nucleolus surrounding by a uniform stained chromatin (Fig. 3, A and C); whereas, in the cells enriched with NO plus H2O2, the chromatin had a granular aspect and nuclei were lobated (Fig. 3, B and D). Cytoplasmic shrinkage was also evident in the cells treated with SNP plus GOG (Fig. 3E), whereas single treatment with SNP or GOG at the same concentrations used for the double treatment (0.5 mm SNP or 0.5 mm Glc plus 0.5 units mL−1 Glc oxidase) did not induce any relevant structural anomaly (data not shown). Induction of cell death by NO plus H2O2 was blocked when treatments were performed in the presence of actinomycin (Fig. 4A) in accordance with data reporting that inhibitors of transcription or translations block the PCD process (Solomon et al., 1999; Clarke et al., 2000).
Figure 1.
Effects of the altered levels of NO and H2O2 on cell viability. The levels of NO and H2O2 were altered in tobacco cv BY-2 cells by adding SNP and GOG, respectively, in the culture medium. A, Glc (0.5 mm) and Glc oxidase (0.5 unit mL−1) plus: 0.05 mm (●), 0.5 mm (▵), and 5 mm (▪) SNP. B, SNP (0.5 mm) plus Glc (0.5 mm) and: 0.05 unit mL−1 (●), 0.5 unit mL−1 (▵), and 1 unit mL−1 (▪) Glc oxidase. Cell viability was analyzed over time. Values represent mean ± se of five experiments.
Figure 2.
Effects of the altered levels of NO and/or H2O2 on PAL activity. The levels of NO and H2O2 were altered in tobacco cv BY-2 cells by adding SNP (0.5 mm) and GOG (0.5 mm Glc plus 0.5 unit mL−1 Glc oxidase), respectively, in the culture medium. PAL activity was analyzed over time. TC, trans-Cinnamic acid. Values represent mean ± se of five experiments. * indicates the values that are significantly different from controls (Student's t test with P < 0.01).
Figure 3.
Chromatin condensation and cytoplasm shrinkage induced by NO and H2O2 in tobacco cv BY-2 cells. A through D, The cells were stained after 4 h of treatments with DAPI to visualize nuclear morphology. A and C, Control cells; B and D, SNP plus GOG-treated cells. The arrow indicated a representative granular nucleus. E, Cell viability and cytoplasm shrinkage of SNP plus GOG-treated cells. SNP and GOG were used at the same concentration of Figure 2. Bar = 20 μm.
Figure 4.
Effect of actinomycin on cell death and on ASC content and redox state. Tobacco cv BY-2 cells were treated by adding SNP and GOG in the presence or absence of actinomycin (1 μg mL−1). After 5 h of treatment cell death (A) and level and redox state of ASC pool (B) were measured. See Figure 2 for SNP and GOG concentrations. Values represent mean ± se of three experiments.
Cellular Redox State
The different effect of the treatments with NO or H2O2 versus NO plus H2O2 was further substantiated by the analysis of lipid peroxidation, because neither the increase in NO nor H2O2 affected the level of lipid peroxidation, at least at the concentration used (0.5 mm SNP or 0.5 mm Glc plus 0.5 units mL−1 Glc oxidase). On the other hand, the SNP plus GOG treatment induced a consistent increase in lipid peroxidation (more than 100%) that reached a steady-state level at 5 h (Table I).
Table I.
Effects of the NO and/or H2O2 generation on lipid peroxidation
| Time | Lipid Peroxidation
|
|||
|---|---|---|---|---|
| Control | SNP | GOG | SNP + GOG | |
| h | μmol MDA g−1 fresh wt | |||
| 2 | 11.2 ± 0.8 | 13.1 ± 1.1 | 11.8 ± 0.9 | 12.3 ± 0.8 |
| 4 | 12.1 ± 0.9 | 10.8 ± 0.8 | 12.4 ± 1.1 | 18.3 ± 0.9 |
| 5 | 12.7 ± 1.0 | 11.2 ± 0.9 | 11.7 ± 0.8 | 28.2 ± 1.3 |
| 7 | 10.7 ± 0.9 | 10.2 ± 0.7 | 16.7 ± 1.2 | 26.2 ± 1.5 |
Changes over time in lipid peroxidation of tobacco cv BY-2 cells with altered levels of NO and/or H2O2 were measured as the malondialdehyde (MDA) content. The results are the means of five experiments ± se. NO and H2O2 were generated by adding SNP (0.5 mm) and/or GOG (0.5 mm Glc plus 0.5 unit mL−1 Glc oxidase) in the culture medium.
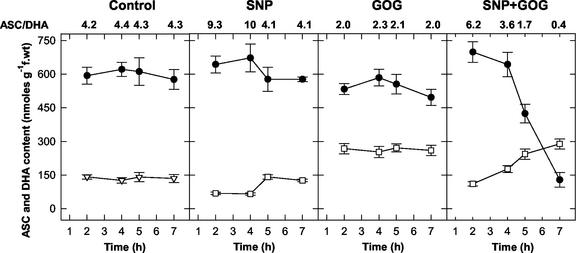
During the analyzed period, in the control cells, no significant differences occurred in the content or redox state of the ASC pool and, as a consequence, the ASC to DHA ratio remained unchanged (Fig. 5). NO production induced a transient increase in ASC content with a parallel decrease in DHA, thus causing changes in the ASC to DHA ratio that rose from a value of 4 in the control cells to values of 9 to 10 in the NO-enriched cells within the first 4 h of treatment, after which it decreased again to the control value (Fig. 5). In contrast, GOG caused an immediate decrease in the ASC content and an increase in DHA, thus indicating that an oxidative stress occurred in the GOG-treated cells. However, ASC and DHA levels did not further change significantly after the first 2 h of treatment, and the ASC to DHA ratio was maintained at about 2 throughout the whole analyzed period (Fig. 5). The oxidative stress induced by H2O2 generation increased in a dose-dependent manner, because when Glc oxidase was raised to 2 units mL−1, the ASC to DHA ratio dropped off to 1. The simultaneous increase in NO and H2O2 in cell culture induced a strong and progressive oxidation of ASC with a simultaneous increase in DHA production (Fig. 5). The decrease in the ASC pool and the shift of ASC to DHA pair toward the oxidized form were proportional to the amount of NO or H2O2 generated in the culture medium (Table II).
Figure 5.
Effects of the NO and/or H2O2 generation on the ASC pool. Values represent mean ± se of five experiments. The ASC to DHA ratios were calculated by using the mean values of ASC and DHA contents. See Figure 2 for SNP and GOG concentrations. ●—●, ASC; □—□, DHA.
Table II.
Effect of different amounts of NO and H2O2 generation on ascorbate pool
| Treatments | ASC | DHA | ASC/DHA |
|---|---|---|---|
| nmol g−1 fresh wt | |||
| Control | 611 ± 61 | 141 ± 15 | 4.33 |
| SNP (0.5 mm) + GGO (0.05 unit mL−1) | 562 ± 60 | 123 ± 10 | 4.57 |
| SNP (0.5 mm) + GGO (0.5 unit mL−1) | 424 ± 39 | 244 ± 15 | 1.73 |
| SNP (0.5 mm) + GGO (1 unit mL−1) | 43 ± 4 | 131 ± 10 | 0.56 |
| GGO (0.5 unit mL−1) + SNP (0.05 mm) | 563 ± 51 | 135 ± 11 | 4.17 |
| GGO (0.5 unit mL−1) + SNP (5 mm) | 118 ± 8 | 202 ± 15 | 0.58 |
Different concentrations of SNP and Glc oxidase (GO) plus 0.5 mm Glc (G) were added to the culture medium of tobacco BY-2 cells. ASC and DHA levels were measured in the cells after 5 h of treatments. The results are the means of three experiments ± se.
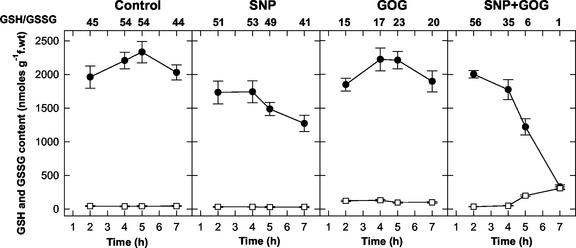
The behavior of the GSH pool under the three treatments is reported in Figure 6. After 2 h of SNP treatment, the amount of GSH was lower than that of the control cells, and a further progressive decrease occurred as time went by. However, no significant variations in GSH to GSSG ratios were evident. GOG-treated cells had GSH levels comparable with the control, but their GSSG was maintained at a higher level throughout the whole treatment, as is well evident from the strong decrease in the GSH to GSSG ratios. The effect of the simultaneous increase in NO and H2O2 on the GSH pool resembled that on ASC. A steep decrease in the reduced form occurred after 4 h of treatment; whereas the GSSG progressively increased, and at 7 h, the GSH and GSSG were present in the cells in the same amount. In the double treatments, when the production of NO or H2O2 was increased by enhancing SNP or GOG concentrations, the decrease in the GSH to GSSG ratio was more rapid (data not shown).
Figure 6.
Effects of the NO and/or H2O2 generation on the GSH pool. Values represent mean ± se of five experiments. The GSH to GSSG ratios were calculated by using the mean values of GSH and GSSG contents. See Figure 2 for SNP and GOG concentrations. ●—● = GSH; □—□ = GSSG.
When the PCD induced by NO plus ROS was blocked by the presence of actinomycin, the effect of the double treatment on ASC level and redox balance was also reverted (Fig. 4B). Analogous results were obtained on the GSH pool (data not shown). Treatment with actinomycin alone did not affect cell viability or antioxidant levels and redox status.
ASC and GSH Redox Enzymes
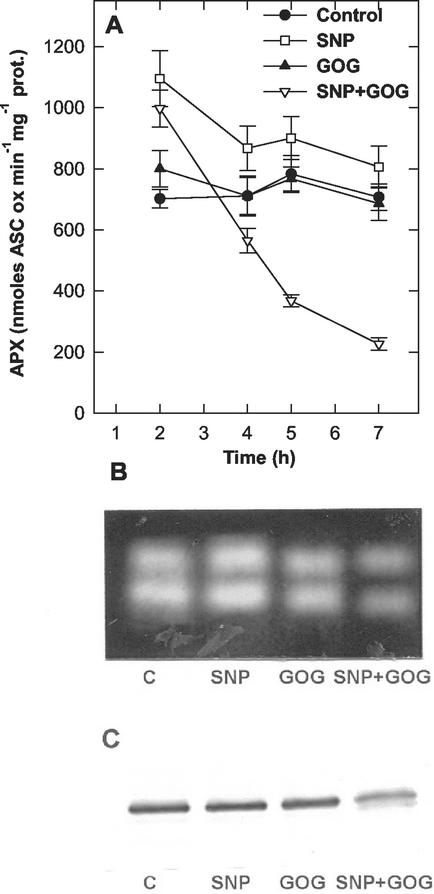
To obtain a more global view on the changes in the ROS-scavenging capability, the activity of APX and those of the other enzymes of ASC-GSH cycle were tested. The APX activity did not significantly change under treatment with 0.5 mm Glc plus 0.5 unit mL−1 Glc oxidase treatment, even if an increase in the enzyme activity was evident when the H2O2 production was raised. In tobacco cv BY-2 cells treated for 5 h with 0.5 mm Glc plus 1 unit mL−1 Glc oxidase, the APX activity was about 50% higher than in control cells. SNP-treated cells also had higher APX activity than control cells. In contrast, the simultaneous treatments with SNP and GOG induced a rapid and progressive decrease in APX activity, and after 7 h, the APX activity was much lower than that of control cells (Fig. 7A). These results were further confirmed by native PAGE analysis (Fig. 7B). APX activity more rapidly decreased when, in the simultaneous NO plus H2O2 treatment, the generation of one of the two reactive species was enhanced (data not shown). As previously reported (de Pinto et al., 2000), tobacco cv BY-2 cells have 2 cytosolic APX. After 5 h of treatment, the two bands of APX were well active in control, NO- or H2O2-enriched cells, but they both decreased in the cell undergoing NO plus H2O2 treatment. The effects of NO, H2O2, and NO plus H2O2 on APX were also tested by western blotting analysis using a specific monoclonal antibody cross-reacting with the cytosolic isoenzyme of APX (Fig. 7C). Despite both bands of cytosolic APX being detected by native PAGE cross-reacted with the antibody (data not shown), when western blotting was performed with proteins subjected to SDS-PAGE, the antibody recognized a single protein, with a molecular mass of about 30 kD. A remarkable decrease in the APX cross-reacting with the antibody occurred under simultaneous production of NO and H2O2, whereas no significant differences were induced by the individual increase in NO or H2O2.
Figure 7.
Effects of the altered levels of NO and/or H2O2 on APX. A, Changes in APX specific activity during time; the values are the means of five experiments ± se. Representative native PAGE (B) and western blot (C) of APX from tobacco cv BY-2 cells treated for 5 h with SNP, GOG, or SNP plus GOG. For each treatment 300 and 20 μg of total proteins were loaded in the native PAGE (B) and in the SDS-PAGE (C) respectively. See Figure 2 for SNP and GOG concentrations.
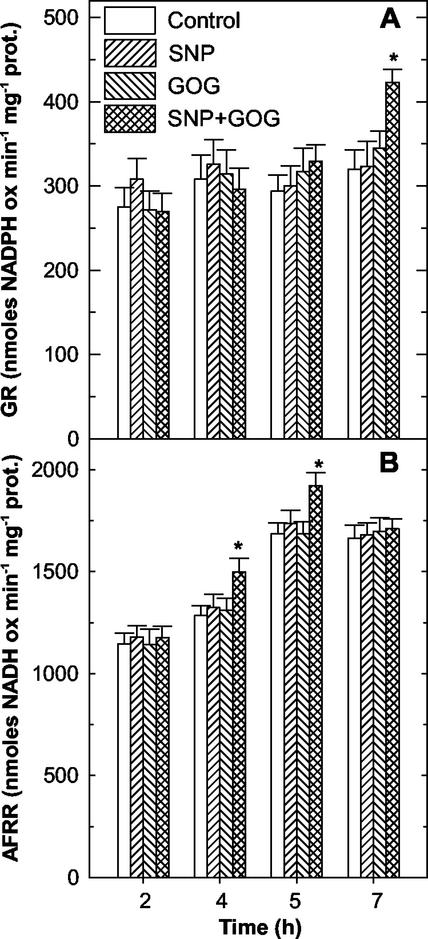
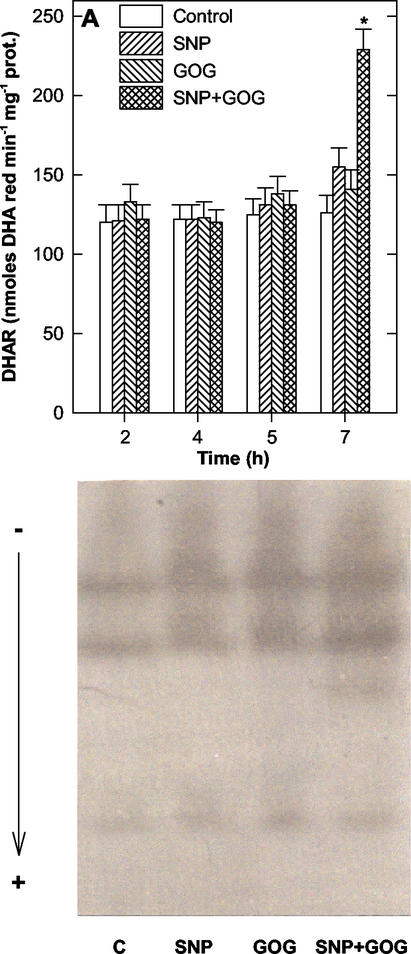
The production of NO or H2O2 had no effects on the activity of the enzymes responsible for the reduction of the oxidized forms of ASC and GSH, namely AFR reductase, DHA reductase, and GSSG reductase. On the other hand, the simultaneous production of NO and ROS affected these enzymes (Figs. 8 and 9). The activity of AFR reductase was only transiently increased between 4 and 5 h of treatments (Fig. 8B), whereas, GSSG reductase and DHA reductase strongly increased their activities, but only at 7 h of treatment (Figs. 8A and 9A). The DHA reductase rise was partly attributable to the appearance of a new protein with DHA reducing activity (Fig. 9B).
Figure 8.
Effects of the NO and/or H2O2 generation on GSSG reductase and AFR reductase. Specific activity of GSSG reductase (GR; A) and AFR reductase (AFRR; B) over time. The values represent mean ± se of five experiments. * indicates the values that are significantly different from controls (Student's t test with P < 0.01). See Figure 2 for SNP and GOG concentrations.
Figure 9.
Effects of the NO and/or H2O2 generation on DHA reductase. A, Changes in DHA reductase (DHAR) activity over time. The values represent mean ± se of five experiments. * indicates the values that are significantly different from controls (Student's t test with P < 0.01). B, Representative native PAGE of DHA reductase from tobacco cv BY-2 cells treated for 7 h with SNP, GOG, or SNP plus GOG. For each treatment, 300 μg of total proteins was loaded. See Figure 2 for SNP and GOG concentrations.
DISCUSSION
Data reported in this paper point out that NO and ROS have different effects depending on whether they are singularly or simultaneously produced in tobacco cells. The production of NO alone by treatment with SNP does not affect cell viability or PAL activity, whereas it induces an increase in the activity of APX and a transient shift of the ASC pool toward the reduced form, particularly evident during the first hours of SNP treatment (Figs. 5 and 7). These results agree with an antioxidative effect of NO (Beligni and Lamattina, 1999) that could cooperate with ASC in protection against oxidative processes. NO has accordingly been reported to compete with ASC in stopping lipid peroxidation by acting in synergy with α-tocopherol (Rubbo et al., 2000). Different from our results, an inhibitory effect of NO on APX activity has been recently reported, this effect being attributed to direct NO binding to the heme group of the enzyme (Clark et al., 2000). The discrepancy between these and our data is attributable to the fact that Clark et al. (2000) obtained the inhibition of APX in in vitro experiments, whereas in the experiments here presented, NO was in vivo generated. Moreover they used different NO generators (at 5 mm concentration) that produced an amount of NO at least 10 to 15 times higher than SNP (Wink et al., 1996). Under our experimental conditions, NO production also affects the GSH pool, inducing its progressive decrease (Fig. 6). However, such a decrease is not attributable to oxidative processes, because the GSH to GSSG ratio does not change in NO-enriched cells, but this is probably the consequence of the GSH nitrosylation process, an established event induced by NO (Durner and Klessig, 1999). H2O2 alone is also ineffective on PAL activity and cell viability, when it is generated at low concentration, whereas, when its production exceeds a threshold value, it induces cell death in a dose-dependent way, as previously reported (Houot et al., 2001). As expected, the overproduction of H2O2 induces an oxidative stress in the cells that causes an imbalance of both ASC and GSH pools toward the oxidized forms (Figs. 5 and 6) that is proportional to the amount of H2O2 generated.
Completely different are the effects of the simultaneous increase in NO and H2O2 production. A cellular death having the features of the hypersensitive PCD (Figs. 1–4) occurs in tobacco cv BY-2 cells grown in presence of NO and H2O2 generators. Cellular death occurs after a lag, similar to that reported for the PCD activation under different conditions (Desikan et al., 1998). Hallmarks of the PCD occurring in the HR, such as chromatin condensations, cytoplasmic shrinkage (Fig. 3) and blocking of the death process by means of transcription inhibitors (Fig. 4A) are evident in the cells in which a simultaneous rise in NO and H2O2 has been induced. The induction of PCD by simultaneous alteration in NO and H2O2 levels is consistent with the evidence that both of these two chemical species are produced in plant cells at the site of pathogen infection (Mittler and Lam, 1996; Clarke et al., 2000). However, the recent evidence demonstrating that the production of NO alone (and in the same range of concentration used in this study) is sufficient to induce PCD in Arabidopsis cell culture (Clarke et al., 2000), raises the question as to whether, in cellular lines of different plant species, the alterations in the levels of these reactive molecules are diversely perceived/amplified or trigger different transduction pathways. It has also been pointed out that the amount, kind (O2− or H2O2), and availability of ROS for interacting with NO (localization of their production, presence of scavenger systems) are critical points for the modulation of NO/H2O2 signaling in plant HR (Delledonne et al., 2001). Thus, the NO experimentally produced in a cell culture could have a different effect depending on the different endogenous presence of other reactive species. On the other hand, despite the exogenous production of ROS (by means of ROS generators or ROS supply) being used for the experimental induction of cell death, it is clear that plant cells require other signal molecules to activate HR in physiological conditions. In fact, several responses activated in the HR are not in vitro triggered by ROS alone (Levine et al., 1994; Dorey et al., 1999). Moreover, an overproduction of ROS is a well-known phenomenon occurring in plant cells subjected to abiotic stresses. However, under abiotic stress conditions, ROS overproduction does not trigger cell death but an increase in APX and other ASC, GSH redox enzymes, at least in resistant plants (Noctor and Foyer, 1998). In contrast, the PCD induced by NO and H2O2 requires the suppression of the antioxidant systems responsible for cellular redox balance. Data here reported show that the decrease in APX is the first alteration in the redox-regulating systems induced by NO plus H2O2 treatment, because a 50% decrease is already evident after 4 h, when the difference in ASC and GSH pools are not yet statistically significant (Figs. 5–7). A key role for APX down-regulation in generating the conditions needed for HR has already been reported in the interaction between tobacco and tobacco mosaic virus (TMV). In the HR induced by TMV, the APX is suppressed at the translation level, moreover, transgenic antisense plants with reduced APX are hyper-responsive to TMV attacks (Mittler et al., 1998, 1999). The results of the western blot of APX under NO and ROS alteration are coherent with a regulation mechanism acting at the translation or posttranslation level (Fig. 7C) and suggest that the transduction pathway triggered by the simultaneous increase in NO and H2O2 is implicated in APX down-regulation. The cellular conditions needed for PCD induction are accompanied by an imbalance of the ASC and GSH redox pairs toward the oxidized forms (Figs. 5 and 6). Interestingly, when PCD is blocked by the presence of transcription inhibitors, the alteration in the levels and redox state of the ASC and GSH pools are also abolished (Fig. 4B). This result indicates that alterations in the level and redox state of these metabolites are not unspecifically and merely caused by reactive molecules produced under the contemporary presence of NO and H2O2, but they are specifically required in the PCD process. The imbalance of these redox pairs could be not only simply directed toward creating the cellular conditions for the oxidative burst occurring during HR, but it could also be involved in the alteration of gene expression required by PCD. It is known that both ASC and GSH pairs modulate gene expression through affecting redox-sensitive transcription factors (Noctor et al., 1998; Catani et al., 2001). As a matter of fact, some transcription factors involved in animal apoptosis are regulated by changes in redox balance (Moran et al., 2001).
As far as the enzymes of the ASC and GSH recycle are concerned, their increase induced by simultaneous NO and H2O2 production seems to be a homeostatic attempt, without success, to maintain the DHA and GSSG content at low levels (Figs. 8 and 9). AFR reductase has been reported as a key enzyme in ASC recycling, particularly under stress conditions, its expression and activity increasing in plant tissues under a number of abiotic stresses. The spontaneous disproportionation of AFR, the first product of ASC oxidation, generates DHA, which has a negative effect on cell metabolism. Great importance has been attributed to AFR reductase for maintaining DHA at a low level in cells, by decreasing the amount of AFR available to disproportionate (De Gara and Tommasi, 1999). This is confirmed by several results showing that in vegetative tissues, changes in the activity of AFR reductase usually mirror changes in ASC oxidation (De Gara and Tommasi, 1999; de Pinto et al., 2000). The transient increase in AFR reductase activity, occurring after NO plus H2O2 production, could be a response to an increase in AFR production, because of an overoxidation of ASC. However, such a response seems to be suppressed as the treatment goes on. This probably further contributes to shift the cellular redox balance toward the oxidative state. Even the increases in DHA reductase and GSSG reductase, occurring as late events in this process, are not able to stem the DHA and GSSG production despite the appearance of a new protein able to reduce DHA. On this point, it is interesting to note that several proteins sharing the presence of two Cys residues in a four-amino acid consensus sequence are able to reduce DHA in vitro, including proteins with well-known regulatory properties (May et al., 1997; Powis et al., 1995). Moreover, it is known that PCD requires activation of caspases, Cys rich proteases. The new proteins occurring in the late phase of PCD induction could have a physiological role different from DHA reduction.
Further investigation is required to support this hypothesis and to understand whether the increases in GSSG and DHA are directly implicated in the activation/expression of key proteins involved in PCD.
In conclusion, data here reported indicate a direct involvement of antioxidant metabolism in PCD activation and underline the complexity of the signaling pathways triggered by plants to cope with changes in environmental conditions. This complexity is also attributable to the versatility of the signaling molecules involved (as NO and ROS), the effects of which can vary according to the different situations in which their production is activated.
MATERIALS AND METHODS
Cell Culture and Microscopy
The tobacco (Nicotiana tabacum L. cv BY-2) cell suspension was routinely propagated and cultured according to Nagata et al. (1992). For the experiments, a stationary culture was diluted 4:100 (v/v). At the 3rd d of culture, NO and H2O2 were generated by adding from 0.05 mm to 5 mm SNP (ICN Biomedicals, Aurora, OH) and 0.5 mm GOG from 0.05 to 2 units mL−1 (Calbiochem, La Jolla, CA) to the culture medium. The production of NO and H2O2 during the experimental conditions used was checked according to Privat et al. (1997) and Bellincampi et al. (2000), respectively. Where indicated, actinomycin (1 μg mL−1) was added to the culture medium, at the same time as the addition of SNP and GOG. At time intervals, aliquots of cells were collected for analysis.
Cell viability was measured as previously described using Trypan Blue staining (de Pinto et al., 1999). For the analysis of nuclear morphology, tobacco cv BY-2 cells were prepared as described by Callard et al. (1996). Cell were fixed with 100 mm PIPES, pH 6.8, 10 mm EGTA, and 10 mm MgSO4 (PEM buffer) containing 4% (w/v) formaldehyde in a cell suspension buffer ratio of 1:1 (v/v). After 30 min, cells were washed three times in PEM buffer and resuspended in PEM containing 0.2% (w/v) Triton X-100 and 1 μg mL−1 DAPI (Sigma-Aldrich, St. Louis). Cells were visualized using a fluorescence microscope (DMLS, Leica, Wetzlar, Germany) with an excitation filter of 340 to 380 nm and a barrier filter of 400 nm.
ASC and GSH Assays
Cells were collected by filtration on 3MM (Whatman, Clifton, NJ). Cells (0.5–1 g) were homogenized with 2 volumes of cold 5% (w/v) meta-phosphoric acid at 4°C in a porcelain mortar. The homogenate was centrifuged at 20,000g for 15 min at 4°C, and the supernatant was collected for analysis of ASC and GSH. The ASC and GSH pools were measured according to Zhang and Kirkham (1996).
Lipid Peroxidation
The level of lipid peroxidation in the cells was measured in terms of malondialdehyde content determined by the thiobarbituric acid reaction as described by Zhang and Kirkham (1996). The cells (0.4 g) were homogenized in 4 mL of 0.1% (w/v) trichloroacetic acid. The homogenate was centrifuged at 10,000g for 10 min. One milliliter of the supernatant was diluted 1:5 (v/v) with 20% (w/v) trichloroacetic acid containing 0.5% (w/v) thiobarbituric acid. The mixture was heated at 95°C for 30 min and cooled in an ice bath, after which it was centrifuged at 10,000g for 10 min, and the absorbance of the supernatant was read at 532 nm. The value for the nonspecific absorption at 600 nm was subtracted from the 532 nm reading. The concentration of malondialdehyde was calculated using the extinction coefficient of 155 mm cm−1.
Enzyme Assays
Cells were ground in liquid nitrogen and homogenized at 4°C in extraction buffer (50 mm Tris-HCl, pH 7.8, 0.05% [w/v] Cys, and 0.1% [w/v] bovine serum albumin). Homogenate was centrifuged at 20,000g for 15 min. The supernatant was used for both spectrophotometric and electrophoretic analyses. The activity of APX (l-ASC:hydrogen peroxide oxidoreductase, EC 1.11.1.11), AFR reductase (NADH:AFR oxidoreductase, EC 1.6.5.4) DHA reductase (GSH:DHA oxidoreductase, EC 1.8.5.1), and GSSG reductase (NADPH:GSSG oxidoreductase, EC 1.6.4.2) were tested according to de Pinto et al. (2000). PAL (EC 4.3.1.5) was determined spectrophotometrically at 290 nm from the amount of trans-cinnamic acid produced upon incubation for 15 min at 40°C in a reaction mixture containing 0.1 m borate buffer, pH 8.8, 10 mm l-Phe, and an aliquot of proteins (Sarma and Sharma, 1999). Attention was paid for determining specific activity of each enzyme always with the same amount of proteins. All of the specific activities were measured by using a spectrophotometer (DU 7000, Beckman Coulter, Fullerton, CA). Protein determination was performed using a protein assay kit (Bio-Rad, Hercules, CA), using bovine serum albumin as a standard.
Native-PAGE and Western-Blot Analysis
Native PAGE was performed according to de Pinto et al. (2000). SDS-PAGE was carried out using a separating gel of 12.5% (w/v) acrylamide. Protein from SDS-PAGE was transferred to a nitrocellulose membrane using the semidry electropforetic transfer cell (Hoefer Pharmacia Biotech Inc, San Francisco) in a running buffer containing 25 mm Tris, 190 mm Gly, and 20% (v/v) methanol, at 100 V for 60 min. The membrane was then blocked with a solution containing 1% (w/v) bovine serum albumin, 0.15 m NaCl, 20 mm Tris-HCl, pH 7.5, and 0.05% (v/v) Tween 20 for 30 min and incubated with anti-APX monoclonal antibody (AP6 from Saji et al., 1990) and with goat anti-mouse IgG conjugated with alkaline phosphatase (Promega, Madison, WI). Antigenic polypeptides were visualized using the nitroblue tetrazolium/5-bromo-4-chloro-3indolyl-phosphate kit (Promega).
Statistics
Statistical differences between mean values of control and treated cells were determined with the Student's t test.
ACKNOWLEDGMENTS
We thank Dr. Akihiro Kubo (Environmental Biology Division National Institute for Environmental Studies, Onogawa, Japan) for kindly supplying ASC peroxidase antibody and Vincenzo Cellamare (Dipartimento di Biologie e Patologie Vegetale, Bari, Italy) for technical assistance.
Footnotes
This work was supported in part by Ministero dell'Istzuzione, dell'Université e delle Ricerce, Consiglio Nazionale delle Ricerche and by the European Social Fund.
Article, publication date, and citation information can be found at www.plantphysiol.org/cgi/doi/10.1104/pp.005629.
LITERATURE CITED
- Alvarez ME, Pennell RI, Meijer PJ, Ishikawa A, Dixon RA, Lamb C. Reactive oxygen species intermediates mediate a systemic signal network in the establishment of plant immunity. Cell. 1998;92:773–784. doi: 10.1016/s0092-8674(00)81405-1. [DOI] [PubMed] [Google Scholar]
- Asada K. The water-water cycle in chloroplasts: scavenging of active oxygens and dissipation of excess photons. Annu Rev Plant Physiol Plant Mol Biol. 1999;50:601–639. doi: 10.1146/annurev.arplant.50.1.601. [DOI] [PubMed] [Google Scholar]
- Beligni MV, Lamattina L. Nitric oxide counteracts cytotoxic processes mediated by reactive oxygen species in plant tissues. Planta. 1999;208:337–344. [Google Scholar]
- Bellincampi D, Dipierro N, Salvi G, Cervone F, De Lorenzo G. Extracellular H2O2 induced by oligogalacturonides is not involved in the inhibition of the auxin-regulated rolB gene expression in tobacco leaf explants. Plant Physiol. 2000;122:1379–1385. doi: 10.1104/pp.122.4.1379. [DOI] [PMC free article] [PubMed] [Google Scholar]
- Callard D, Axelos M, Mazzolini L. Novel molecular markers for the late phases of the growth cycle of Arabidopsis thaliana cell-suspension cultures are expressed during organ senescence. Plant Physiol. 1996;112:705–715. doi: 10.1104/pp.112.2.705. [DOI] [PMC free article] [PubMed] [Google Scholar]
- Catani MV, Rossi A, Costanzo A, Sabatini S, Levrero M, Melino G, Avigliano L. Induction of gene expression via activator protein-1 in the ascorbate protection against UV-induced damage. Biochem J. 2001;356:77–85. doi: 10.1042/0264-6021:3560077. [DOI] [PMC free article] [PubMed] [Google Scholar]
- Clark D, Durner J, Navarre DA, Klessig DF. Nitric oxide inhibition of tobacco catalase and ascorbate peroxidase. Mol Plant-Microbe Interact. 2000;13:1380–1384. doi: 10.1094/MPMI.2000.13.12.1380. [DOI] [PubMed] [Google Scholar]
- Clarke A, Desikan R, Hurst RD, Hancock JT, Neill SJ. NO way back: nitric oxide and programmed cell death in Arabidopsis thaliana suspension cultures. Plant J. 2000;24:667–677. doi: 10.1046/j.1365-313x.2000.00911.x. [DOI] [PubMed] [Google Scholar]
- De Gara L, Tommasi F. Ascorbate redox enzymes: a network of reactions involved in plant development. Recent Res Dev Phytochem. 1999;3:1–15. [Google Scholar]
- De Leonardis S, De Lorenzo G, Borraccino G, Dipierro S. A specific ascorbate free radical reductase isozyme participates in the regeneration of ascorbate for scavenging toxic oxygen species in potato tuber mitochondria. Plant Physiol. 1995;109:847–851. doi: 10.1104/pp.109.3.847. [DOI] [PMC free article] [PubMed] [Google Scholar]
- De Leonardis S, Dipierro N, Dipierro S. Purification and characterization of an ascorbate peroxidase from potato tuber mitochondria. Plant Physiol Biochem. 2000;38:773–779. [Google Scholar]
- de Pinto MC, Francis D, De Gara L. The redox state of the ascorbate-dehydroascorbate pair as a specific sensor of cell division in tobacco BY-2 cells. Protoplasma. 1999;209:90–97. doi: 10.1007/BF01415704. [DOI] [PubMed] [Google Scholar]
- de Pinto MC, Tommasi F, De Gara L. Enzymes of the ascorbate biosynthesis and ascorbate-glutathione cycle in cultured cells of tobacco Bright-Yellow 2. Plant Physiol Biochem. 2000;38:541–550. [Google Scholar]
- Delledonne M, Xia Y, Dixon RA, Lamb C. Nitric oxide functions as a signal in plant disease resistance. Nature. 1998;394:585–588. doi: 10.1038/29087. [DOI] [PubMed] [Google Scholar]
- Delledonne M, Zeier J, Marocco A, Lamb C. Signal interactions between nitric oxide and reactive oxygen intermediates in the plant hypersensitive disease resistance response. Proc Natl Acad Sci USA. 2001;98:13454–13459. doi: 10.1073/pnas.231178298. [DOI] [PMC free article] [PubMed] [Google Scholar]
- Desikan R, Reynolds A, Hancock JT, Neill SJ. Harpin and hydrogen peroxide both initiate programmed cell death but have differential effects on defence gene expression in Arabidopsis suspension cultures. Biochem J. 1998;330:115–120. doi: 10.1042/bj3300115. [DOI] [PMC free article] [PubMed] [Google Scholar]
- Di Cagno R, Guidi L, De Gara L, Soldatini GF. Combined cadmium and ozone treatments affect photosynthesis and ascorbate-dependent defences in sunflower. New Phytol. 2001;151:627–636. doi: 10.1046/j.1469-8137.2001.00217.x. [DOI] [PubMed] [Google Scholar]
- Dorey S, Baillieul F, Saindrenan P, Fritig B, Kauffmann S. Tobacco class I and II catalases are differentially expressed during elicitor-induced hypersensitive cell death and localized acquired resistance. Mol Plant-Microbe Interact. 1998;11:1102–1109. [Google Scholar]
- Dorey S, Kopp M, Geoffroy P, Fritig B, Kauffmann S. Hydrogen peroxide from the oxidative burst is neither necessary nor sufficient for hypersensitive cell death induction, phenylalanine ammonia lyase stimulation, salicylic acid accumulation, or scopoletin consumption in cultured tobacco cells treated with elicitin. Plant Physiol. 1999;121:163–171. doi: 10.1104/pp.121.1.163. [DOI] [PMC free article] [PubMed] [Google Scholar]
- Durner J, Klessig DF. Nitric oxide as a signal in plants. Curr Opin Plant Biol. 1999;2:369–374. doi: 10.1016/s1369-5266(99)00007-2. [DOI] [PubMed] [Google Scholar]
- Durner J, Wendehenne D, Klessig DF. Defense gene induction in tobacco by nitric oxide, cyclic GMP, and cyclic ADP-ribose. Proc Natl Acad Sci USA. 1998;95:10328–10333. doi: 10.1073/pnas.95.17.10328. [DOI] [PMC free article] [PubMed] [Google Scholar]
- Houot V, Etienne P, Petitot AS, Barbier S, Blein JP, Suty L. Hydrogen peroxide induces programmed cell death features in cultured tobacco BY-2 cells in a dose-dependent manner. J Exp Bot. 2001;52:1721–1730. [PubMed] [Google Scholar]
- Jiménez A, Hernández JA, Pastori G, Del Rio LA, Sevilla F. Role of the ascorbate-glutathione cycle of mitochondria and peroxisomes in the senescence of pea leaves. Plant Physiol. 1998;118:1327–1335. doi: 10.1104/pp.118.4.1327. [DOI] [PMC free article] [PubMed] [Google Scholar]
- Lamb C, Dixon RA. The oxidative burst in plant disease resistance. Annu Rev Plant Physiol Plant Mol Biol. 1997;48:251–275. doi: 10.1146/annurev.arplant.48.1.251. [DOI] [PubMed] [Google Scholar]
- Levine A, Tenhaken R, Dixon R, Lamb C. H2O2 from the oxidative burst orchestrates the plant hypersensitive disease resistance response. Cell. 1994;79:583–593. doi: 10.1016/0092-8674(94)90544-4. [DOI] [PubMed] [Google Scholar]
- May JM, Mendiratta S, Hill KE, Burk RF. Reduction of dehydroascorbate to ascorbate by selenoenzyme thioredoxin reductase. J Biol Chem. 1997;272:22607–22610. doi: 10.1074/jbc.272.36.22607. [DOI] [PubMed] [Google Scholar]
- McDowell JM, Dangl JL. Signal transduction in the plant immune response. Trends Biochem Sci. 2000;25:79–82. doi: 10.1016/s0968-0004(99)01532-7. [DOI] [PubMed] [Google Scholar]
- Mittler R, Feng X, Cohen M. Post-transcriptional suppression of cytosolic ascorbate peroxidase expression during pathogen-induced programmed cell death in tobacco. Plant Cell. 1998;10:461–473. doi: 10.1105/tpc.10.3.461. [DOI] [PMC free article] [PubMed] [Google Scholar]
- Mittler R, Herr EH, Orvar BL, Van Camp W, Willekens H, Inzé D, Ellis BE. Transgenic tobacco plants with reduced capability to detoxify reactive oxygen intermediates are hyperresponsive to pathogen infection. Proc Natl Acad Sci USA. 1999;96:14165–14170. doi: 10.1073/pnas.96.24.14165. [DOI] [PMC free article] [PubMed] [Google Scholar]
- Mittler R, Lam E. Sacrifice in the face of foes: pathogen-induced programmed cell death in plants. Trends Microbiol. 1996;4:10–15. doi: 10.1016/0966-842x(96)81499-5. [DOI] [PubMed] [Google Scholar]
- Moran LK, Gutteridge JM, Quinlan GJ. Thiols in cellular redox signalling and control. Curr Med Chem. 2001;8:763–772. doi: 10.2174/0929867013372904. [DOI] [PubMed] [Google Scholar]
- Nagata T, Nemoto Y, Hasezawa S. Tobacco BY-2 cell line as the “HeLa” cell in the cell biology of higher plants. Int Rev Cytol. 1992;132:1–30. [Google Scholar]
- Noctor G, Arisi ACM, Jouanin L, Kunert KJ, Rennenberg H, Foyer CH. Glutathione: biosynthesis, metabolism and relationship to stress tolerance explored in transformed plants. J Exp Bot. 1998;49:623–647. [Google Scholar]
- Noctor G, Foyer CH. Ascorbate and glutathione: keeping active oxygen under control. Annu Rev Plant Physiol Plant Mol Biol. 1998;49:249–279. doi: 10.1146/annurev.arplant.49.1.249. [DOI] [PubMed] [Google Scholar]
- Noritake T, Kawakita K, Doke N. Nitric oxide induces phytoalexin accumulation in potato tuber tissues. Plant Cell Physiol. 1996;37:113–116. [Google Scholar]
- Parker JE, Coleman MJ. Molecular intimacy between proteins specifying plant-pathogen recognition. Trends Biochem Sci. 1997;22:291–296. doi: 10.1016/s0968-0004(97)01089-x. [DOI] [PubMed] [Google Scholar]
- Powis G, Briehl M, Oblong J. Redox signalling and the control of cell growth and death. Pharmacol Ther. 1995;68:149–173. doi: 10.1016/0163-7258(95)02004-7. [DOI] [PubMed] [Google Scholar]
- Privat C, Lantoine F, Bedioui F, Millanovoye van Brussel E, Devynck J, Devynck MA. Nitric oxide production by endothelial cells: comparison of three methods of quantification. Life Sci. 1997;61:1193–1202. doi: 10.1016/s0024-3205(97)00661-9. [DOI] [PubMed] [Google Scholar]
- Ribeiro EA, Cunha FQ, Tamashiro WM, Martins IS. Growth phase-dependent subcellular localization of nitric oxide synthase in maize cells. FEBS Lett. 1999;445:283–286. doi: 10.1016/s0014-5793(99)00138-6. [DOI] [PubMed] [Google Scholar]
- Ros Barceló A. Lignification in plant cell walls. Int Rev Cytol. 1997;176:87–132. [PubMed] [Google Scholar]
- Rubbo H, Radi R, Anselmi D, Kirk M, Barnes S, Butler J, Eiserich JP, Freeman BA. Nitric oxide reaction with lipid peroxyl radicals spares alpha-tocopherol during lipid peroxidation: greater oxidant protection from the pair nitric oxide/alpha-tocopherol than alpha-tocopherol/ ascorbate. J Biol Chem. 2000;275:10812–10818. doi: 10.1074/jbc.275.15.10812. [DOI] [PubMed] [Google Scholar]
- Saji H, Tanaka K, Kondo N. Monoclonal antibodies to spinach ascorbate peroxidase and immunochemical detection of the enzyme in eight different plant species. Plant Sci. 1990;69:1–9. [Google Scholar]
- Sarma AD, Sharma R. Purification and characterization of UV-B induced phenylalanine ammonia-lyase from rice seedlings. Phytochemistry. 1999;50:729–737. [Google Scholar]
- Solomon M, Belenghi B, Delledonne M, Menachem E, Levine A. The involvement of cysteine proteases and protease inhibitor genes in the regulation of programmed cell death in plants. Plant Cell. 1999;11:431–444. doi: 10.1105/tpc.11.3.431. [DOI] [PMC free article] [PubMed] [Google Scholar]
- Stamler JS. Redox signalling: nitrosylation and related target interactions of nitric oxide. Cell. 1994;78:931–936. doi: 10.1016/0092-8674(94)90269-0. [DOI] [PubMed] [Google Scholar]
- Vanacker H, Carver TL, Foyer CH. Pathogen-induced changes in antioxidant status of the apoplast in barley leaves. Plant Physiol. 1998;117:1103–1114. doi: 10.1104/pp.117.3.1103. [DOI] [PMC free article] [PubMed] [Google Scholar]
- Vanacker H, Carver TL, Foyer CH. Early H2O2 accumulation in mesophyll cells leads to induction of glutathione during the hyper-sensitive response in the barley-powdery mildew interaction. Plant Physiol. 2000;123:1289–1300. doi: 10.1104/pp.123.4.1289. [DOI] [PMC free article] [PubMed] [Google Scholar]
- Wink DA, Cook JA, Pacelli R, DeGraff W, Gamson J, Liebmann J, Krishna MC, Mitchell JB. The effect of various nitric oxide-donor agents on hydrogen peroxide-mediated toxicity: a direct correlation between nitric oxide formation and protection. Arch Biochem Biophys. 1996;331:241–248. doi: 10.1006/abbi.1996.0304. [DOI] [PubMed] [Google Scholar]
- Yamasaki H, Sakihama Y. Simultaneous production of nitric oxide and peroxynitrite by plant nitrate reductase: in vitro evidence for the NR-dependent formation of active nitrogen species. FEBS Lett. 2000;468:89–92. doi: 10.1016/s0014-5793(00)01203-5. [DOI] [PubMed] [Google Scholar]
- Zhang JX, Kirkham MB. Antioxidant responses to drought in sunflower and sorghum seedlings. New Phytol. 1996;132:361–373. doi: 10.1111/j.1469-8137.1996.tb01856.x. [DOI] [PubMed] [Google Scholar]


