

Abstract
A strong correlation was previously observed between carbon isotope discrimination (Δ13C) of phloem sap sugars and phloem sap sugar concentration in the phloem-bleeding tree Eucalyptus globulus Labill. (J. Pate, E. Shedley, D. Arthur, M. Adams [1998] Oecologia 117: 312–322). We hypothesized that correspondence between these two parameters results from covarying responses to plant water potential. We expected Δ13C to decrease with decreasing plant water potential and phloem sap sugar concentration to increase, thereby maintaining turgor within sieve tubes. The hypothesis was tested with analyses of E. globulus trees growing on opposite ends of a rainfall gradient in southwestern Australia. The Δ13C of phloem sap sugars was closely related to phloem sap sugar concentration (r = −0.90, P < 0.0001, n = 40). As predicted, daytime shoot water potential was positively related to Δ13C (r = 0.70, P < 0.0001, n = 40) and negatively related to phloem sap sugar concentration (r = −0.86, P < 0.0001, n = 40). Additional measurements showed a strong correspondence between predawn shoot water potential and phloem sap sugar concentration measured at midday (r = −0.87, P < 0.0001, n = 30). The Δ13C of phloem sap sugars collected from the stem agreed well with that predicted from instantaneous measurements of the ratio of intercellular to ambient carbon dioxide concentrations on subtending donor leaves. In accordance, instantaneous ratio of intercellular to ambient carbon dioxide concentrations correlated negatively with phloem sap sugar concentration (r = −0.91, P < 0.0001, n = 27). Oxygen isotope enrichment (Δ18O) in phloem sap sugars also varied with phloem sap sugar concentration (r = 0.91, P < 0.0001, n = 39), consistent with predictions from a theoretical model of Δ18O. We conclude that drought induces correlated variation in the concentration of phloem sap sugars and their isotopic composition in E. globulus.
Measurement of stable carbon and oxygen isotope ratios in plant material provides a valuable tool for studying the performance of terrestrial plants. For example, the strong correlation between discrimination against 13C (Δ13C) and the ratio of intercellular to ambient carbon dioxide concentrations (ci/ca) has been relied upon extensively to assess plant water use efficiency under a variety of experimental and natural conditions (for review, see Farquhar et al., 1989a; Ehleringer, 1993; Brugnoli and Farquhar, 2000). Farquhar et al. (1982) derived an expression relating Δ13C to ci/ca for C3 photosynthesis such that:
 |
1 |
where a is the fractionation caused by gaseous diffusion (4.4‰), and b is the effective fractionation caused by carboxylating enzymes (approximately 27‰). The Δ13C is defined with respect to atmospheric CO2 as Δ13C = Ra/Rp − 1, where Ra is 13C/12C of atmospheric CO2 and Rp is 13C/12C of plant material. Equation 1 suggests that Δ13C decreases linearly as ci/ca decreases. Because ci/ca represents a balance between the supply of CO2 via stomata and the photosynthetic demand for CO2, Δ13C is often employed as an indicator of the extent of drought stress experienced by a plant. Thus, as stomata close to conserve water, Δ13C decreases as a function of decreasing ci/ca. The advantage of measuring Δ13C of plant material is that it provides a time-integrated, rather than instantaneous, estimate of ci/ca.
Oxygen isotope enrichment in plant material (Δ18O), on the other hand, is partly controlled by the evaporative enrichment of 18O in leaf water. Sugars immediately exported from the leaf are presumed to be in close isotopic equilibrium with the water in which they formed (Farquhar et al., 1998; Barbour et al., 2000b, 2003), after taking into account an equilibrium fractionation of approximately +27‰ (Sternberg and DeNiro, 1983; Sternberg et al., 1986). A proportion of the oxygen atoms in the exported sugars exchanges with local water during subsequent metabolism; however, the leaf water signal is expected to persist unaltered during translocation until the sugar molecules are broken down into derivative molecules containing carbonyl bonds (Barbour et al., 2003). Leaf water heavy isotope enrichment at evaporative sites (Δ18Oe) has been modeled after Craig and Gordon (1965), Dongmann et al. (1974), and Farquhar et al., (1989b):
 |
2 |
where ε* is the equilibrium fractionation between liquid and vapor, εk is the kinetic fractionation that occurs during diffusion from the leaf to the atmosphere, Δ18Ov is the isotopic enrichment of atmospheric vapor compared with source water, and ea/ei is the ratio of ambient to intercellular vapor pressures. The εk can be calculated as εk(‰) = (28rs + 19rb)/(rs + rb), where rs and rb are the stomatal and boundary layer resistances to water vapor diffusion, and the coefficients 28 and 19 are the associated fractionation factors (Farquhar et al., 1989b). The Δ18O in atmospheric water vapor, plant water, and plant organic material is defined with respect to the oxygen isotope ratio of source water as Δ18Ox = Rx/Rs − 1, where Rx is 18O/16O of atmospheric vapor, plant water, or organic material, and Rs is 18O/16O of source water. The average isotopic enrichment of water in the leaf mesophyll (Δ18OL) can then be related to the isotopic enrichment at evaporative sites by (Farquhar and Lloyd, 1993):
 |
3 |
The ℘ is a dimensionless number termed the Péclet number, which is defined as EL/(CD), where E is transpiration rate (moles per meter squared per second), L is a scaled effective path length (meters), C is the molar concentration of water (moles per meter cubed), and D is the diffusivity of H218O in water (m2 s−1).
A potentially useful application of Δ18O in plant material is as an integrated measure of stomatal conductance and transpiration rate (Barbour and Farquhar, 2000). At a given air temperature and humidity, Equation 2 suggests that Δ18Oe will decrease with increasing stomatal conductance (and, therefore, transpiration rate) as a result of evaporative cooling of the leaf and consequent lowering of ea/ei. In addition, increased stomatal conductance decreases εk, thereby further decreasing Δ18Oe. Finally, increased transpiration increases the Péclet number, which decreases Δ18OL, as seen in Equation 3. The influence of increased stomatal conductance on ea/ei, εk, and ℘ is opposed by an increase in ε* with decreasing leaf temperature; however, the increase in ε* is rather small, namely a change from 9.2‰ at 25°C to 9.6‰ at 20°C. Thus, Δ18O can potentially compliment the use of Δ13C by providing information about stomatal conductance independently of the effects of photosynthetic demand for CO2 on ci/ca.
Significant variation in Δ13C of phloem sap sugars was recently observed in the phloem-bleeding tree Eucalyptus globulus Labill. growing in southwestern Australia (Pate and Arthur, 1998); variation occurred between rain-fed plantations experiencing drought stress and irrigated plantations, and seasonally within rain-fed plantations in correspondence with seasonal rainfall patterns. Based on the data provided by Pate and Arthur (1998), phloem sap sugar Δ13C appeared to integrate drought stress more directly, and over more physiologically relevant timescales, than did whole-tissue Δ13C. An additional advantage was the relative ease of analyzing phloem sap, which was so dominated by photosynthetic sugars that it did not require further extraction, as would be the case in the analysis of leaf soluble sugars or starch.
In a companion paper, Pate et al. (1998) reported a strong relationship between phloem sap sugar Δ13C and phloem sap sugar concentration in E. globulus. According to the pressure flow hypothesis of phloem translocation (Münch, 1930), photosynthate is distributed from source to sink regions within a plant via gradients in turgor within sieve tubes generated by the loading and unloading of sugars. The amount of turgor borne by a sieve tube depends, in part, on the water potential of the apoplastic reservoir surrounding it:
 |
4 |
where P is the hydrostatic pressure within the sieve tube, Ψ is the symplastic water potential (assumed equal to that of the apoplast when the system is in stationary state), and Π is the osmotic pressure within the sieve tube. The importance of the apoplastic water potential in the phloem system has been recognized explicitly in formal descriptions of the Münch hypothesis (e.g. Christy and Ferrier, 1973; Tyree et al., 1974; Goeschl et al., 1976; Smith et al., 1980; Sheehey et al., 1995), and attention has been drawn to the role of water potential gradients in determining the partitioning of photosynthate among multiple sinks (Lang and Thorpe, 1986; Daudet et al., 2002). One might then hypothesize that as the water potential of a plant decreases during drought stress, the osmotic pressure within the sieve tubes will increase to provide the turgor necessary for continued functioning of the phloem. Experimental evidence in support of this concept was obtained for Ricinus communis, wherein the concentration of solutes in phloem sap increased in response to withholding water (Hall and Milburn, 1973), and the loading of Suc into the phloem appeared to be turgor pressure dependent (Smith and Milburn, 1980).
These considerations led us to investigate the possibility that variation in plant water potential causes correlated changes in phloem sap sugar concentration and phloem sap sugar Δ13C in E. globulus. The hypothesis is conceptualized in Figure 1. In addition, we compared the Δ13C measured in the phloem sap sugars with that predicted from instantaneous measurements of ci/ca to assess the validity of applying Equation 1 to the E. globulus system. Finally, we report on a strong relationship between Δ18O in phloem sap sugars and the phloem sap sugar concentration and postulate that this relationship can also be mechanistically accounted for through consideration of plant water relations.
Figure 1.
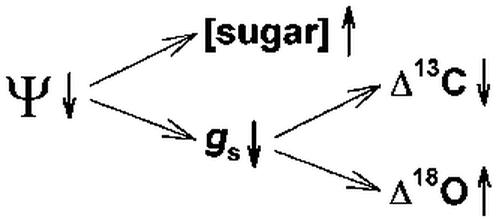
A conceptual diagram showing the hypothesized relationships among investigated variables. We expected phloem sap sugar concentration ([sugar]) and stomatal conductance (gs) to vary in response to variation in plant water potential and carbon (Δ13C) and oxygen (Δ18O) isotope discrimination to vary consequently in response to variation in stomatal conductance.
RESULTS
The strong relationship between phloem sap sugar Δ13C and phloem sap sugar concentration previously observed by Pate et al. (1998) featured prominently in the present data set (Fig. 2A). Values for Δ13C spanned a range of 10‰, and values for sugar concentration spanned a range of 0.3 mol L−1. The Pearson correlation coefficient (r) relating the two variables was −0.90 (P < 0.0001, n = 40), indicating a very strong, negative, linear covariance. There was also a very strong correlation between phloem sap sugar concentration and instantaneous ci/ca (Fig. 2B), with a correlation coefficient of −0.91 (P < 0.0001, n = 27). In addition, significant correlation was observed between Δ13C of phloem sap sugars and shoot water potential (r = 0.70, P < 0.0001, n = 40).
Figure 2.

A, Δ13C measured in phloem sap sugars; and B, instantaneous ci/ca plotted against phloem sap sugar concentration for E. globulus samples collected from three plantations in southwestern Australia in February 2002. Site 1, Drought-stressed Mount Barker plantation; site 2, relatively unstressed Denmark plantation; site 3, intermediate Denmark plantation. Each datum corresponds to one tree. Phloem sap was collected from the stem at approximately two-thirds the height of the live crown. Instantaneous ci/ca was measured on five to 10 leaves at the same canopy height and averaged for each tree.
Stomatal conductance, photosynthesis and ci/ca varied among trees growing in the three plantations. The lowest stomatal conductance values were recorded at the Mount Barker plantation and the drier Denmark plantation, and the highest values at the wetter Denmark plantation. Average stomatal conductances for individual trees ranged from 0.02 to 0.56 mol water m−2 s−1. Average photosynthetic rates ranged from 1.7 to 13.0 μmol CO2 m−2 s−1. Curvature in the relationship between average values for stomatal conductance and photosynthesis suggested variation in ci/ca among the population of trees sampled.
The measured variation in instantaneous ci/ca correlated with Δ13C of phloem sap sugars (Fig. 3). The observed relationship was close to that predicted by Equation 1. A linear regression through the data yielded the relationship Δ13C = 1.7 + 25.3ci/ca, with the 95% confidence intervals extending from −1.5‰ to 4.9‰ for the intercept and 20.1‰ to 30.5‰ for the slope. With the intercept forced through 4.4‰ (the theoretical value for a), the regression yielded a slope estimate of 21.0‰, with the 95% confidence interval extending from 19.9‰ to 22.2‰.
Figure 3.

Δ13C measured in phloem sap sugars collected from E. globulus stems plotted against instantaneous ci/ca. Gas exchange measurements took place at the same canopy height as the phloem sap collections; instantaneous ci/ca values are the average of five to 10 measurements per tree. Each datum represents one tree. Site numbers refer to different plantations as described in the caption of Figure 2.
Both daytime and predawn shoot water potential correlated strongly with daytime phloem sap sugar concentration (Fig. 4, A and B), with correlation coefficients of −0.86 (P < 0.0001, n = 40) and −0.87 (P < 0.0001, n = 30), respectively. Recall that the two sets of measurements took place on different trees. As seen in Figure 4A, the data for daytime shoot water potential and sugar concentration tended to separate into two populations when plotted against each other, with the trees from the two Denmark plantations having less negative water potentials and lower sugar concentrations than those from the Mount Barker plantation. The slope of the relationship between shoot water potential and daytime phloem sap sugar concentration did not differ significantly depending on whether shoot water potential was measured predawn or during the day (P = 0.07, n = 70). However, intercepts for the two relationships were significantly different (P < 0.0001, n = 70).
Figure 4.

Phloem sap sugar concentration plotted against daytime (A) and predawn (B) shoot water potential for E. globulus growing in southwestern Australia. Phloem sap was collected from the main stem at about two-thirds the height of the live crown for A and at approximately 1.4-m height for B. Shoot water potential was measured on four twigs per tree at the same canopy height as the phloem sap was collected from and averaged for each tree. Each datum corresponds to one tree. Daytime and predawn measurements were conducted on different trees at different plantations. Different symbols in A show the separation among plantations; site 1 is the Mount Barker plantation, whereas sites 2 and 3 are the two Denmark plantations.
The osmotic pressure exerted by phloem sap sugars sampled from the stem was generally in excess of that required to balance the daytime apoplastic shoot water potential for the trees in the two Denmark plantations but not greatly in excess for trees in the Mount Barker plantation, which showed the most negative daytime shoot water potentials (Fig. 5). The slope of the relationship between daytime phloem sap sugar osmotic pressure and daytime shoot water potential had a value of −0.61, which was significantly different from −1 (P < 0.0001). This suggested significant variation in the amount of turgor borne by sieve tubes in the stems across the range of shoot water potentials encountered in the study.
Figure 5.

Phloem sap sugar osmotic pressure plotted against daytime shoot water potential. Osmotic pressure estimates were derived from measurements of phloem sap sugar concentration. Note that phloem sap was collected from the stem, whereas shoot water potential was measured in terminal shoots. Each datum represents one tree. Site 1 is the Mount Barker plantation, and sites 2 and 3 are the two Denmark plantations.
The Δ18O of phloem sap sugars correlated strongly with the phloem sap sugar concentration (Fig. 6A), with a correlation coefficient of 0.91 (P < 0.0001, n = 39) and with daytime shoot water potential (r = −0.78, P < 0.0001, n = 39). Values of phloem sap sugar Δ18O spanned a range of 8‰, with the lowest values (39.0‰–41.7‰) being recorded at the wetter Denmark plantation, intermediate values (42.3‰–43.7‰) at the drier Denmark plantation, and highest values (43.7‰–47.0‰) at the Mount Barker plantation. The Δ13C and Δ18O of phloem sap sugars correlated negatively with each other (Fig. 6B; r = −0.92, P < 0.0001, n = 39). The phloem sap sugar Δ18O also correlated negatively with the instantaneous, cuvette-based measurements of transpiration rate (Fig. 6C), with a correlation coefficient of −0.85 (P < 0.0001, n = 27). The theoretical model of Δ18O, summarized in Equations 2, 3, 5, and 6 predicted values ranging from 47.3‰ to 38.3‰ over the observed range of stomatal conductances (0.02–0.56 mol water m−2 s−1). This predicted range of Δ18O values agreed well with the observed range (47.0‰–39.0‰), suggesting that the observed variation in Δ18O could in fact be accounted for by varying only one term in the model, i.e. stomatal conductance. For comparison, a sensitivity analysis is presented in Table I showing the effect of varying terms in the model other than stomatal conductance. The amount of variation in leaf temperature predicted by Equation 5 over the observed range of stomatal conductances was 2.8°C. This can be compared with observed differences in leaf temperature of approximately 1°C in Eucalyptus pauciflora for stomatal conductance values ranging from 0.3 to 0.6 mol m−2 s−1 (J. Egerton, personal communication); over that range, Equation 5 predicts a difference of 1.1°C. The best fit between modeled and observed Δ18O values was found when the equilibrium fractionation between leaf water and exported sugars was assumed to be 28‰. Note that varying this parameter from 27‰ to 28‰ affects the absolute values predicted for Δ18O, but does not affect the range of values predicted.
Figure 6.

Oxygen isotope enrichment (Δ18O) of phloem sap sugars in E. globulus plotted against: A, the sugar concentration of the phloem sap; B, the carbon isotope discrimination (Δ13C) of the phloem sap sugars; and C, cuvette-based measurements of transpiration rate made concurrently with the phloem sap collections. Samples were collected in February 2002 from trees growing in three plantations in southwestern Australia. Site numbers are as described in the caption to Figure 2. Each datum corresponds to one tree. Transpiration was measured on five to 10 leaves and averaged for each tree. The theoretical line in C was derived from Equations 2, 3, and 5 in the main text. The theoretical relationship is that expected if variation in phloem sap sugar Δ18O resulted exclusively from variation in stomatal conductance and, therefore, transpiration rate.
Table I.
A sensitivity analysis showing the effect of varying different parameters in the phloem sap sugar Δ18O model, in relation to the effect of varying stomatal conductance over the observed range of conductance values
| Parameter | Model Component Affected | Change to Value of Parameter | Predicted Change in Δ18O |
|---|---|---|---|
| ‰ | |||
| Stomatal conductance (mol water m−2 s−1) | Equations 2, 5, and 6a | 0.02 to 0.56 | −9.0 |
| Wind speed (m s−1) | Equations 2, 5, and 6 | 2 to 10 | −0.4 |
| Leaf area (cm2) | equations 2, 5, and 6 | 20 to 100 | 0.2 |
| Air temperature (°C) | Equations 2, 5, and 6 | 15 to 25 | −2.9 |
| Relative humidity (%) | Equations 2, 5, and 6 | 50 to 60 | −1.8 |
| Barometric pressure (mbar) | Equations 5 and 6 | 950 to 1,050 | 0.9 |
| Photosynthetically active radiation (PAR; μmol m−2 s−1) | Equations 5 and 6 | 500 to 1,500 | 1.4 |
| scaled effective path length (mm) | Equation 3 | 20 to 40 | −2.4 |
| Atmospheric vapor Δ18O (‰) | Equation 2 | −8.6 to −10.6 | −0.8 |
DISCUSSION
Although further experimental testing is warranted, the results obtained in this study strongly support our hypothesis as conceptualized in Figure 1. Thus, it appears that variation in plant water potential induces correlated changes in phloem sap sugar concentration and the current Δ13C and Δ18O of E. globulus trees. The resulting correspondence between these parameters suggests the intriguing possibility of interpreting phloem sap sugar concentration in terms of plant responses to the environment, and in particular to drought stress.
The relationship between phloem sap sugar concentration and Δ13C of phloem sap sugars appears to be extremely well conserved for E. globulus growing in southwestern Australia. Pate et al. (1998) reported the regression equation [sug] = 1.05 − 0.025Δ13C(‰), where [sug] is phloem sap sugar concentration expressed as moles per liter, and the regression has an R2 value of 0.69. For the present data set, we obtained the regression equation [sug] = 1.06 − 0.024Δ13C(‰), with an R2 value of 0.81. The relationship that we observed was nearly identical to that observed previously. The Pate et al. (1998) data were derived from bulked phloem sap samples collected from 37 plantations distributed across southwestern Australia, such that each datum represented one plantation. Therefore, the present data set serves to confirm on an individual tree basis what was found previously on a plantation basis.
Phloem-bleeding sap has also been collected from Fagus sylvatica growing in the south of Germany and assayed for both its sugar concentration and the Δ13C of the sugars (Gessler et al., 2001). In that study, stand density was manipulated to varying degrees, which was expected to impact on soil water availability and, therefore, Δ13C. Sampling also took place on slopes of differing aspect, which introduced further variation in Δ13C. Combining data from the different basal area treatments, slope aspects, and sampling dates resulted in a negative correlation between Δ13C in phloem sap sugars and phloem sap sugar concentration for F. sylvatica, as expected from the hypothesis described by Figure 1. Although Gessler et al. (2001) did not provide a statistical analysis of the combined data set, the relationship does not appear to be as strong as the one that we observed. For F. sylvatica, sugar concentrations ranged from 0.1 to 0.4 mol L−1, whereas in the present study concentrations ranged from 0.5 to 0.8 mol L−1. The relationship between phloem sap sugar concentration and Δ13C has also been observed to become weaker in E. globulus when phloem sap sugar concentrations are lower and soil water more plentiful (D.J. Arthur and J.S. Pate, unpublished data); presumably, this reflects a more limited role of stomata in causing variation in ci/ca at such times.
A negative relationship between phloem sap sugar concentration and phloem sap sugar Δ13C was previously observed in Lupinus angustifolius, where the sap was collected at different times over a diurnal cycle, and sugar concentrations varied over a relatively narrow range of from 0.33 to 0.38 mol L−1 (Cernusak et al., 2002). In the present study with E. globulus, we could not resolve a diurnal pattern of variation in either the concentration or Δ13C of phloem sap sugars. This result contrasts with earlier results for E. globulus reported by Pate and Arthur (2000), in which a diurnal pattern in phloem sap sugar concentrations of stems and to a greater extent branches was observed, particularly between samples collected during the day and those collected at night. It is probable that in the present study such a diurnal pattern was obscured by inter-tree variability within the sampled plantations because all sequential sampling occurred on different trees. In addition, a diurnal pattern may have been less apparent because we only sampled stems and only sampled during the day.
An apparently strong relationship was previously observed between shoot water potential and Δ13C of phloem sap sugars in F. sylvatica (Gessler et al., 2001). The relationship reported in terms of δ13C was δ13C(‰) = −3.93SWP − 30.7, where SWP is shoot water potential (megapascals). If we express our data in the same terms, we obtain a relationship for E. globulus of δ13C(‰) = −4.60SWP − 32.0 (R2 = 0.49, P < 0.0001, n = 40), reasonably similar to that obtained for F. sylvatica. Extrapolating the regression equations to their respective values at which Δ13C = 4.4‰ (or δ13C = −12.2‰) results in shoot water potential estimates of −4.7 MPa for F. sylvatica and −4.3 MPa for E. globulus. The discrimination value of 4.4‰ is the value expected when stomata are completely closed, foregoing issues associated with molecular flow at very low stomatal conductances (Farquhar and Lloyd, 1993). These values can be compared with a water potential estimate of −2.1 MPa for L. angustifolius when Δ13C = 4.4‰ (Cernusak et al., 2002). Not surprisingly, the estimates of water potential values at complete stomatal closure for the two long-lived, woody tree species are substantially lower than for the herbaceous annual. Such analyses could prove useful in determining the extent of drought stress that different species or genotypes are capable of tolerating.
Slopes of the relationship between shoot water potential and δ13C have also been reported for δ13C of leaf tissue and wood. A slope of −0.18‰ MPa−1 was reported for leaves of Quercus pubescens and Quercus ilex growing in southern France (Damesin et al., 1998), whereas slopes ranging from −1.8 to −3.1‰ MPa−1 were reported for wood of Pinus radiata and Pinus pinaster growing in southwestern Australia (Warren et al., 2001). The slope that we report for phloem sap sugars of E. globulus of −4.6‰ MPa−1 differs from those just mentioned in that it was derived from measurements of daytime shoot water potential, rather than predawn shoot water potential. Nonetheless, slopes among species appear to vary over a large range. It is possible that some of the variation can be accounted for by considering the different sampling techniques. Whole-tissue measurements potentially include considerable uncertainty about the period during which the carbon comprising the tissue was assimilated. On the other hand, the strong correspondence between phloem sap sugar Δ13C and instantaneously measured ci/ca presently reported for E. globulus provides clear evidence that phloem sap sugars provide an accurate estimate of the current Δ13C of the plant.
We observed a slope for the relationship between Δ13C of phloem sap sugars and instantaneous ci/ca of 21.0‰ when the intercept was forced through 4.4‰, as prescribed by Equation 1. This relationship yields a value for b, the effective discrimination by carboxylating enzymes, of 25.4‰. This is consistent with the value of 25.7‰ estimated for b from measurements of leaf soluble sugars in Populus nigra × deltoids, Gossypium hirsutum, and Phaseolus vulgaris (Brugnoli et al., 1988), and 25.0‰ estimated from leaf soluble sugars in G. hirsutum and Oryza sativa (Brugnoli and Farquhar, 2000). Possible reasons for the deviation of b values estimated from analyses of leaf soluble sugars from the suggested value of 27‰ have been discussed in detail by Brugnoli and Farquhar (2000). They include the effects of low mesophyll conductance to CO2, and possibly fractionation during dark respiration and photorespiration. The same set of potential mechanisms affecting apparent values of b observed in leaf soluble sugars should also apply to those observed in phloem sap sugars, with the one possible exception being the potential for fractionation during phloem loading. However, to date, such a phenomenon has not been demonstrated.
Data plotted in Figure 5 suggest that the amount of turgor conferred by sugars in the phloem sap is not homeostatically maintained across the range of apoplastic shoot water potentials sampled in E. globulus. The relationship between daytime phloem sap osmotic pressure in the stem and daytime shoot water potential had a slope greater than −1, suggesting more turgor at less negative water potentials than at more negative water potentials. This pattern was also reflected in the bleeding behavior of the trees, with trees that had less negative water potentials bleeding more profusely than those with more negative water potentials. In their earlier E. globulus sampling efforts, Pate et al. (1998) remarked, “Failure to bleed was rare but encountered occasionally when severely water stressed plantations were sampled during very hot afternoons of late summer and autumn. Even then, the same trees produced sap when sampled after recovery of water stress the following evening.” This would suggest that only under the most severe conditions of drought stress is there a lack of turgor in the sieve tubes of E. globulus.
There are some complications involved in attempting to make precise quantitative estimates of stem phloem turgor based on the data plotted in Figure 5. Phloem sap was collected from main stems, whereas shoot water potential was measured on terminal shoots. One would expect the daytime water potential in the stem to be less negative than that in the terminal twigs, which would tend to shift the relationship in Figure 5 toward a less negative apoplastic water potential for a given osmotic pressure, thereby resulting in higher estimated turgor pressures in the sieve tubes. However, it also seems likely that the effective osmotic pressure will be less than that estimated from the sugar concentration of the sap because the reflection coefficient of the sieve tube membranes and sieve plates is likely less than unity. The quantitative significance of these two factors is difficult to estimate, particularly because the associated biases are in opposing directions.
However, if we ignore these complications, sieve tube turgor estimates for E. globulus range from −0.2 to 0.8 MPa. These can be compared with previously reported values ranging from 0.7 to 1.2 MPa for stem phloem in Fraxinus americana, 0.9 to 1.1 MPa for stem phloem in R. communis (Milburn, 1980), and a value of 1.1 MPa for leaf phloem in Hordeum vulgare (Pritchard, 1996). In those studies, xylem water potentials were −0.7, − 0.5, and −0.2 MPa, respectively, all somewhat less negative than the shoot water potentials recorded in the present study. However, in peduncles of Triticum aestivum, sieve tube turgor pressures of 2.4 and 1.4 MPa were observed at apoplastic water potentials of −0.4 and −2.1 MPa, respectively (Fisher and Cash-Clark, 2000). This decrease in phloem sap turgor with increasing drought stress, as also seen for E. globulus in Figure 5, is likely to be qualitatively meaningful. If one assumes that the net assimilation rate of the canopy of a tree determines the translocation rate from the canopy, and that the translocation rate is proportional to the turgor gradient from source to sink, then it follows that a reduction in canopy photosynthesis due to stomatal closure will reduce the amount of photosynthate available for translocation and result in a smaller turgor gradient between the source and sink, likely caused by less turgor at the source.
We found that the observed variation in stomatal conductance across the study was sufficient to account for the range of values observed in Δ18O of phloem sap sugars. Meteorological data from Mount Barker and Albany, Western Australia suggest very little or no difference in average relative humidity among the study sites for the 3 weeks preceding measurements (Table II). Similarly, there is no a priori reason to expect the isotopic composition of atmospheric water vapor to differ between the Mount Barker and Denmark sites, and, as noted previously, we have observed no difference in xylem water δ18O between the Mount Barker plantation and the wetter Denmark plantation. Thus, there would not appear to be a basis for invoking variation in parameters in the Δ18O model other than stomatal conductance and transpiration rate in seeking the most parsimonious explanation for the observed variation in Δ18O of phloem sap sugars. The separation of Δ18O values in the two Denmark plantations provides further support for this interpretation because these two sites were only 2 km apart and, therefore, would have likely experienced identical source water, atmospheric vapor δ18O, and temperature and humidity regimes.
Table II.
Average meteorological conditions over the first 3 weeks of February reported by weather stations in Mount Barker (34°37′30′′ S, 117°38′10′′ E) and Albany (34°56′35′′ S, 117°48′03′′ E), Western Australia
| Parameter | Mount Barker 9 am | Mount Barker 3 pm | Albany 9 am | Albany 3 pm |
|---|---|---|---|---|
| Relative humidity (%) | 67 | 49 | 67 | 51 |
| Air temperature (°C) | 17 | 21 | 18 | 21 |
| Wind speed (m s−1) | 4.2 | 4.4 | 5.8 | 7.5 |
Albany is a coastal town approximately 50 km west of Denmark that should experience similar weather patterns to Denmark. Albany is the nearest operating weather station to Denmark. Total precipitation over the period was 8.0 mm at Mount Barker and 8.4 mm at Albany.
The Δ18O of total dry matter in leaves collected from the Mount Barker plantation and the wetter Denmark plantation was measured in a separate set of experiments (L. Cernusak, unpublished data). Values were 33.5‰ ± 0.3‰ (mean ± se) for the Mount Barker plantation and 31.0‰ ± 0.1‰ for the Denmark plantation, showing that the difference in Δ18O observed in phloem sap sugars is also reflected in leaf dry matter. Whereas the average difference between the two plantations for phloem sap sugars was 5.1‰, the average difference for leaf dry matter was 2.5‰. This difference is to be expected, given that during the conversion of phloem sap sugars to leaf dry matter some of the oxygen atoms of the sugars are replaced by those of medium water. In addition, leaf dry matter would integrate over a longer time period than would phloem sap sugars, most likely encompassing periods when differences in drought stress between the two plantation were less pronounced than at the time of phloem sap sampling.
Because stomatal conductance impacts upon the Δ18O model at multiple points, the predicted effect of variation in this parameter was relatively large compared with that which might have been caused by variation in other model parameters (Table I). The modeling exercise allowed us to partition the predicted variation in Δ18O because of variation in stomatal conductance into components due to variation in ea/ei (resulting from variation in leaf cooling), εk, and ℘. The εk varied from 27.9‰ at a stomatal conductance of 0.02 mol water m−2 s−1 to 26.4‰ at a conductance of 0.56 mol water m−2 s−1. Because we assumed that Δ18Ov = −ε*, Equation 2 simplifies to Δ18Oe = (ε* + εk)(1 − ea/ei). At a common ea/ei of 0.5, the variation in εk would equate to a difference of 0.8‰ in Δ18Oe. The variation in Δ18Oe resulting from variation in ea/ei due to differences in evaporative cooling of the leaf at the minimum and maximum observed stomatal conductances for a given εk of 27‰ would be 2.9‰. Finally, the difference in Δ18OL between the minimum and maximum observed stomatal conductances resulting from variation in ℘ for a given Δ18Oe of 17‰ would be 5.7‰. Thus, it can be seen that most of the variation in Δ18O of phloem sap sugars occurring as a result of variation in stomatal conductance across the natural rainfall gradient in southwestern Australia was likely caused by variation in ℘ and leaf temperature.
We found that an equilibrium fractionation between predicted leaf water δ18O and phloem sap sugar δ18O of 28‰ resulted in a better fit of modeled to observed data than the commonly assumed value of 27‰. The possibility exists that the δ18O of the leaf water in the cytosol of the mesophyll cells with which Suc equilibrates before export differs slightly from the bulk leaf water δ18O, as suggested in previous and recent leaf water modeling efforts (Leaney et al., 1985; Yakir et al., 1989, 1990; Yakir, 1992; Farquhar and Gan, 2003). We are currently conducting further research into this question.
Phloem exudation after an incision in the bark has been demonstrated for many tree species (Zimmerman, 1960). Pate et al. (1998) observed exudation of collectable amounts of sap in 14 Eucalyptus spp., in addition to E. globulus. Phloem bleeding for the purpose of sap collection also has been demonstrated in herbaceous plants; for example, R. communis (Milburn, 1970) and several legumes (Pate et al., 1974). Results of this study, and those conducted previously with E. globulus (Pate and Arthur, 1998, 2000; Pate et al., 1998; D.J. Arthur and J.S. Pate, unpublished data) highlight the potential of phloem sap analyses for revealing information about the current physiological status of the plant. Such analyses could prove very useful in optimizing the management of E. globulus plantations, and the potential exists for their application in other cropping systems as well. The measurement of phloem sap sugar concentrations, in particular, is rapid and inexpensive and can be easily achieved in a field setting. We have demonstrated strong correspondence between the phloem sap sugar concentration of E. globulus and several measures of its physiological response to drought stress. Results suggest a very strong potential for the application of the measurement and interpretation of phloem sap sugar concentrations for the purposes of both plantation management and ecophysiological research.
MATERIALS AND METHODS
We measured daytime shoot water potential, phloem sap sugar concentration, phloem sap sugar Δ13C, phloem sap sugar Δ18O, and instantaneous gas exchange in 40 Eucalyptus globulus Labill. trees selected from three rain-fed plantations located in southwestern Australia. The three plantations were chosen such that the study would encompass a selection of trees ranging from relatively unstressed to very stressed. Sampling took place between February 21 and 23, 2002, a time that would ordinarily correspond to peak drought stress in the Mediterranean-type environment of southwestern Australia. Site 1 was located near Mount Barker, western Australia (34°32′28′′S, 117°30′24′′ E), a region on the lower rainfall limit of E. globulus plantations averaging approximately 600 mm of annual precipitation. Trees were planted in 1999 and were approximately 6 m tall at the time of sampling. Site 2, the wettest of the plantations, was located near the township of Denmark, Western Australia (34°58′45′′ S, 117°20′06′′ E), in a region that averages approximately 1,400 mm annual precipitation. The sampled trees at site 2 were located at the base of a small hill, where we expected soil moisture content to be relatively high. Trees were planted in 1999 and were approximately 10 m tall at the time of sampling. Trees from a third plantation (site 3), thought to be intermediate between the wet and dry plantations, were also sampled. Site 3 was also located near Denmark, Western Australia (34°58′43′′ S, 117°19′02′′ E), but sampled trees were located high on the slope of a hill; thus, the trees were expected to have a lower soil water availability than those at site 2. This plantation was also a 1999 planting. Average weather conditions in the vicinity of the sampling sites over the 3 weeks preceding sampling are given in Table II.
Trees were sampled sequentially through the day over a single day at each plantation, starting in the early morning and concluding in the late afternoon. Thus, the study comprised 10 to 15 trees from each plantation. Shoot water potential was measured on four twigs of approximately 5-mm diameter from each tree using a Scholander-type pressure chamber (Scholander et al., 1965). A large ladder was used to access the canopy. Twig samples for water potential measurements were collected from a single canopy height that was approximately two-thirds the height of the live crown. At the same canopy level, phloem sap was collected from the main stem using the bleeding technique described previously (Pate et al., 1998). Phloem sap sugar concentration (w/v) was measured at the time of sap collection using a temperature-compensated, hand-held refractometer (Bellingham and Stanley, London), previously calibrated against HPLC measurements of sugar concentration (Pate et al., 1998). Gas exchange was measured on five to 10 leaves per tree at the same canopy level using an LCA 4 Portable Gas Exchange System (ADC BioScientific Ltd., Hertfordshire, UK) at the same time that water potential and sugar concentration measurements were taking place. Sugar concentration values measured on a weight per volume basis on the refractometer were converted to molar concentrations by assuming the sugar fraction of the sap to comprise 70% Suc and 30% raffinose on a weight basis (see Tables II and III in Pate et al., 1998). This was the mean value for the relative concentrations of the two sugars observed across a range of 29 E. globulus plantations in southwestern Australia. The sd of the ratio was 10%; an error of two sds would lead to approximately a 7% difference in our calculated molar sugar concentrations.
We made additional measurements of predawn shoot water potential followed by measurements of midday phloem sap sugar concentration to further investigate the relationship between the two parameters and to see whether predawn or daytime shoot water potential correlated more strongly with daytime sugar concentration. Phloem sap was collected from stems at approximately 1.4 m height above the ground. These measurements took place at various E. globulus plantations in southwestern Australia in close proximity (within 100 km) to the primary study plantations in which the more detailed measurements took place.
Phloem sap sugar concentrations were converted to osmotic pressures according to the relationship given by Nobel (1991), which was based on measurements of the freezing point depression of Suc solutions at 20°C (Weast and Lide, 1989). Raffinose was assumed to have the same relationship between molar concentration and osmotic pressure as Suc. Data for photosynthesis, stomatal conductance, and ci/ca were averaged for each tree. Measurements taken at irradiances less than 400 μmol PAR m−2 s−1 were excluded from the analyses so that the effects of water stress on gas exchange could be analyzed independently of the effects of low irradiance. The value of 400 μmol PAR m−2 s−1 was chosen based on a plot of photosynthesis versus irradiance for the unstressed plantation, in which there appeared to be little increase in photosynthesis with increasing irradiance beyond PAR values of 400 μmol m−2 s−1.
The stable carbon and oxygen isotope ratios of phloem sap dry matter were determined on 5-μL phloem sap samples from which the water was evaporated overnight at 60°C in a drying oven. Carbon isotope analyses were conducted with an Isochrom mass spectrometer (Micromass, Manchester, UK) coupled to a Carlo Erba elemental analyzer (CE Instruments, Milan) operating in continuous flow mode. Oxygen isotope ratios were measured by a second Isochrom mass spectrometer after pyrolysis in a Carlo Erba elemental analyzer (Farquhar et al., 1997). Carbon and oxygen isotope ratios were obtained in δ-notation, where δ = R/Rstandard − 1 and R and Rstandard are the isotope ratios of the sample and standard (PDB for carbon and VSMOW for oxygen), respectively. The δ13C values were then converted to Δ13C values using the equation Δ13C = (δa − δp)/(1 + δp), where δa is the δ13C of atmospheric CO2 and δp is the δ13C of phloem sap dry matter. The δ13C of atmospheric CO2 was assumed to be −7.8‰. The δ18O values were converted to Δ18O values using the equation Δ18O = (δo − δs)/(1 + δs), where δo is the δ18O of phloem sap dry matter and δs is the δ18O of source water. Xylem sap water δ18O was measured in the Mount Barker plantation on two previous occasions in November 2000 and March 2001, and in the wetter Denmark plantation on one previous occasion in December 2001 (L. Cernusak, unpublished data). Xylem sap water δ18O values did not differ between sampling dates at the Mount Barker plantation (P = 0.09, n = 11) or between the Mount Barker plantation and the Denmark plantation (P = 0.65, n = 41). Therefore, a mean source water δ18O value of −3.6‰ was used in all calculations of Δ18O.
After analyzing the oxygen isotope composition of the phloem sap dry matter, we discovered from a separate set of analyses that the measured δ18O of phloem sap sugars varies depending on whether the tin sample cup is sealed under argon immediately upon removal from the drying oven, or whether it is folded so that it does not form a gas-tight seal. We presume that the difference is caused by adsorption of water vapor from the atmosphere onto the surface of the dried sugars when the sample is not enclosed in a gas-tight cup. Of the phloem sap samples originally analyzed in this study, 18 had sufficient sample remaining for an additional analysis. We re-analyzed these samples in tin cups sealed under argon immediately upon removal from the drying oven. The resulting δ18O values were enriched by 5.5‰ on average compared to the first set of analyses; however, the two data sets were very well correlated (r = 0.98, P < 0.0001, n = 18). Therefore, we corrected the first set of analyses for the effect of not enclosing the dried sugar samples under a gas-tight seal using the results from the subset of samples that we were able to re-analyze. The regression equation used in the calculations was Δ18Osealed = 1.19δ18Ounsealed−0.89, where δ18Osealed is the calculated value for the sealed-cup analysis and δ18Ounsealed is the value from the initial unsealed-cup analysis.
We produced theoretical estimates of phloem sap sugar Δ18O to determine if a change in stomatal conductance alone could account for the range of variation in δ18O values observed in the study. The difference between leaf and air temperatures (ΔT) was predicted using a method developed by D.G.G. dePury and G.D. Farquhar (unpublished data) and described by Barbour et al. (2000a):
 |
5 |
where r*bH is the sum of resistances to sensible and radiative heat transfer, Q0 is the isothermal net radiation at the leaf surface, rs is the stomatal resistance to water vapor, rb is the boundary layer resistance to water vapor, L is the latent heat of vaporization, D is the vapor concentration deficit of the air, Cp is the specific heat of air at constant pressure, and ε is the proportional change in latent heat content of saturated air for a given change in sensible heat content. Boundary layer resistance was calculated as summarized by Barbour et al. (2000a) using an average leaf surface area of 60 cm2 and wind speed of 6 m s−1. The Q0 was estimated as described by Barbour et al. (2000a) assuming canopy-averaged PAR to equal 1,000 μmol m−2 s−1. For Equation 2, average air temperature and relative humidity values were assumed to be 20°C and 55%, respectively, based on data recorded in Table II. The Δ18Ov was assumed equal to −ε*, which produced a δ18O estimate for atmospheric water vapor of −13.2‰. For comparison, the average vapor δ18O in Perth, Western Australia (approximately 400 km from the study site), based on weekly measurements over a 1.5-year period from 1996 to 1998, was −12.3‰ with an sd of 1.6‰ (J. Rich, unpublished data). An error of one such sd in our vapor δ18O estimate would lead to a difference of approximately 0.7‰ in predicted Δ18O of phloem sap sugars, whereas a variation of two standard deviations would lead to a difference of approximately 1.5‰. The scaled effective path length for Equation 3 was assumed to be 30 mm. This estimate was based on previous measurements in E. globulus of the discrepancy between predicted Δ18Oe and observed leaf water enrichment in the steady state (L. Cernusak, unpublished data). The transpiration rate (E) for Equation 3 was estimated according to D.G.G. dePury and G.D. Farquhar (unpublished data):
 |
6 |
Relationships among measured parameters were assessed using Pearson correlation and least squares regression analyses. Statistical analyses were performed in SYSTAT 9.0 (SPSS Inc, Chicago).
ACKNOWLEDGMENTS
We thank Hilary Stuart-Williams and Sue Wood for assistance with isotopic analyses and Wayne Burton of Great Southern Plantations Limited for allowing us access to the E. globulus plantations in which the study was conducted.
Footnotes
Article, publication date, and citation information can be found at www.plantphysiol.org/cgi/doi/10.1104/pp.102.016303.
LITERATURE CITED
- Barbour MM, Cernusak LA, Farquhar GD. Factors affecting the oxygen isotope ratio of plant organic material. In: Flanagan LB, Ehleringer JR, editors. Stable Isotopes in Biosphere-Atmosphere Interactions. San Diego: Academic Press; 2003. pp. xxx–xxx. [Google Scholar]
- Barbour MM, Farquhar GD. Relative humidity- and ABA-induced variation in carbon and oxygen isotope ratios of cotton leaves. Plant Cell Environ. 2000;23:473–485. [Google Scholar]
- Barbour MM, Fischer RA, Sayre KD, Farquhar GD. Oxygen isotope ratio of leaf and grain material correlates with stomatal conductance and grain yield in irrigated wheat. Aust J Plant Physiol. 2000a;27:625–637. [Google Scholar]
- Barbour MM, Schurr U, Henry BK, Wong S-C, Farquhar GD. Variation in the oxygen isotope ratio of phloem sap sucrose from castor bean: evidence in support of the Péclet effect. Plant Physiol. 2000b;123:671–679. doi: 10.1104/pp.123.2.671. [DOI] [PMC free article] [PubMed] [Google Scholar]
- Brugnoli E, Farquhar GD. Photosynthetic fractionation of carbon isotopes. In: Leegood RC, Sharkey TC, von Caemmerer S, editors. Photosynthesis: Physiology and Metabolism. Dordrecht, The Netherlands: Kluwer Academic Publishers; 2000. pp. 399–434. [Google Scholar]
- Brugnoli E, Hubick KT, von Caemmerer S, Wong SC, Farquhar GD. Correlation between the carbon isotope discrimination in leaf starch and sugars of C3 plants and the ratio of intercellular and atmospheric partial pressures of carbon dioxide. Plant Physiol. 1988;88:1418–1424. doi: 10.1104/pp.88.4.1418. [DOI] [PMC free article] [PubMed] [Google Scholar]
- Cernusak LA, Pate JS, Farquhar GD. Diurnal variation in the stable isotope composition of water and dry matter in fruiting Lupinus angustifolius under field conditions. Plant Cell Environ. 2002;25:893–907. [Google Scholar]
- Christy AL, Ferrier JM. A mathematical treatment of Münch's pressure-flow hypothesis of phloem translocation. Plant Physiol. 1973;52:531–538. doi: 10.1104/pp.52.6.531. [DOI] [PMC free article] [PubMed] [Google Scholar]
- Craig H, Gordon LI. Deuterium and oxygen-18 variations in the ocean and the marine atmosphere. In: Tongiorgi E, editor. Proceedings of a Conference on Stable Isotopes in Oceanographic Studies and Palaeotemperatures. Pisa, Italy: Lischi and Figli; 1965. pp. 9–130. [Google Scholar]
- Damesin C, Rambal S, Joffre R. Seasonal and annual changes in leaf δ13C in two co-occurring Mediterranean oaks: relations to leaf growth and drought progression. Funct Ecol. 1998;12:778–785. [Google Scholar]
- Daudet FA, Lacointe A, Gaudillère JP, Cruiziat P. Generalized Münch coupling between sugar and water fluxes for modelling carbon allocation as affected by water status. J Theor Biol. 2002;214:481–498. doi: 10.1006/jtbi.2001.2473. [DOI] [PubMed] [Google Scholar]
- Dongmann G, Nurnberg HW, Förstel H, Wagener K. On the enrichment of H218O in the leaves of transpiring plants. Radiat Environ Biophys. 1974;11:41–52. doi: 10.1007/BF01323099. [DOI] [PubMed] [Google Scholar]
- Ehleringer JR. Gas-exchange implications of isotopic variation in arid-land plants. In: Griffiths H, Smith J, editors. Plant Responses to Water Deficit. London: BIOS Scientific Publishers; 1993. pp. 265–284. [Google Scholar]
- Farquhar GD, Barbour MM, Henry BK. Interpretation of oxygen isotope composition of leaf material. In: Griffiths H, editor. Stable Isotopes: Integration of Biological, Ecological, and Geochemical Processes. Oxford: BIOS Scientific Publishers Ltd.; 1998. pp. 27–48. [Google Scholar]
- Farquhar GD, Ehleringer JR, Hubick KT. Carbon isotope discrimination and photosynthesis. Annu Rev Plant Physiol Plant Mol Biol. 1989a;40:503–537. [Google Scholar]
- Farquhar GD, Gan KS (2003) On the progressive enrichment of the oxygen isotopic composition of water along a leaf. Plant Cell Environ (in press) [PubMed]
- Farquhar GD, Henry BK, Styles JM. A rapid on-line technique for determination of oxygen isotope composition of nitrogen-containing organic matter and water. Rapid Commun Mass Spectrom. 1997;11:1554–1560. [Google Scholar]
- Farquhar GD, Hubick KT, Condon AG, Richards RA. Carbon isotope discrimination and water-use efficiency. In: Rundel PW, Ehleinger JR, Nagy KA, editors. Stable Isotopes in Ecological Research. New York: Springer-Verlag; 1989b. pp. 21–46. [Google Scholar]
- Farquhar GD, Lloyd J. Carbon and oxygen isotope effects in the exchange of carbon dioxide between terrestrial plants and the atmosphere. In: Ehleringer JR, Hall AE, Farquhar GD, editors. Stable Isotopes and Plant Carbon-Water Relations. San Diego: Academic Press; 1993. pp. 47–70. [Google Scholar]
- Farquhar GD, O'Leary MH, Berry JA. On the relationship between carbon isotope discrimination and the intercellular carbon dioxide concentration in leaves. Aust J Plant Physiol. 1982;9:121–137. [Google Scholar]
- Fisher DB, Cash-Clark CE. Gradients in water potential and turgor pressure along the translocation pathway during grain filling in normally watered and water-stressed wheat plants. Plant Physiol. 2000;123:139–147. doi: 10.1104/pp.123.1.139. [DOI] [PMC free article] [PubMed] [Google Scholar]
- Gessler A, Schrempp S, Matzarakis A, Mayer H, Rennenberg H, Adams MA. Radiation modifies the effect of water availability on the carbon isotope composition of beach (Fagus sylvatica) New Phytol. 2001;150:653–664. [Google Scholar]
- Goeschl JD, Magnuson CE, DeMichele DW, Sharpe PJH. Concentration-dependent unloading as a necessary assumption for a closed form mathematical model of osmotically driven pressure flow in phloem. Plant Physiol. 1976;58:556–562. doi: 10.1104/pp.58.4.556. [DOI] [PMC free article] [PubMed] [Google Scholar]
- Hall SM, Milburn JA. Phloem transport in Ricinus: its dependence on the water balance of the tissues. Planta. 1973;109:1–10. doi: 10.1007/BF00385448. [DOI] [PubMed] [Google Scholar]
- Lang A, Thorpe MR. Water potential, translocation and assimilate partitioning. J Exp Bot. 1986;37:495–503. [Google Scholar]
- Leaney F, Osmond C, Allison G, Ziegler H. Hydrogen-isotope composition of leaf water in C3 and C4 plants: its relationship to the hydrogen-isotope composition of dry matter. Planta. 1985;164:215–220. doi: 10.1007/BF00396084. [DOI] [PubMed] [Google Scholar]
- Milburn JA. Phloem exudation from castor bean: induction by massage. Planta. 1970;95:272–276. doi: 10.1007/BF00385093. [DOI] [PubMed] [Google Scholar]
- Milburn JA. The measurement of turgor pressure in sieve tubes. Ber Deutsch Bot Ges. 1980;93:153–166. [Google Scholar]
- Münch E. Die Stoffbewegungen in der Pflanze. Jena, Germany: Fisher; 1930. [Google Scholar]
- Nobel PS. Physicochemical and Environmental Plant Physiology. Ed 2. San Diego: Academic Press; 1991. [Google Scholar]
- Pate J, Arthur D. δ13C analysis of phloem sap carbon: novel means of evaluating seasonal water stress and interpreting carbon isotope signatures of foliage and trunk wood of Eucalyptus globulus. Oecologia. 1998;117:301–311. doi: 10.1007/s004420050663. [DOI] [PubMed] [Google Scholar]
- Pate J, Shedley E, Arthur D, Adams M. Spatial and temporal variations in phloem sap composition of plantation-grown Eucalyptus globulus. Oecologia. 1998;117:312–322. doi: 10.1007/s004420050664. [DOI] [PubMed] [Google Scholar]
- Pate JS, Arthur DJ. Uptake, partitioning and utilization of carbon and nitrogen in the phloem bleeding tree, Tasmanian blue gum (Eucalyptus globulus) Aust J Plant Physiol. 2000;27:869–884. [Google Scholar]
- Pate JS, Sharkey PJ, Lewis OAM. Phloem bleeding from legume fruits: a technique for study of fruit nutrition. Planta. 1974;120:229–243. doi: 10.1007/BF00390291. [DOI] [PubMed] [Google Scholar]
- Pritchard J. Aphid stylectomy reveals an osmotic step between sieve tube and cortical cells in barley roots. J Exp Bot. 1996;47:1519–1524. [Google Scholar]
- Scholander PF, Hammel HT, Bradstreet ED, Hemmingsen EA. Sap pressure in vascular plants. Science. 1965;148:339–345. doi: 10.1126/science.148.3668.339. [DOI] [PubMed] [Google Scholar]
- Sheehey JE, Mitchell PL, Durand J-L, Gastal F, Woodward FI. Calculation of translocation coefficients from phloem anatomy for use in crop models. Ann Bot. 1995;76:263–269. [Google Scholar]
- Smith JAC, Milburn JA. Phloem turgor and the regulation of sucrose loading in Ricinus communis L. Planta. 1980;148:42–48. doi: 10.1007/BF00385440. [DOI] [PubMed] [Google Scholar]
- Smith KC, Magnuson CE, Goeschl JD, DeMichele DW. A time-integrated mathematical expression of the Münch hypothesis of phloem transport. J Theor Biol. 1980;86:493–505. [Google Scholar]
- Sternberg L, DeNiro M. Biogeochemical implications of the isotopic equilibrium fractionation factor between the oxygen atoms of acetone and water. Geochim Cosmochim Acta. 1983;47:2271–2274. [Google Scholar]
- Sternberg L, DeNiro M, Savidge R. Oxygen isotope exchange between metabolites and water during biochemical reactions leading to cellulose synthesis. Plant Physiol. 1986;82:423–427. doi: 10.1104/pp.82.2.423. [DOI] [PMC free article] [PubMed] [Google Scholar]
- Tyree MT, Christy AL, Ferrier JM. A simpler iterative steady state solution of Münch pressure flow systems applied to long and short translocation paths. Plant Physiol. 1974;54:589–600. doi: 10.1104/pp.54.4.589. [DOI] [PMC free article] [PubMed] [Google Scholar]
- Warren CR, McGrath JF, Adams MA. Water availability and carbon isotope discrimination in conifers. Oecologia. 2001;127:476–486. doi: 10.1007/s004420000609. [DOI] [PubMed] [Google Scholar]
- Weast RC, Lide DR, editors. CRC Handbook of Chemistry and Physics. Ed 70. Boca Raton, FL: CRC Press; 1989. [Google Scholar]
- Yakir D. Water compartmentation in plant tissue: isotopic evidence. In: Somero GN, Osmond CB, Bolis L, editors. Water and Life. Berlin: Springer-Verlag; 1992. pp. 205–221. [Google Scholar]
- Yakir D, DeNiro M, Gat J. Natural deuterium and oxygen-18 enrichment in leaf water of cotton plants grown under wet an dry conditions: evidence for water compartmentation and its dynamics. Plant Cell Environ. 1990;13:49–56. [Google Scholar]
- Yakir D, DeNiro MJ, Rundel PW. Isotopic inhomogeneity of leaf water: evidence and implications for the use of isotopic signals transduced by plants. Geochim Cosmochim Acta. 1989;53:2769–2773. [Google Scholar]
- Zimmerman MH. Transport in the phloem. Annu Rev Plant Physiol. 1960;11:167–190. [Google Scholar]