Abstract
Thaxtomin A is a phytotoxin produced by Streptomyces scabies and other Streptomyces species, the causative agents of common scab disease in potato and other taproot crops. At nanomolar concentrations, thaxtomin causes dramatic cell swelling, reduced seedling growth, and inhibition of cellulose synthesis in Arabidopsis. We identified a mutant of Arabidopsis, designated txr1, that exhibits increased resistance to thaxtomin as a result of a decrease in the rate of toxin uptake. The TXR1 gene was identified by map-based cloning and found to encode a novel, small protein with no apparent motifs or organelle-targeting signals. The protein, which has homologs in all fully sequenced eukaryotic genomes, is expressed in all tissues and during all developmental stages analyzed. Microarray transcript profiling of some 14,300 genes revealed two stomatin-like genes that were expressed differentially in the txr1 mutant and the wild type. We propose that TXR1 is a regulator of a transport mechanism.
INTRODUCTION
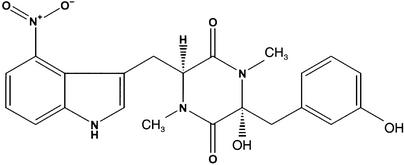
Thaxtomin A (Figure 1) is a phytotoxin produced by several species of the gram-positive filamentous bacteria in the genus Streptomyces (including S. scabies, S. acidiscabies, and S. turgidiscabies) that cause scab disease in potato and in several taproot crops such as radish and turnip (King et al., 1989, 1991; Lawrence et al., 1990; Loria et al., 1995, 1997; Miyajima et al., 1998). Potato scab is a disease of major economic importance in most potato-producing areas of the world (Lambert and Loria, 1989). The genes that encode the thaxtomin biosynthetic pathway appear to lie on a pathogenicity island that was transmitted to Streptomyces species, resulting in the emergence of new pathogenic species in agricultural production systems (Healy et al., 1999, 2000; Bukhalid et al., 2002). The pathogenicity of various S. scabies isolates is correlated with their ability to produce thaxtomin A (King et al., 1991; Loria et al., 1995; Goyer et al., 1998; Kinkel et al., 1998). Mutant S. scabies strains that are avirulent or have reduced virulence exhibit decreased or undetectable levels of thaxtomin A relative to the parent strain (Healy et al., 1997; Goyer et al., 1998). Targeted gene disruption of the thaxtomin synthase genes provided definitive evidence that thaxtomin production is required for the infection of intact host tuber tissue by S. acidiscabies (Healy et al., 2000).
Figure 1.
Structure of Thaxtomin A.
Purified thaxtomins elicit symptoms in host tissue identical to those caused by infection with a virulent form of the pathogen (King et al., 1989, 1992; Lawrence et al., 1990). Phytotoxic activity has been observed in a wide variety of seedlings of both monocotyledonous and dicotyledonous plant species, including Arabidopsis (Leiner et al., 1996; King et al., 2001). These phytotoxins, which cause plant cell necrosis, are active already at nanomolar concentrations similar to those observed with commercial herbicides. Postemergence symptoms include stunting, meristematic effects, and root tip puffing.
Thaxtomin A is the most prominent member of a series of at least 11 unique 4-nitroindol-3-yl–containing 2,5-dioxopiperazines produced by S. scabies and S. acidiscabies (King et al., 1989; Lawrence et al., 1990; King and Lawrence, 1996). Thaxtomin A is synthesized by two peptide synthase genes (txtA and txtB) that were cloned recently (Healy et al., 2000). Studies of the activity of the various thaxtomins and derivatives indicate that the phenyl portion of the Phe and the nitro group in the indole ring of Trp are necessary structural requirements for phytotoxicity (King et al., 1992).
The mode of action of thaxtomin is not known (Loria et al., 1997). However, it has been noted (King et al., 2001) that the symptoms are similar to those caused by known cellulose biosynthesis inhibitors such as dichlobenil and isoxaben (Delmer and Amor, 1995; Scheible et al., 2001). Onion root tip cells treated with thaxtomin A concentrations at or below levels that inhibit onion root growth were binucleate or had abnormal cell plates (Fry and Loria, 2002). Thaxtomin A also inhibited normal cell elongation of tobacco protoplasts in a manner that suggested an effect on primary cell wall development.
To investigate the mode of action of thaxtomin A, we have characterized a novel mutant of Arabidopsis that exhibits increased tolerance to thaxtomin A. The gene corresponding to this mutation, TXR1, was identified by map-based cloning and found to encode a novel protein with homologs in all fully sequenced eukaryotes. Comparison of the rate of thaxtomin uptake by the wild type and the txr1 mutant indicates that the TXR1 protein regulates or participates in the transport of thaxtomin into plant cells.
RESULTS
Effects of Thaxtomin on Arabidopsis Seedling Growth
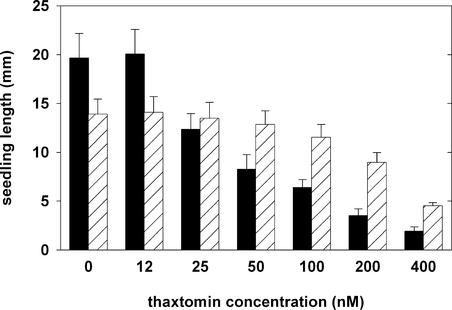
Thaxtomin A has been reported to have a 50% inhibition value (I50 value) of ∼10 ppb in Arabidopsis (King et al., 2001). We independently established the I50 value for Arabidopsis under our growth conditions by growing seedlings on agar-solidified mineral medium containing a range of thaxtomin concentrations (Figure 2; see also supplemental data online). The length of wild-type seedlings was reduced by 50% at concentrations of 25 to 50 nM (Figure 2). Cotyledons were more sensitive to thaxtomin, indicated by a reduction in growth of >50% at 12 nM (see supplemental data online). Starting at 25 nM, wild-type hypocotyls displayed radial swelling, and at concentrations of 50 nM and higher, wild-type seedlings lost their ability to develop green cotyledons and true leaves (see supplemental data online). At concentrations of 800 nM and above, wild-type seedlings stopped growth upon germination (see supplemental data online).
Figure 2.
Seedling Length as a Measure of Growth of the Wild Type and the txr1 Mutant (Line BF1) in the Presence of Various Concentrations of Thaxtomin.
Each bar represents the mean ± sd of the lengths (measured from the apical meristem to the root tip) of 30 seedlings. Seedlings were grown in Percival chambers on vertical agar plates for 5 days. Wild-type data are shown with black bars, and mutant data are shown with cross-hatched bars.
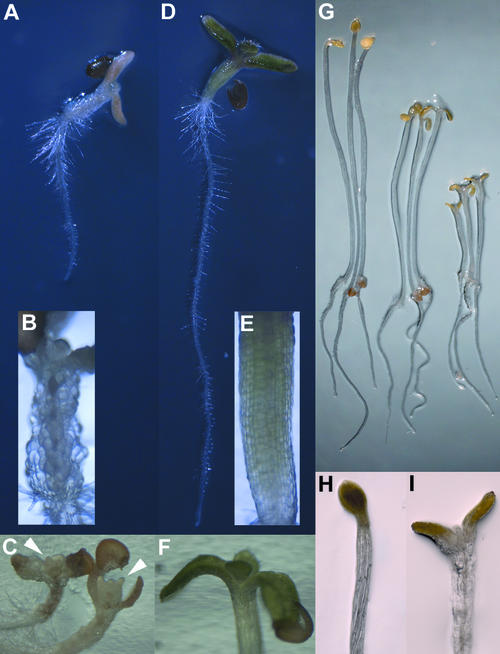
The effects of thaxtomin on wild-type seedlings germinated and grown on medium containing 100 nM thaxtomin are shown in Figures 3A to 3C. Thaxtomin caused drastic swelling (isotropic expansion) of hypocotyl cells (Figure 3B). Root growth was reduced by >50% in wild-type seedlings treated with 100 nM thaxtomin (Figure 3A; cf. Figure 2); however, unlike hypocotyl cells, root cells did not swell isotropically. At 6 days after germination, when untreated wild-type seedlings established the first pair of true leaves (see supplemental data online), wild-type seedlings treated with 100 nM thaxtomin also had dramatically swollen cotyledon cells and shoot apices, resulting in severely disturbed organ formation (Figure 3C). When grown in the dark on vertical agar plates, the elongation of wild-type hypocotyls was reduced markedly by nanomolar concentrations of thaxtomin (Figure 3G), and in the upper part of the hypocotyl, cells swelled noticeably (Figures 3H and 3I). Root growth was largely unaffected under these conditions (Figure 3G).
Figure 3.
Phenotypes of the Wild Type and the txr1 Mutant (Line BF1) Grown in the Presence of Thaxtomin.
(A) to (F) Phenotypes of wild-type and txr1 mutant seedlings after growth on 100 nM thaxtomin for 6 days.
(A) and (D) Aspects of a wild-type seedling (A) and a txr1 mutant seedling (D).
(B) and (E) Bright-field magnification of a wild-type hypocotyl with drastically swollen, unordered cells (B) and a txr1 mutant hypocotyl with normal, straight cell files (E).
(C) and (F) Aspects of shoot apices in the wild type (C) and the txr1 mutant (F). Wild-type shoot apices display drastic cell swelling and severely disturbed organ formation, whereas the shoot apex of txr1 develops normally. Arrowheads in (C) indicate the location where true leaves normally would emerge.
(G) to (I) Phenotypes of dark-grown, 5-day-old wild-type seedlings.
(G) Thaxtomin concentrations of 50 nM (middle) and 100 nM (right) clearly inhibit hypocotyl elongation compared with seedlings that grew in the absence of the phytotoxin (left). Root elongation is unaffected under these conditions.
(H) Etiolated seedlings grown in the absence of thaxtomin have slim hypocotyls and closed cotyledons.
(I) Etiolated seedlings grown with 100 nM thaxtomin show swelling symptoms in the upper part of the hypocotyls and the petioles of the cotyledons, forcing the cotyledons to open.
The toxin per se did not appear to kill cells, because seedlings exposed to toxin resumed growth if transferred to medium lacking toxin. However, the swollen cells resulting from the exposure did not regain normal appearance (data not shown).
Thaxtomin Is a Cellulose Synthesis Inhibitor
As observed previously (King et al., 2001; Fry and Loria, 2002), the symptoms caused by thaxtomin in plants are similar to those caused by cellulose biosynthesis inhibitors such as dichlobenil and isoxaben. To determine whether thaxtomin has an effect on cell wall synthesis and, in particular, cellulose synthesis, we measured the incorporation of 14C-glucose into the nitric/acetic acid–soluble and –insoluble cell wall fractions of etiolated, actively growing 4-day-old wild-type seedlings in the absence and presence of thaxtomin. The acid-insoluble fraction generally is considered to be almost pure, crystalline cellulose (Fagard et al., 2000; Peng et al., 2000), whereas the acid-soluble fraction is composed of hemicellulosic polysaccharides, noncrystalline β-(1,4) glucans, and pectins.
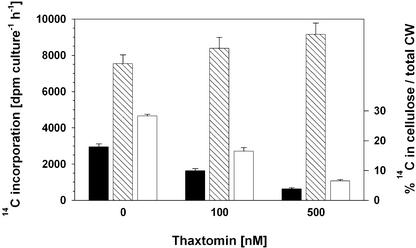
Figure 4 shows that in the absence of thaxtomin, ∼28% of the label in the cell wall was incorporated into the cellulosic fraction. Preincubation with 100 or 500 nM thaxtomin for 24 h reduced this proportion to ∼16 or ∼6%, respectively. The strong reduction in the amount of radioactivity incorporated into the cellulosic fraction was accompanied by an expected reduction of seedling growth during thaxtomin preincubation and by a comparable increase in the amount of label in the acid-soluble fraction, showing that thaxtomin did not inhibit the uptake of 14C-glucose or the incorporation of 14C-glucose into cell wall material per se (Figure 4).
Figure 4.
Thaxtomin Inhibits 14C-Glucose Incorporation into the Cellulosic Cell Wall Fraction of Dark-Grown Wild-Type Seedlings.
A total of 250 4-day-old etiolated seedlings grown in liquid culture were preincubated for 24 h in the presence of 0, 100, or 500 nM thaxtomin and then used for 14C-glucose incorporation assays. Black and cross-hatched bars represent the amount of label incorporated in the acid-insoluble (cellulosic) cell wall (CW) fraction and the acid-soluble cell wall fraction, respectively. White bars indicate the percentage of label in the cellulose fraction relative to the amount of total label in the cell wall (right ordinate). Each bar shows the mean ± se of six independent measurements. Seedling fresh weights in the liquid cultures after preincubation were 170 ± 15 mg, 142 ± 9 mg, and 108 ± 6 mg (mean ± se; n = 6) in the absence of thaxtomin, the presence of 100 nM thaxtomin, or the presence of 500 nM thaxtomin, respectively.
We obtained additional evidence showing that thaxtomin inhibits cellulose biosynthesis using Fourier transform infrared (FTIR) microspectroscopy on thaxtomin-treated (50 to 200 nM), etiolated wild-type hypocotyls followed by hierarchical clustering analysis of the FTIR spectrotypes (Mouille et al., 2003). We observed very tight clustering of these spectrotypes with those of wild-type hypocotyls treated with known cellulose biosynthesis inhibitors (e.g., 2 to 4 nM isoxaben and 1 to 5 μM dichlobenil) and those of mutants (e.g., rsw1-2 and kor-2) known to be defective specifically in cellulose synthesis (G. Mouille, W.-R. Scheible, and H. Höfte, unpublished results; http://www.biocel.versailles.inra.fr/herman/fig1herman.html).
Isolation of Thaxtomin-Resistant Mutants
Mutants resistant to thaxtomin were selected by plating seeds from an ethyl methanesulfonate–mutagenized population of the Columbia (Col-0) ecotype on agar medium containing 100 nM thaxtomin. After 6 days of incubation in continuous light, resistant seedlings were transferred to potting medium and grown to maturity. Sixteen mutant lines were recovered and found to fall into four complementation groups. One group consisted of a single line, BF1, which exhibited the highest level of resistance to thaxtomin. The I50 value for root growth of BF1 was between 200 and 400 nM, a value approximately 10-fold higher than the corresponding value for the wild type (Figure 2). None of the symptoms caused by the toxin in the wild type were observed for BF1 in the presence of thaxtomin concentrations up to 200 nM (Figures 3D to 3F; see also supplemental data online). When mutant seedlings were transferred to inhibitory concentrations of thaxtomin, the syndrome of effects was indistinguishable from that of wild-type seedlings grown at concentrations that gave a similar level of growth inhibition. Thus, whatever the mechanism of resistance, it does not appear to alter the primary mode of action of the toxin.
To test the pattern of inheritance of the resistance mutation, line BF1 was crossed reciprocally with the wild-type. The F1 progeny exhibited the same level of sensitivity to the toxin as the wild-type progeny (data not shown). Resistance and sensitivity segregated 1:3 in the F2 progeny, indicating that resistance was caused by a single recessive mutation at a nuclear locus that we have designated txr1.
Characterization of the TXR1 Gene
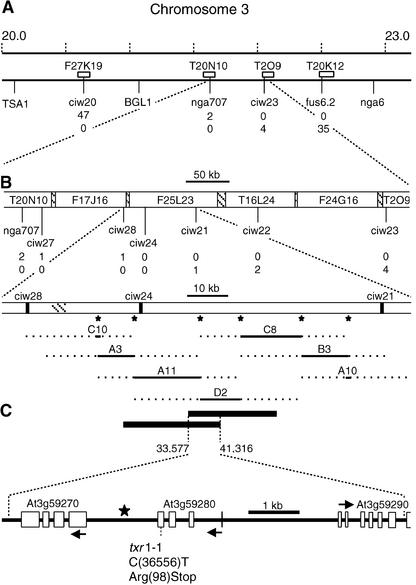
To obtain a high-resolution map position for the txr1 locus, 96 thaxtomin-resistant plants were selected from the F2 progeny of a cross of the txr1 mutant and the Landsberg erecta ecotype, and a mixed DNA sample from these thaxtomin-resistant F2 plants was prepared and scored with a series of codominant PCR-based markers (Lukowitz et al., 2000). This bulked segregant analysis placed the txr1 mutation on chromosome 3 between cleaved amplified polymorphic sequence marker TSA1 and simple sequence length polymorphism (SSLP) marker nga6 (Figure 5A). Individual DNA samples from 1152 homozygous mutant plants from the segregating F2 mapping population were scored subsequently for recombination events between markers ciw20 and fus6.2, resulting in the identification of 47 lines with a recombination event between ciw20 and txr1 and 35 lines with a recombination event between txr1 and fus6.2. By analyzing seven additional SSLP markers, the genomic interval containing the TXR1 locus was narrowed to an 83.4-kb genomic fragment between markers ciw21 and ciw28 (Figure 5B).
Figure 5.
Identification of TXR1 by Recombinational Mapping and Cosmid Complementation.
(A) Representation of the bottom part of Arabidopsis chromosome 3 showing a megabase scale, the positions of cleaved amplified polymorphic sequence markers TSA1 and BGL1, and the positions of SSLP markers nga6, nga707, ciw20, ciw23, and fus6.2. AGI BAC clones containing the SSLP markers used for fine mapping are represented by white boxes. The number of recombination events (meiotic breakpoints) found for each marker in 2304 chromosomes examined is given.
(B) Close-up of the region between flanking SSLP markers nga707 and ciw23 showing the names, the nonoverlapping parts (open boxes) and overlapping parts (cross-hatched boxes) of BAC clones, and the positions and numbers of recombinant events found for five additional ciw SSLP markers. The enlarged view of the region between ciw28 and ciw21 depicts the positions of probes (asterisks) used for cosmid library screening and the positions of seven cosmid clones covering the 83.4-kb interval. Dotted lines indicate the regions in which the cosmid clones end. The exact positions and sizes, as well as the 7.7-kb overlap of the two txr1 complementing cosmids, A11 and D2, on BAC clone F25L23 are shown below.
(C) Representation of the predicted genes within the 7.7-kb segment. The point mutation in the txr1-1 allele and the introduced stop codon are shown. Arrows indicate the direction of gene transcription and are positioned at the translational start codons.
A set of seven cosmid clones covering the entire 83.4-kb interval (Figure 5B) was identified from a genomic Col-0 cosmid library constructed in the binary vector pBIC20 (Meyer et al., 1994) using colony hybridization with six sequence-specific DNA probes (the positions are marked with asterisks in Figure 5B) and multiplex PCR. The seven cosmid clones (named A3, A10, A11, B3, C8, C10, and D2) then were introduced individually into txr1 mutants via Agrobacterium tumefaciens–mediated transformation. Kanamycin-resistant progeny of txr1 mutants transformed with the overlapping cosmid clone A11 or D2 were complemented for the txr1 resistance phenotype and the txr1 growth phenotype, as judged by the occurrence of thaxtomin sensitivity and the wild-type growth aspect in three-fourths or more of the T2 plants (data not shown). By contrast, the progeny of txr1 mutants transformed with cosmid clone A3, A10, B3, C8, or C10 remained fully thaxtomin resistant and retained their mutant growth aspect in the T2 generation, implying that these cosmid clones do not contain the wild-type TXR1 gene and hence cannot complement the txr1 mutation. End sequencing of the Arabidopsis genomic sequence integrated in the complementing cosmid clones A11 and D2 revealed a 7,734-bp overlap between two HindIII restriction sites at positions 33,578 and 41,311 on AGI BAC clone F25L23. This overlapping region must contain the txr1 gene and was annotated as containing open reading frames (ORFs) for At3g59270 and At3g59280 and only a minor part of the ORF for At3g59290.
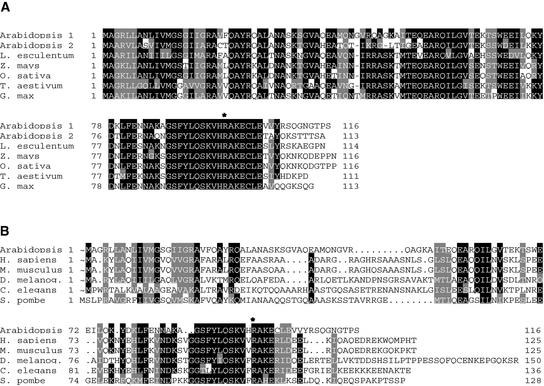
To determine whether the txr1 mutant contained a point mutation in At3g59270 or At3g59280, both ORFs were amplified by PCR and sequenced from the mutant, from Col-0 wild type, and from a txr1 × Col-0 F1 heterozygote. Whereas double-stranded sequencing of At3g59270 (nucleotides 33,628 to 35,464 on BAC clone F25L23, encoding the ORF, a 360-bp upstream sequence, and a 200-bp downstream sequence) yielded no difference between the mutant and the wild type, the sequencing of the region between nucleotides 36,250 and 38,013 on BAC clone F25L23 revealed that At3g59280 contained a single base-pair change (C to T) at nucleotide 36,556 (Figure 5C). In the heterozygous F1 plant, a C/T double peak was observed at this position. Because At3g59280 was the only gene with a point mutation in the overlapping part of the cosmids that produced thaxtomin sensitivity, we concluded that this polymorphism is responsible for thaxtomin resistance and that ORF At3g59280 is the TXR1 gene. The point mutation in txr1 leads to the replacement of an Arg codon at amino acid 98 with a stop codon (Figure 5C). The stop truncates the TXR1 protein in a region that is highly conserved among homologous genes of other plants and of all fully sequenced eukaryotic genomes (Figure 6), resulting in the loss of 19 C-terminal amino acid residues from the polypeptide. Thus, we infer that the txr1-1 allele is a putative null mutation.
Figure 6.
Amino Acid Alignment of TXR1 Homologs.
Black boxes indicate regions in which at least five of seven (A) or five of six (B) residues are identical, and gray boxes indicate conserved residues. The position of the stop codon in TXR1 is marked with an asterisk.
(A) Alignment of a selection of homologs from monocotyledonous and dicotyledonous plants as deduced from EST sequences (tomato [Lycopersicon esculentum], maize [Zea mays], wheat [Triticum aestivum], and soybean [Glycine max]) or genomic sequences (Arabidopsis and rice [Oryza sativa]). TXR1 is designated Arabidopsis 1.
(B) Alignment of TXR1 with eukaryotic sequences from human (Homo sapiens), mouse (Mus musculus), fruit fly (Drosophila melanogaster), worm (Caenorhabditis elegans), and fission yeast (Schizosaccharomyces pombe).
The TXR1 Gene and Its Homologs
The nucleotide sequence of a full-length cDNA clone for the TXR1 gene was deposited in GenBank by P. Shinn, M. Seki, and colleagues at The Salk Institute (La Jolla, CA) and RIKEN Genomic Sciences Center (Yokohama, Japan) as part of a collaborative effort to obtain full-length cDNA clones for all Arabidopsis genes (Seki et al., 2001). The cDNA corresponds to nucleotides 21,787,755 to 21,786,192 of chromosome 3. Comparison of the sequence of the cDNA clone with the genomic sequence of At3g59280 indicates that the genomic clone contains three introns that divide the coding sequence into four exons (Figure 5C).
The TXR1 gene encodes a 116–amino acid, 12.7-kD polypeptide that is predicted to be 80% α-helix and 20% coiled coil. The protein does not contain any unambiguous organelle-targeting signals or motifs that might suggest function or any membrane-spanning domains. The TargetP program (Emanuelsson et al., 2000) assigned a score of 0.63 for mitochondrial localization, which is significantly below the recommended cutoff for reliable prediction. Basic Local Alignment Search Tool (BLAST) searches against GenBank's genomic and EST databases revealed that TXR1 has a homolog (At5g61880) in the Arabidopsis genome as well as homologs in many other plants, including tomato, soybean, maize, rice, and wheat (Figure 6A). Comparison of a full-length cDNA sequence for the Arabidopsis homolog with the genomic sequence, as well as closer inspection of rice chromosome 10 BAC OSJNBa0055P24, which encodes a TXR1 homolog, indicate that these genes were annotated incorrectly because of splice sites in the start codons. Similarity between TXR1 and its homologs in other plants ranges from 73 to 80%, and sequence identity varies between 70 and 74%. No biochemical or biological function has been proposed for any of these genes. All fully sequenced eukaryotic genomes were found to contain ORFs of unknown function with a high degree of sequence identity to TXR1. An alignment of the predicted polypeptides from Arabidopsis, human, mouse, fruit fly, worm, and fission yeast is presented in Figure 6B. The sequence similarity is most significant in the C-terminal half of the TXR1 protein between amino acid residues 53 and 104, where, for example, the sequence identity between Arabidopsis and human was 53% and the similarity was 69%.
txr1 Growth Phenotypes
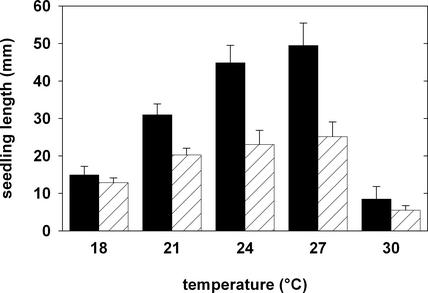
The growth of the txr1 mutant was reduced compared with that of the wild type in all environmental conditions that we examined. Also, supplementing txr1 mutant plants with sucrose or Gln on agar plates did not improve growth (data not shown). When grown on vertical agar plates at 21°C, mutant seedlings were ∼30% shorter (Figures 2 and 7; see also supplemental data online) and had considerably smaller cotyledons (see supplemental data online). The growth retardation became more apparent when plants were grown at temperatures of >21°C (Figure 7; see also supplemental data online). Although wild-type seedlings were able to increase growth by up to 50% between 21 and 27°C, the txr1 mutant showed only a minor increase. By contrast, at 18°C, the seedling length of the mutant was comparable to that of the wild type (Figure 7), although the size of the mutant shoot remained smaller (data not shown). Thus, the TXR1 gene is required for some aspect of normal shoot growth at all temperatures and for normal root growth at increased temperatures.
Figure 7.
Growth of Wild-Type and txr1 Mutant Seedlings in Response to Different Temperatures.
Each bar represents the mean ± sd of the lengths (measured from the apical meristem to the root tip) of 20 seedlings grown in Percival chambers on vertical agar plates for 7 days. Wild-type data are shown with black bars, and mutant data are shown with cross-hatched bars.
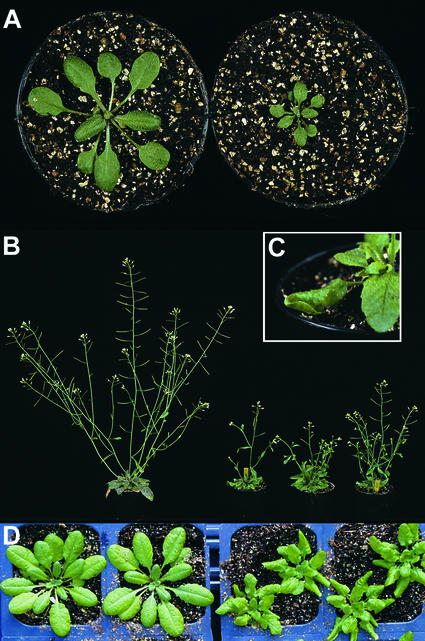
The growth reduction of the txr1 mutant also was present when seedlings were cultivated for 1 week in axenic culture at 20°C in the light (∼30% less biomass accumulation in the mutant compared with the wild type; data not shown) or when plants were grown to maturity on soil under controlled greenhouse conditions (Figures 8A and 8B). In addition to this reduction in growth, the mutant also displayed warped, twisted leaves at the later rosette stage (Figure 8C), and this phenotype was even more pronounced when plants were grown at lower temperatures (Figure 8D). These visible differences were complemented by the same cosmids that suppressed the thaxtomin-resistant phenotype (data not shown).
Figure 8.
Growth Phenotypes of txr1 Mutants during Later Stages of Development.
(A) and (B) Wild-type (left) and txr1 mutant (right) plants grown for 4 weeks (A) or 6 weeks (B) on soil under greenhouse conditions.
(C) Characteristic rosette leaf shape of a 5-week-old txr1 mutant.
(D) Wild-type (left) and txr1 mutant (right) plants grown for 7 weeks on soil in a 12-h-light/12-h-dark cycle at 19/16°C. The leaf phenotype of txr1 mutants became visible after ∼5 weeks under these conditions.
In contrast to the observed growth retardation, the general development of the mutant was not markedly different from that of the wild type. Plants of both genotypes started to develop the first pair of true leaves simultaneously (see supplemental data online), had the same number of leaves at the rosette stage (Figures 8A and 8D), and also started to bolt, flower, and set seed at the same age (Figure 8B).
Although the Arabidopsis txr1-1 mutation resulted in a considerable growth reduction, a large-scale analysis of deletion mutations of Saccharomyces cerevisiae revealed that a deletion of the yeast homolog of TXR1 resulted in inviability (Winzeler et al., 1999). The corresponding record in the SGD database (http://genome-www.stanford.edu/Saccharomyces/) indicated that the gene product was a mitochondrial protein required for respiration, but there was no indication of the basis for this annotation, which appears to be based on a computational rather than an experimental analysis.
Uptake and Metabolism of Thaxtomin by Arabidopsis
Among the potential mechanisms of toxin resistance in the txr1 mutant are defects in uptake of the toxin or altered metabolism of the toxin by the mutant. To test these possibilities, we produced radioactive thaxtomin by growing S. scabies in tritiated Phe, a presumed precursor for thaxtomin biosynthesis. Although no attempt was made to optimize the incorporation of the label, we recovered ∼150 μCi of toxin with a specific activity of >300 μCi/μmol from 40-mL cultures of S. scabies containing 2 mCi of 3H-Phe.
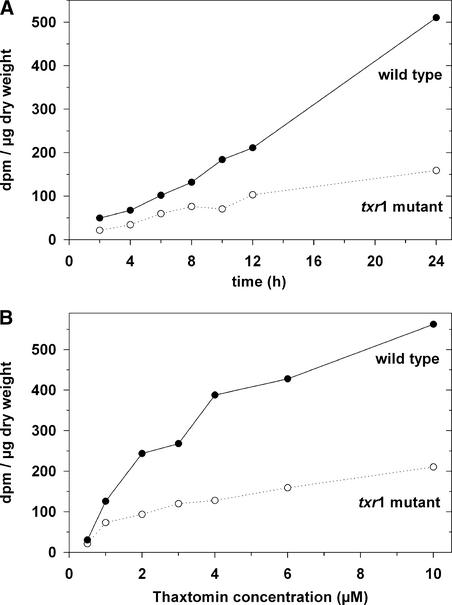
Uptake of labeled toxin was measured by immersing intact seedlings in aqueous solutions of the toxin and then washing the seedlings, extracting the low molecular weight compounds, and measuring radioactivity by scintillation counting of the extracts. Uptake of the toxin by wild-type seedlings immersed in 2 μM toxin was essentially linear for up to 24 h (Figure 9A). Measurements of the effect of toxin concentration on uptake by the wild type showed apparent saturation kinetics, suggesting that the toxin enters by an active uptake mechanism (Figure 9B). Uptake of toxin by the mutant was reduced strongly relative to uptake by the wild type. Thaxtomin concentrations in these experiments had to be kept in the lower micromolar range because of the relatively low specific activity of the 3H-thaxtomin preparation.
Figure 9.
Uptake of 3H-Thaxtomin by Wild-Type and txr1 Mutant Seedlings.
(A) Time-dependent uptake of 3H-thaxtomin by wild-type seedlings (closed symbols) and txr1 mutant seedlings (open symbols) in 2 μM thaxtomin.
(B) Concentration-dependent uptake of 3H-thaxtomin by wild-type seedlings (closed symbols) and txr1 mutant seedlings (open symbols). Seedlings were incubated in toxin for 12 h at the indicated concentrations.
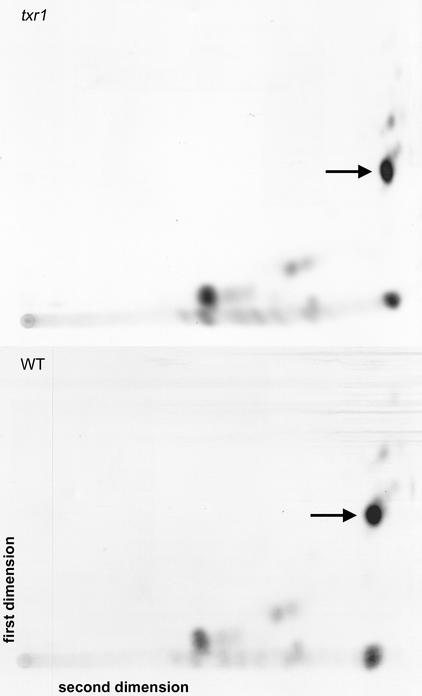
We also examined the possibility that part of the resistance of the txr1 mutant to thaxtomin was caused by altered metabolism of thaxtomin. Seedlings were incubated for 24 h in liquid growth medium containing 3H-labeled thaxtomin. At the end of that time, the seedlings were washed to remove exogenous radioactivity, and the water-soluble small molecules were extracted and separated using two-dimensional thin layer chromatography. The majority of the radioactivity recovered from both the mutant and the wild type was in the form of thaxtomin (Figure 10). The remaining radioactivity was present in several unknown compounds that were present in similar amounts in both the mutant and the wild type. Thus, there was no apparent difference between the mutant and the wild type in the metabolism of the toxin.
Figure 10.
Two-Dimensional Thin Layer Chromatograms of 3H-Thaxtomin–Labeled Extracts from the txr1 Mutant and the Wild Type.
Arrows indicate the positions of thaxtomin A. WT, wild type.
Expression of the TXR1 Gene
To assess where the TXR1 gene is expressed, total RNA from various tissues from plants of different ages was used for total RNA gel blot analysis. However, RNA gel blot detection of TXR1 transcript with a radioactively labeled full-length cDNA probe was unsuccessful even after 10 days of exposure on x-ray films, indicating a low expression level of TXR1 at all stages of growth and development. This finding is supported by the presence of only two TXR1 ESTs among the >178,000 Arabidopsis EST sequences in GenBank (as of April 2003).
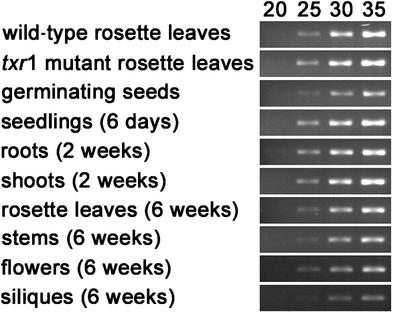
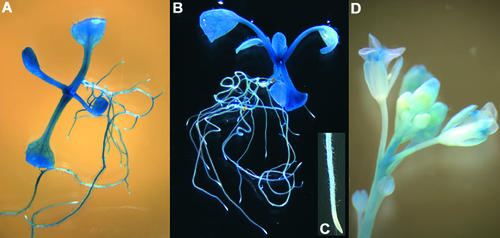
First-strand cDNA was prepared subsequently from total RNA samples by reverse transcription and subjected to PCR. A cDNA-specific 224-bp product was amplified from all analyzed samples and became visible on agarose gels only after ∼25 to 30 PCR cycles (Figure 11). These results indicated that the gene is expressed ubiquitously but weakly. There was no difference in transcript abundance detectable between the wild type and the txr1 mutant (Figure 11), suggesting that the txr1-1 point mutation does not affect transcript stability. Expression of the TXR1 gene also was investigated in transgenic plants that carried a TXR1 promoter–β-glucuronidase (GUS) gene fusion construct (Figure 12). With the exception of the root tips (Figure 12C), GUS activity was observed in all tissues of the transgenic plants and during all developmental stages that we examined (Figures 12A, 12B, and 12D).
Figure 11.
Reverse Transcriptase–Mediated PCR Analysis of TXR1 Expression.
The level of a 224-bp TXR1-specific PCR product was visualized after 20, 25, 30, and 35 PCR cycles using a first-strand cDNA template from 4-week-old wild-type and mutant rosette leaves, 3-day-old germinating wild-type seeds, 6-day-old wild-type seedlings, roots and shoots from 2-week-old wild-type plants grown on vertical agar plates, and rosette leaves, stems, flowers, and green siliques from 6-week-old adult wild-type plants.
Figure 12.
Expression of GUS Activity under the Control of a 1.76-kb TXR1 Promoter Fragment.
Shown are bright-field (A) and dark-field (B) images of GUS staining in 14-day-old vegetative-stage plantlets as well as a representative root tip of a 14-day-old plantlet (C) and an inflorescence stem of an adult 1-month-old plant (D).
Localization of the TXR1 Protein
To investigate the subcellular localization of the TXR1 protein, we constructed N- and C-terminal green fluorescent protein (GFP) fusions expressed under the control of the 35S promoter. These constructs were introduced subsequently into tobacco leaf protoplasts. For both fusions of TXR1 to GFP, the green fluorescence clearly was located in the cytoplasm (Figure 13).
Figure 13.
Localization of TXR1 Fused at the N and C Termini to GFP in Protoplasts.
Green fluorescence of GFP-TXR1 (i.e., GFP is fused to the N terminus of TXR1) (A) and TXR1-GFP (C). (B) and (D) show the chlorophyll fluorescence for the protoplasts shown in (A) and (C), respectively. Both fusion constructs are expressed under the control of the 35S promoter of Cauliflower mosaic virus.
Microarray Analysis of the txr1 Mutant
To further explore the biological role of the TXR1 gene, we used microarray technology to analyze the expression of 14,300 genes. The concept underlying the experiment was that if the TXR1 gene product has a regulatory function, the microarrays might reveal a change in the expression of the regulated genes. RNA was isolated from mutant and wild-type plants growing in identical conditions and used to probe arrays in duplicate (Wu et al., 2001). The total data set from this experiment is available at http://afgc.stanford.edu. Only 51 of the 14,300 genes represented on the microarrays had an average ratio of gene expression (mutant:wild type) that was >2.5 standard deviations from the mean. Thirty-one genes showed increased expression, and 20 genes showed decreased expression. Thus, under normal growth conditions, the mutant and the wild type are extremely similar at the level of gene expression, which is surprising considering the strong phenotype of the mutant. Of the 51 genes that showed an average change in gene expression, more than half of them encoded hypothetical proteins of unknown function (see supplemental data online). Of the 24 genes with similarity to genes of known function, there was no obvious grouping of the genes with respect to function. In only one case were two genes of potentially related function found: these genes for stomatin-like proteins increased approximately twofold in the mutant. Stomatin is an integral plasma membrane protein that has been implicated in the regulation of ion and glucose transport in animal cells (Zhang et al., 2001).
DISCUSSION
The txr1 mutant of Arabidopsis is resistant to levels of thaxtomin A that completely inhibit the growth of the wild type. In the mutant, resistance to the toxin is attributable to a mutation in a gene that encodes a small protein of unknown function. The txr1-1 mutation gives rise to a stop codon that truncates the translation of the protein within a highly conserved C-terminal domain. Therefore, it is likely that the txr1-1 mutation is a loss-of-function allele. The TXR1 protein does not contain any known motifs or intracellular targeting sequences. All eukaryotes with fully sequenced genomes contain genes that encode proteins with significant sequence identity to TXR1, suggesting a conserved function. A mutation in the yeast homolog of TXR1 has been identified in a large-scale gene-inactivation program and was reported to cause lethality. The yeast mutant has not been investigated in detail, and the basis for the lethal phenotype is not known. By contrast, the txr1 mutant of Arabidopsis exhibits a reduction in growth, suggesting that either the gene does not encode an essential function or there is a functionally redundant gene (i.e., At5g61880) in the Arabidopsis genome. At higher temperatures (>21°C), the growth of the mutant becomes progressively retarded compared with that of the wild type. This finding suggests a function related to growth at high temperature or that the loss of function caused by the txr1 mutation becomes progressively limiting as the growth rate of the wild type increases with temperature.
Measurements of the uptake of thaxtomin by wild-type seedlings at various concentrations of the toxin indicated that the rate of uptake approaches saturation at the highest levels of the toxin used. This finding suggests that the toxin enters plant cells by a carrier-mediated process. It is possible that thaxtomin is sufficiently similar in structure to a dipeptide substrate for one of the hydrophobic dipeptide transporters of Arabidopsis (Song et al., 1996, 1997). The rate of uptake of thaxtomin by the mutant was reduced strongly relative to that of the wild type. Thus, we infer that the TXR1 gene product is required for the activity of a transporter that carries thaxtomin into plant cells.
N- and C-terminal GFP fusions to TXR1 were localized in the cytoplasm of tobacco leaf protoplasts that expressed the fusions under the transcriptional control of the 35S promoter. This result is consistent with the lack of predicted transmembrane domains in the TXR1 protein and suggests that the protein acts as a cytosolic regulator of a membrane protein rather than being a perpetual component of a transporter complex. Continuing studies will determine whether the GFP fusions correctly reflect the localization of the TXR1 and which proteins TXR1 interacts with.
The reduced uptake of thaxtomin by the mutant provides a likely explanation for the increased resistance of the mutant to growth in the presence of thaxtomin. Likewise, the undetectable GUS activity in root tips of TXR1 promoter–GUS transgenic plants may explain the generally lower thaxtomin sensitivity of root expansion growth compared with hypocotyl or cotyledon expansion growth (Figure 3G). The observation that the mutant is not completely defective in uptake of the toxin may explain why the mutant is only moderately resistant to the toxin. Inactivation of the related gene MAC9.20 (i.e., At5g61880) may be required to fully eliminate thaxtomin uptake in Arabidopsis.
One mechanism by which plants may become resistant to a toxin is enhanced deactivation or reduced activation of the toxin. Bacterial toxins such as tabtoxin, produced by Pseudomonas syringae pv tabaci, are hydrolyzed in plants to a more active constituent, tabtoxinine-β-lactam (Anzai et al., 1989). Conversely, many fungal toxins, such as maculosin, leucinostatin A, zearalenone, deoxynivalenol, and ochratoxin A, are metabolized in plants to less toxic derivatives by oxidation, reduction, hydrolysis, methylation, glucosylation, and the formation of cell wall–bound residues (Park et al., 1994; Strobel and Hess, 1997; Engelhardt et al., 1999). We investigated the possibility that the TXR1 gene was involved in the metabolism of thaxtomin by feeding seedlings radioactive thaxtomin for 24 h and then extracting all labeled compounds and resolving them using thin layer chromatography. By this criterion, there was no detectable difference between the mutant and the wild type in the metabolism of thaxtomin.
The TXR1 gene was expressed at similar levels in all major tissues of the plant, suggesting that the function of the TXR1 gene is relevant to a basic cellular process that is constitutively active in most cell types. Microarrays containing Arabidopsis cDNAs were used to determine whether the txr1 mutation caused any difference in gene expression between the mutant and the wild type under standard growth conditions. Using the criterion that the ratio of gene expression in the mutant and the wild type must vary by more than two standard deviations from the mean ratio for 14,300 genes, the expression of 31 genes was increased in the mutant and the expression of 20 genes was decreased relative to the wild type. The very small number of genes that met this criterion indicates that there are not major changes in gene expression resulting from the mutation and that many of the differences observed may be simply noise. This, in turn, suggests that the TXR1 gene product is not involved directly in transcriptional regulation and that the plant does not appear to respond to the alteration in TXR1 function by altering the transcription of other genes. An exception is that two genes for stomatin-like proteins showed increased expression in the mutant. Because the probability of two structurally related genes showing spurious changes in gene expression is very low, these genes may be of interest in future studies of the role of the TXR1 gene. In animals, stomatin is an integral membrane protein that has been implicated in the regulation of ion channels and a glucose transporter (Zhang et al., 2001). The association of the stomatin-like proteins and the TXR1 protein with transport processes is consistent with the possibility that they participate in a common process.
It has been noted previously that the syndrome of effects of thaxtomin on plants is superficially similar to the effects of herbicides that inhibit cellulose synthase (King et al., 2001). We have obtained three lines of evidence that confirm and extend these observations. First, thaxtomin, like isoxaben or prc1 mutations in the CESA6 gene for cellulose synthase (Fagard et al., 2000; Desprez et al., 2002), inhibits the elongation of dark-grown wild-type hypocotyls (Figure 3G). Second, thaxtomin specifically inhibits the incorporation of 14C-glucose into the cellulosic (i.e., acid-insoluble) cell wall fraction of dark-grown wild-type seedlings (Figure 4). And third, the FTIR spectrotypes of thaxtomin-treated, etiolated wild-type hypocotyls cluster very tightly with those of wild-type hypocotyls treated with known cellulose biosynthesis inhibitors (e.g., isoxaben or dichlobenil) and with those of mutants known to be defective specifically in cellulose synthesis (e.g., rsw1-2 and kor-2).
However, thaxtomin also causes substantial wilting in several species after postemergence applications, a symptom dissimilar to that caused by known cellulose biosynthesis inhibitors (King et al., 2001). This finding indicates an additional herbicidal mode of action or a perturbation of cell wall or cellulose biosynthesis that is different from that caused by known cellulose biosynthesis inhibitors.
The Streptomyces species that generate phthoxazolins (Omura et al., 1990) and epopromycins (Tsuchiya et al., 1997) also have been reported to inhibit cellulose biosynthesis in plants. However, the observation that TXR1-like genes are present in eukaryotes that do not synthesize cellulose makes it unlikely that the TXR1 protein is a component of the cellulose synthase complex.
Potato cultivars vary in their resistance to scab, but very few cultivars are highly resistant. Delserone et al. (1991) showed a positive correlation between the susceptibility of potato cultivars to S. scabies and sensitivity to thaxtomin A. These findings suggest the possibility of different degrees of modification of the phytotoxin by the tuber tissues to yield less bioactive metabolites. Acuna et al. (2001) reported that scab-resistant tubers are able to metabolize thaxtomin A to a glucoside that is sixfold less phytotoxic to potato tuber tissue than thaxtomin A. When challenged with toxin, resistant plants produced a greater amount of a metabolite with chromatographic properties similar to those of thaxtomin A-β-di-O-glucoside. In addition, Acuna et al. (2001) reported approximately twice as much thaxtomin glucosyltransferase activity in extracts of resistant plants than in susceptible plants. They proposed that glucose conjugation is one mechanism of thaxtomin detoxification in potato plants and is related to scab resistance and susceptibility in potato plants.
Because of the high degree of conservation of the TXR1 gene in eukaryotes, it should be simple to identify the corresponding gene(s) from potato and to determine whether genetic resistance to common scab disease is related to the activity of the TXR1 gene. In addition, continuing studies of the TXR1 gene, and other as yet uncharacterized txr mutants of Arabidopsis, may provide novel insights into the mode of action of thaxtomin and the biological function of the TXR1 gene.
METHODS
Plant Materials, Mutant Isolation, and Scoring of Thaxtomin Resistance
Wild-type Arabidopsis thaliana plants were of the Columbia (Col-0) ecotype. Ethyl methanesulfonate–mutagenized Col-0 seeds were purchased from Lehle (Red Rock, TX). Seedlings were germinated and grown in growth chambers (Percival Scientific, Perry, IA) under continuous light (∼90 μmol·m−2·s−1) or in darkness on vertical plates containing 0.7% agar-solidified half-strength Murashige and Skoog (1962) mineral salts (Sigma-Aldrich, St. Louis, MO) supplemented with 1% (w/v) sucrose and 0 to 1600 nM thaxtomin. The growth temperature was 21°C unless stated otherwise. Thaxtomin was added to the medium from a 1.0 mM solution in methanol when the agar medium was still liquid at 50 to 60°C. The addition of 0.16% (v/v) pure methanol to hot medium did not affect growth when seedlings were cultivated on the hardened agar plates. Seedlings were scored visually for inhibition of growth after 4 to 7 days. The txr1 mutant (originally named line BF1) underwent four cycles of backcrossing to the wild type and selection before it was characterized closer or crossed to ecotype Landsberg erecta to produce an F2 mapping population. Plants also were cultivated in a commercial peat-vermiculite-perlite mix in Percival growth chambers at temperatures of ∼19°C (12-h day) and ∼16°C (12-h night) or in a glasshouse under natural light conditions at temperatures of ∼25°C (14-h day) and ∼20°C (10-h night).
Cellulose 14C-Glucose Incorporation Assay
For 14C-glucose incorporation assays, batches of 250 surface-sterilized Arabidopsis wild-type seeds were germinated and grown in plastic containers (Sarstedt, Nümbrecht, Germany) at 21°C in the dark in 5 mL of sterile, liquid growth medium (0.25× Murashige and Skoog [1962] mineral salts containing 0.5% [w/v] glucose and 3 mM Mes, pH 5.8). After 4 days, the medium was exchanged for 5 mL of the same sterile medium but containing either 0.1% methanol or 100 or 500 nM thaxtomin added from 1000× methanolic stock solutions. After 24 h of preincubation with or without thaxtomin, the etiolated seedlings were washed three times with 15 mL of the appropriate glucose-free medium before being resuspended in 3 mL of growth medium containing 1.0 μCi/mL 14C-glucose (DuPont–New England Nuclear, Boston, MA), with a calculated specific activity of ∼80,000 dpm/μmol. The seedlings were incubated for 2 h in the dark at 21°C and then washed and extracted as described by Fagard et al. (2000). The amount of label in the acid-soluble and acid-insoluble, cellulosic cell wall fractions was determined by scintillation counting with a Beckman Coulter LS6500 counter (Beckman, Fullerton, CA) using a 40-fold excess of Beckman Coulter Ready-Safe scintillation fluid. The percentage of label incorporation was expressed as 100× the ratio between the amount of label in the cellulosic fraction and the amount in the acid-soluble plus cellulosic fractions.
Genetic Mapping of the txr1 Locus
Linkage of the TXR1 locus to the bottom of chromosome 3, between cleaved amplified polymorphic sequence marker TSA1 and simple sequence length polymorphism (SSLP) marker nga6, was established by bulked segregant analysis according to Lukowitz et al. (2000). A total of 1152 thaxtomin-tolerant mutant plants were isolated from the txr1 × Landsberg erecta F2 mapping population, and for each plant, a DNA sample was prepared from inflorescence tissue using a quick alkaline-lysis protocol (Lukowitz et al., 2000). SSLP markers used for fine mapping (fus6.2, nga707, ciw20 through ciw24, ciw27, and ciw28) were identified from the genetic maps provided by the Arabidopsis Information Resource (http://www.arabidopsis.org) or designed using the CEREON Genomics database of Col-0/Landsberg polymorphisms. Detailed information for the new markers is available through the Arabidopsis Information Resource. PCR conditions for SSLP markers were 50 mM KCl, 10 mM Tris-HCl, pH 9.0, at 25°C, 0.1% Triton X-100, 200 μM each of dATP, dGTP, dTTP, and dCTP, 10 pmol of each primer, 1.5 to 2.5 mM MgCl2, 1 unit of Taq polymerase (Promega, Madison, WI), and 10 to 50 ng of genomic DNA, to a final volume of 22 μL. The PCR program was as follows: 1 min at 94°C; 40 cycles of 20 s at 94°C, 20 s at 50 to 55°C, and 30 s at 72°C; and 2 min at 72°C. Four percent agarose gels (3:1 HR agarose; Amresco, Solon, OH) were used to resolve SSLP markers for mapping.
Cosmid Isolation and Complementation
Using colony hybridization, according to Roche's DIG application manual (http://www.roche-applied-science.com), with six sequence-specific, digoxigenin-11-dUTP–labeled 253- to 402-bp DNA probes (the positions are marked with asterisks in Figure 5B), 162 clones covering the 83.4-kb TXR1-containing mapping interval were isolated from a genomic Col-0 cosmid library constructed in the binary vector pBIC20 (Meyer et al., 1994). A minimal set of seven clones, covering the entire interval, was identified by multiplex PCR using the same primer pairs that amplified the hybridization probes. Mutant txr1 plants were transformed by Agrobacterium tumefaciens (GV3101) carrying the various cosmid clones according to Clough and Bent (1998), and T1 transformants were selected on half-strength Murashige and Skoog (1962) agar plates containing kanamycin (50 μg/mL). To score for thaxtomin resistance, surface-sterilized T2 progeny of the transgenic T1 plants were germinated on vertical agar plates (see above) supplemented with 100 nM thaxtomin. Thaxtomin resistance was scored after 6 days of incubation.
DNA Sequencing
Genomic DNA was prepared using a cetyl-trimethylammonium bromide-detergent extraction method (Lukowitz et al., 2000) from Col-0 wild-type, txr1 mutant, and heterozygous (from a wild type × txr1 cross) F1 plants. A 1.8-kb fragment containing the entire TXR1 (At3g59280) coding sequence was amplified independently by PCR three times from each genotype using the primers 5′-GCCCATAAATAATACGTGTTGAG-3′ and 5′-GAATCTGAATCAAAAACAGGAAGGATAG-3′ and a mixture of Taq and proofreading Pfu polymerases (Promega). Cycle sequencing of both strands of the PCR products was performed with a set of eight additional primers and Big-Dye dideoxy terminator reaction mix (Applied Biosystems, Foster City, CA), and products were resolved on an ABI310 sequencer. Likewise, a 1.9-kb genomic fragment containing At3g59270 was amplified by PCR with primers 5′-CAAATTACAAGGGCTACAGTTACCAAA-3′ and 5′-CGTTAACATTGTTGAGCTAACCGA-3′ and sequenced with a set of 10 primers.
Sequence Alignments
A number of TXR1 sequence homologs from monocotyledonous and dicotyledonous plants (Arabidopsis thaliana, Lycopersicon esculentum, Zea mays, Triticum aestivum, and Glycine max) and other eukaryotes (Homo sapiens, Mus musculus, Drosophila melanogaster, Caenorhabditis elegans, and Schizosaccharomyces pombe) were identified from GenBank's EST and genomic databases using different BLAST (Basic Local Alignment Search Tool) algorithms (http://www.ncbi.nlm.nih.gov/BLAST/). Multiple sequences alignments were created with the PileUp program of Accelrys Seqweb version 2 (Accelrys, San Diego, CA), processed with Boxshade 3.21 (http://www.ch.embnet.org), and arranged manually into their final layouts.
Reverse Transcriptase–Mediated PCR Analysis
Using TRIzol reagent (Life Technologies, Rockville, MD), total RNA was isolated from (1) germinating wild-type seeds, (2) 6-day-old wild-type seedlings, (3) shoots and roots of 2-week-old wild-type plants grown on vertical agar plates in continuous light at 23°C, (4) rosette leaves of wild-type and txr1 mutant plants grown on soil in 12-h-light/12-h-dark cycles at 19/16°C, and (5) various tissues of 6-week-old flowering wild-type plants grown on soil under greenhouse conditions. For mRNA detection by reverse transcriptase–mediated PCR, 2 μg of total RNA from each tissue was treated with DNase I, precipitated, and reverse-transcribed with Revert-Aid Moloney leukemia virus reverse transcriptase (MBI Fermentas, St. Leon-Rot, Germany) and oligo(dT) primer according to the manufacturer's protocols. PCR amplification of a 224-bp TXR1-specific cDNA fragment was performed using primers 5′-CACTTGCTAATGCGTCTAAATC-3′ and 5′-ACATTCTTTGGCTCGATGAA-3′. DNase I–treated genomic Arabidopsis Col-0 DNA did not yield a PCR product, whereas untreated genomic Arabidopsis DNA served as a template for a 319-bp fragment as a result of a 95-bp intron in the TXR1 gene.
Promoter–β-Glucuronidase and GFP Fusion Constructs
To obtain a TXR1 promoter–β-glucuronidase (GUS) gene fusion construct, a 2508-bp PCR product (containing nucleotides 37,003 to 39,501 of BAC F25L23) was amplified from genomic DNA of Arabidopsis wild-type Col-0 using PfuTurbo polymerase (Stratagene, La Jolla, CA) and primers 5′-ACGGAATTCACATACATGGCACTAGCGTAAGACA-3′ and 5′-CTGCCAGAATCAACAATTACCAAG-3′. An EcoRI-NcoI fragment representing 1.76 kb of TXR1 upstream sequence was fused subsequently to the GUS gene of vector pCAMBIA1301 (CAMBIA, Canberra, Australia); after sequence verification, the recombinant vector was introduced into Arabidopsis wild-type Col-0 via A. tumefaciens (GV3101) according to Clough and Bent (1998). Detection of GUS activity in young and adult T1 transformants was performed according to Jefferson et al. (1987) by incubation in staining buffer at 37°C overnight.
To obtain fusion constructs of TXR1 to GFP, a 565-bp TXR1 cDNA fragment was amplified by PCR from a wild-type Arabidopsis Col-0 seedling cDNA pool using primers 5′-TCTATTCCCTTCTTCCTTCAAGTCC-3′ and 5′-TATGGCCGTTTTGTAAGTTCCAC-3′. Subsequently, primers 5′-CGGCAGAATTCATGGCTGGGAGACTACTTGC-3′ and 5′-AGCCGGATCCCTTAACTAGGTGTACCGTTGC-3′ were used to amplify a 373-bp product from the TXR1 cDNA fragment. After EcoRI-BamHI restriction, the product was ligated into binary vector pEZR(K)-LC (provided by Gert-Jan de Boer, University of Amsterdam, The Netherlands), a derivative of pEGAD (Cutler et al., 2000), to yield the GFP-TXR1 fusion construct. Similarly, a TXR1-GFP fusion construct was obtained using primers 5′-CGGCAGAATTCATGGCTGGGAGACTACTTGC-3′ and 5′-AGCCGGATCCCGTCCACTAGGTGTACCGTTGCCT-3′ to amplify a 377-bp fragment, which then was put into binary vector pEZR(K)-LN after restriction digestion with EcoRI-BamHI. Transient expression of TXR1-GFP fusion proteins was achieved by polyethylene glycol–mediated transformation of the constructs into protoplasts of tobacco (Paszkowski et al., 1984). Confocal laser-scanning microscopy (DM IRB; Leica, Bensheim, Germany) was used to visualize GFP expression in individual cells. An excitation wavelength of 488 nm and an emission range of 505 to 515 nm were used.
Microarray Preparation
The microarrays were prepared essentially as described by Schenk et al. (2000). Briefly, the Y2001 AFGC DNA microarrays contained 11,300 Arabidopsis EST clones collected from public sources (Newman et al., 1994; White et al., 2000) and 3,000 gene-specific fragments amplified from genomic DNA. As controls, Arabidopsis clones for genes with constant high (n = 3), medium (n = 3), and low (n = 3) expression levels were distributed evenly on the slide. PCR-amplified inserts (Ruan et al., 1998) were quantified after Pico Green (Molecular Probes, Eugene, OR) staining and were checked for the presence of single bands on 1.2% agarose gels. The PCR fragments were arrayed onto GAPSII slides (Corning, Acton, MA), and the slides were blocked according to the manufacturer's recommendation. Poly(A)+ RNA (0.5 μg), prepared from wild-type Col-0 or txr1 rosettes grown on soil under 12-h-light/12-h-dark cycles at 19/16°C, was converted to single-stranded cDNA and then labeled with Cy3-dUTP (Col-0 wild type) or Cy5-dUTP (txr1 mutant) (Amersham Pharmacia, Piscataway, NJ). The fluorescently labeled cDNA samples were purified, lyophilized, dissolved in hybridization buffer, and combined. The heat-denatured probe was applied to the microarray, covered with a 25 × 60 mm2 Lifterslip (Erie Scientific, Portsmouth, NH), and hybridized at 50°C for 16 h. After hybridization, slides were washed and then dried in a SpeedVac Plus model SC210A (Savant, Holbrook, NY) before scanning.
Microarray Data Analysis
Scanning and quantification of spot intensities were performed as described by Ramonell et al. (2002). Data files then were imported into the Stanford Microarray Database and normalized (for details, see Sherlock et al., 2001; http://genome-www5.stanford.edu/MicroArray/SMD/). The primary data sets may be viewed and downloaded from the Stanford Microarray Database (experiments 21779 and 21780). Before analysis, the data set was filtered to remove both data points flagged as dubious (including saturated data points) and data points with net (channel 1, Cy3) or normalized net (channel 2, Cy5) spot intensities of ≤500. For each of the two slides, data points selected for cluster analysis were those in which the log2 (channel 1 net intensity/channel 2 normalized net intensity) was ≥2.5 standard deviations away from the mean of the log2 (ratio) values of all acceptable data points from the same slide. The data points were analyzed using a hierarchical clustering program (Eisen et al., 1998). To assign the clones represented on the microarray to genomic ORFs, each one was BLASTN queried against the Arabidopsis genomic sequence. Gene annotations were retrieved from the Arabidopsis Information Resource (http://www.arabidopsis.org).
Thaxtomin Metabolism
Nonradioactive thaxtomin A was purified from oatmeal broth cultures of Streptomyces scabies as described previously (King and Lawrence, 1996). Tritium-labeled thaxtomin was prepared by growing S. scabies for 1 day in 40 mL of oatmeal broth at 25°C. At that time, 2 mCi of 3,4,5-3H-Phe (90 Ci/mmol) was added to the culture, which then was grown for an additional 5 days. Cells were removed by centrifugation, and the culture medium was extracted twice with ethyl acetate. The volume of ethyl acetate was reduced by evaporation under an N2 stream, and the thaxtomin was purified by thin layer chromatography in chloroform:methanol (9:1). Based on an approximate, experimentally determined molar extinction coefficient in 80% methanol at 329 nm of 398, the yield was ∼160 μCi, with a specific activity of 337 μCi/μmol.
To measure the uptake and metabolism of thaxtomin, seeds were surface-sterilized, germinated, and grown for 4 days on 0.8% agar-solidified mineral medium (Murashige and Skoog, 1962) in vertically oriented Petri plates at 22°C in continuous light (∼50 μmol·m−2·s−1). For labeling, 25 seedlings were removed from the surface of the agar into 1 mL of water containing various concentrations (0.5 to 10 mM) of 3H-thaxtomin in 24-well culture dishes. Concentrations had to be kept in this range because of the relatively low specific activity of the 3H-thaxtomin, which limited the sensitivity of the assay. At the completion of the labeling period, the seedlings were washed with water and then extracted for 20 min in boiling 80% methanol. Radioactivity in the methanolic extract was determined by scintillation counting, and the dry weight of the extracted seedlings was determined, after drying, on a microbalance capable of accuracy to 1 μg.
To evaluate the metabolic fate of thaxtomin in Arabidopsis cells, plants were labeled for 24 h in 0.2 mM 3H-thaxtomin and extracted with boiling 80% methanol, and the extract was chromatographed on silica gel G with a solvent of chloroform:methanol (9:1) in the first dimension and ethyl acetate:formic acid:acetic acid:water (10:1:1:1) in the second dimension. The chromatograms were sprayed with NEN3Hance and then autoradiographed at −80°C.
Upon request, materials integral to the findings presented in this publication will be made available in a timely manner to all investigators on similar terms for noncommercial research purposes. To obtain materials, please contact W.-R. Scheible, scheible@mpimp-golm.mpg.de.
Accession Numbers
The GenBank accession number for TXR1 is AY112727. Other accession numbers are as follows: the full-length cDNA clone for the TXR1 gene, AF380643; AGI BAC clone F25L23, AL356014; full-length cDNA sequence for the Arabidopsis homolog, AY039584; rice chromosome 10 BAC OSJNBa0055P24, AC037425; rice TXR1 homolog, AAG13579; yeast homolog of TXR1, YJL104W; two TXR1 ESTs, AI996476 and AV794240; GUS gene of vector pCAMBIA1301, AF234297; and TXR1 sequence homologs from Arabidopsis (AY039584), tomato (AI781901), maize (AW061942), wheat (AW448340), soybean (BM178599), human (AF151894), mouse (NP_079847), fruit fly (AAF_46276), C. elegans (NP_499775), and S. pombe (NP_595349).
Supplementary Material
Acknowledgments
We thank Gregory Mouille and Herman Höfte (Institut National de la Recherche Agronomique, Versailles, France) for help on FTIR analysis of thaxtomin-treated Arabidopsis seedlings, Gert-Jan de Boer (University of Amsterdam, The Netherlands) for donations of vectors pEZR(K)-LC and pEZR(K)-LN, Erwin Grill (Technische Universität München, Germany) for providing the Col-0 cosmid library, CEREON Genomics for supplying information on Col/Landsberg erecta polymorphisms, Uta Deiting (Max Planck Institute of Molecular Plant Physiology) for technical assistance, Megan McKenzie (Max Planck Institute of Molecular Plant Physiology) for suggestions on the manuscript, and Caterina Brancato (Zentrum fuer Molekularbiologie der Pflanzen, Tübingen, Germany) for assistance with the GFP-protein fusion experiments. This work was supported in part by a grant to C.R.S. from the U.S. Department of Energy (DOE-FG02-00ER20133).
Article, publication date, and citation information can be found at www.plantcell.org/cgi/doi/10.1105/tpc.013342.
Footnotes
Online version contains Web-only data.
References
- Acuna, I.A., Strobel, G.A., Jacobsen, B.L., and Corsini, D.L. (2001). Glucosylation as a mechanism of resistance to thaxtomin A in potatoes. Plant Sci. 161, 77–88. [Google Scholar]
- Anzai, H., Yoneyama, K., and Yamagushi, I. (1989). Transgenic tobacco resistant to a bacterial disease by the detoxification of a pathogenic toxin. Mol. Gen. Genet. 219, 492–494. [Google Scholar]
- Bukhalid, R.A., Takeuchi, T., Labeda, D., and Loria, R. (2002). Horizontal transfer of the plant virulence gene, nec1, and flanking sequences among genetically distinct strains in the diastatochromogenes cluster. Appl. Environ. Microbiol. 68, 738–744. [DOI] [PMC free article] [PubMed] [Google Scholar]
- Clough, S.J., and Bent, A.F. (1998). Floral dip: A simplified method for Agrobacterium-mediated transformation of Arabidopsis thaliana. Plant J. 16, 735–743. [DOI] [PubMed] [Google Scholar]
- Cutler, S.R., Ehrhardt, D.W., Griffitts, J.S., and Somerville, C.R. (2000). Random GFP::cDNA fusions enable visualization of subcellular structures in cells of Arabidopsis at high frequency. Proc. Natl. Acad. Sci. USA 97, 3718–3723. [DOI] [PMC free article] [PubMed] [Google Scholar]
- Delmer, D.P., and Amor, Y. (1995). Cellulose biosynthesis. Plant Cell 7, 987–1000. [DOI] [PMC free article] [PubMed] [Google Scholar]
- Delserone, L.M., Loria, R., and Arias, I. (1991). Correlation between susceptibility of potato cultivars to Streptomyces scabies and sensitivity to thaxtomin A. Phytopathology 81, 1193–1200. [Google Scholar]
- Desprez, T., Vernhettes, S., Fagard, M., Refrégier, G., Desnos, T., Aletti, E., Py, N., Pelletier, S., and Höfte, H. (2002). Resistance against the herbicide isoxaben and cellulose deficiency caused by distinct mutations in the same cellulose synthase isoform CesA6. Plant Physiol. 128, 482–490. [DOI] [PMC free article] [PubMed] [Google Scholar]
- Eisen, M.B., Spellman, P.T., Brown, P.O., and Botstein, D. (1998). Cluster analysis and display of genome-wide expression patterns. Proc. Natl. Acad. Sci. USA 95, 14863–14868. [DOI] [PMC free article] [PubMed] [Google Scholar]
- Emanuelsson, O., Nielsen, H., Brunak, S., and von Heijne, G. (2000). Predicting subcellular localization of proteins based on their N-terminal amino acid sequence. J. Mol. Biol. 300, 1005–1016. [DOI] [PubMed] [Google Scholar]
- Engelhardt, G., Ruhland, M., and Wallnofer, P. (1999). Metabolism of mycotoxins in plants. Adv. Food Sci. 21, 71–78. [Google Scholar]
- Fagard, M., Desnos, T., Desprez, T., Goubet, F., Refrégier, G., Mouille, G., McCann, M., Rayon, C., Vernhettes, S., and Höfte, H. (2000). PROCUSTE1 encodes a cellulose synthase required for normal cell elongation specifically in roots and dark-grown hypocotyls of Arabidopsis. Plant Cell 12, 2409–2423. [DOI] [PMC free article] [PubMed] [Google Scholar]
- Fry, B.A., and Loria, R. (2002). Thaxtomin A: Evidence for a plant cell wall target. Physiol. Mol. Plant Pathol. 60, 1–8. [Google Scholar]
- Goyer, C., Vachon, J., and Beaulieu, C. (1998). Pathogenicity of Streptomyces scabies mutants altered in thaxtomin A production. Phytopathology 88, 442–445. [DOI] [PubMed] [Google Scholar]
- Healy, F.G., Bukhalid, R.A., and Loria, R. (1999). Characterization of an IS element associated with genetically diverse plant pathogenic Streptomyces spp. J. Bacteriol. 181, 1562–1568. [DOI] [PMC free article] [PubMed] [Google Scholar]
- Healy, F.G., King, R.R., and Loria, R. (1997). Identification of thaxtomin A non-producing mutants of Streptomyces scabies. Phytopathology 87, S41. [Google Scholar]
- Healy, F.G., Wach, M., Krasnoff, S.B., Gibson, D.M., and Loria, R. (2000). The txtAB genes of the plant pathogen Streptomyces acidiscabies encode a peptide synthetase required for phytotoxin thaxtomin A production and pathogenicity. Mol. Microbiol. 38, 794–804. [DOI] [PubMed] [Google Scholar]
- Jefferson, R.A., Kavanagh, T.A., and Bevan, M.W. (1987). GUS fusions: β-Glucuronidase as a sensitive and versatile gene fusion marker in higher plants. EMBO J. 6, 3901–3907. [DOI] [PMC free article] [PubMed] [Google Scholar]
- King, R.R., and Lawrence, C.H. (1996). Characterization of new thaxtomin A analogues generated in vitro by Streptomyces scabies. J. Agric. Food Chem. 44, 1108–1110. [Google Scholar]
- King, R.C., Lawrence, C.H., and Calhoun, L. (1992). Chemistry of phytotoxins associated with Streptomyces scabies, the causal organism of potato common scab. J. Agric. Food Chem. 40, 834–837. [Google Scholar]
- King, R.R., Lawrence, C.H., Clark, M.C., and Calhoun, L.A. (1989). Isolation and characterization of phytotoxins associated with Streptomyces scabies. J. Chem. Soc. Chem. Commun. 13, 849–850. [Google Scholar]
- King, R.R., Lawrence, C.H., Clark, M.C., and Calhoun, L.A. (1991). Correlation of phytotoxin production with pathogenicity of Streptomyces scabies isolates from scab infected tubers. J. Am. Potato Assoc. 68, 675–680. [Google Scholar]
- King, R.R., Lawrence, C.H., and Gray, J.A. (2001). Herbicidal properties of the thaxtomin group of phytotoxins. J. Agric. Food Chem. 49, 2298–2301. [DOI] [PubMed] [Google Scholar]
- Kinkel, L.L., Bowers, J.H., Shimizu, K., Neeno-Eckwall, E.C., and Schottel, J.L. (1998). Quantitative relationship among thaxtomin A production, potato scab severity, and fatty acid composition in Streptomyces. Can. J. Microbiol. 44, 768–776. [PubMed] [Google Scholar]
- Lambert, D.H., and Loria, R. (1989). Streptomyces scabies sp. nov. nom. rev. Int. J. Syst. Bacteriol. 39, 387–392. [Google Scholar]
- Lawrence, C.H., Clark, M.C., and King, R.R. (1990). Induction of common scab symptoms in aseptically cultured potato tubers by the vivotoxin, thaxtomin. Phytopathology 80, 606–608. [Google Scholar]
- Leiner, R.H., Fry, B.A., Carling, D.E., and Loria, R. (1996). Probable involvement of thaxtomin A in pathogenicity of Streptomyces scabies on seedlings. Phytopathology 86, 709–713. [Google Scholar]
- Loria, R., Bukhalid, R.A., Creath, R.A., Leiner, R.H., Olivier, M., and Steffens, J.C. (1995). Differential production of thaxtomins by pathogenic Streptomyces species in vitro. Phytopathology 85, 537–541. [Google Scholar]
- Loria, R., Bukhalid, R.A., Fry, B.A., and King, R.R. (1997). Plant pathogenicity in the genus Streptomyces. Plant Dis. 81, 836–846. [DOI] [PubMed] [Google Scholar]
- Lukowitz, W., Gillmor, C.S., and Scheible, W.R. (2000). Positional cloning in Arabidopsis: Why it feels good to have a genome initiative working for you. Plant Physiol. 123, 795–806. [DOI] [PMC free article] [PubMed] [Google Scholar]
- Meyer, K., Leube, M.P., and Grill, E. (1994). A protein phosphatase 2c involved in ABA signal transduction in Arabidopsis thaliana. Science 264, 1452–1455. [DOI] [PubMed] [Google Scholar]
- Miyajima, K., Tanaka, F., Takeuchi, T., and Kuninaga, S. (1998). Streptomyces turgidiscabies sp. nov. Int. J. Syst. Bacteriol. 48, 495–502. [DOI] [PubMed] [Google Scholar]
- Mouille, G., Robin, S., Lecomte, M., Pagant, S., and Höfte, H. (2003). Global analysis of cell wall polysaccharides in Arabidopsis using Fourier transform infrared (FTIR) microspectroscopy. Plant J., in press. [DOI] [PubMed]
- Murashige, T., and Skoog, F. (1962). A revised medium for rapid growth and bioassays with tobacco tissue cultures. Physiol. Plant. 15, 473–497. [Google Scholar]
- Newman, T., Debruijn, F.J., Green, P., Keegstra, K., Kende, H., McIntosh, L., Ohlrogge, J., Raikhel, N., Somerville, S., Thomashow, M., Retzel, E., and Somerville, C. (1994). Genes galore: A summary of methods for accessing results from large-scale partial sequencing of anonymous Arabidopsis cDNA clones. Plant Physiol. 106, 1241–1255. [DOI] [PMC free article] [PubMed] [Google Scholar]
- Omura, S., Tanaka, Y., Shinose, M., and Takahashi, Y. (1990). Phthoxazolin, a specific inhibitor of cellulose biosynthesis produced by a strain of Streptomyces sp. J. Antibiot. 43, 1034–1035. [DOI] [PubMed] [Google Scholar]
- Park, S.H., Stierle, A., and Strobel, G.A. (1994). Metabolism of maculosin, a host-specific phytotoxin produced by Alternaria alternata on spotted knapweed (Centaura maculosa). Phytochemistry 35, 101–106. [Google Scholar]
- Paszkowski, J., Shillito, R.D., Saul, M., Mandfik, V., Hohn, T., Hohn, B., and Potrykus, I. (1984). Direct gene transfer to plants. EMBO J. 3, 2717–2722. [DOI] [PMC free article] [PubMed] [Google Scholar]
- Peng, L., Hocart, C.H., Redmond, J.W., and Williamson, R.E. (2000). Fractionation of carbohydrates in Arabidopsis root cell walls shows that three radial swelling loci are specifically involved in cellulose production. Planta 211, 406–414. [DOI] [PubMed] [Google Scholar]
- Ramonell, K.M., Zhang, B., Ewing, R.M., Chen, Y., Xu, D., Stacey, G., and Somerville, S. (2002). Microarray analysis of chitin elicitation in Arabidopsis thaliana. Mol. Plant Pathol. 3, 301–311. [DOI] [PubMed] [Google Scholar]
- Ruan, Y., Gilmore, J., and Conner, T. (1998). Towards Arabidopsis genome analysis: Monitoring expression profiles of 1400 genes using cDNA microarrays. Plant J. 15, 821–833. [DOI] [PubMed] [Google Scholar]
- Scheible, W.R., Eshed, R., Richmond, T., Delmer, D., and Somerville, C.R. (2001). Modifications of cellulose synthase confer resistance to isoxaben and thiazolidinone herbicides in Arabidopsis Ixr1 mutants. Proc. Natl. Acad. Sci. USA 98, 10079–10084. [DOI] [PMC free article] [PubMed] [Google Scholar]
- Schenk, P.M., Kazan, K., Wilson, I., Anderson, J.P., Richmond, T., Somerville, S.C., and Manners, J.M. (2000). Coordinated plant defense responses in Arabidopsis revealed by microarray analysis. Proc. Natl. Acad. Sci. USA 97, 11655–11660. [DOI] [PMC free article] [PubMed] [Google Scholar]
- Seki, M., Narusaka, M., Yamaguchi-Shinozaki, K., Carninci, P., Kawai, J., Hayashizaki, Y., and Shinozaki, K. (2001). Arabidopsis encyclopedia using full-length cDNAs and its application. Plant Physiol. Biochem. 39, 211–220. [Google Scholar]
- Sherlock, G., et al. (2001). The Stanford Microarray Database. Nucleic Acids Res. 29, 152–155. [DOI] [PMC free article] [PubMed] [Google Scholar]
- Song, W., Koh, S., Czako, M., Marton, L., Drenkard, E., Becker, J.M., and Stacey, G. (1997). Antisense expression of the peptide transport gene AtPTR2-B delays flowering and arrests seed development in transgenic Arabidopsis plants. Plant Physiol. 114, 927–935. [DOI] [PMC free article] [PubMed] [Google Scholar]
- Song, W., Steiner, H.Y., Zhang, L., Naider, F., Stacey, G., and Becker, J.M. (1996). Cloning of a second Arabidopsis peptide transport gene. Plant Physiol. 110, 171–178. [DOI] [PMC free article] [PubMed] [Google Scholar]
- Strobel, G.A., and Hess, W.M. (1997). Glucosylation of the peptide leucinostatin A, produced by an endophytic fungus of European yew, may protect the host from leucinostatin toxicity. Chem. Biol. 4, 529–536. [DOI] [PubMed] [Google Scholar]
- Tsuchiya, K., Kobayashi, S., Nishikiori, T., Nakagawa, T., and Tatsuta, K. (1997). Epopromycins, novel cell wall synthesis inhibitors of plant protoplast produced by Streptomyces sp. NK04000. J. Antibiot. 50, 261–263. [PubMed] [Google Scholar]
- White, J.A., Todd, J., Newman, T., Girke, T., Focks, N., Martinez de Iláduya, O., Jaworski, J.G., Ohlrogge, J., and Benning, C. (2000). A new set of Arabidopsis ESTs from developing seeds: The metabolic pathway from carbohydrates to seed oil. Plant Physiol. 124, 1582–1594. [DOI] [PMC free article] [PubMed] [Google Scholar]
- Winzeler, E.A., et al. (1999). Functional characterization of the S. cerevisiae genome by gene deletion and parallel analysis. Science 285, 901–906. [DOI] [PubMed] [Google Scholar]
- Wu, S., Ramonell, K., Gollub, J., and Somerville, S.C. (2001). Plant gene expression profiling with DNA microarrays. Plant Physiol. Biochem. 39, 917–926. [Google Scholar]
- Zhang, J.Z., Abbud, W., Prohaska, R., and Ismail-Beigi, F. (2001). Overexpression of stomatin depresses GLUT-1 glucose transporter activity. Am. J. Physiol. Cell Physiol. 280, C1277–C1283. [DOI] [PubMed] [Google Scholar]
Associated Data
This section collects any data citations, data availability statements, or supplementary materials included in this article.


