

Abstract
Uridine-rich small nuclear ribonucleoproteins (U snRNPs) are splicing factors, which are diffusely distributed in the nucleoplasm and also concentrated in nuclear speckles. Fluorescently labeled, native U1 snRNPs were microinjected into the cytoplasm of living HeLa cells. After nuclear import single U1 snRNPs could be visualized and tracked at a spatial precision of 30 nm at a frame rate of 200 Hz employing a custom-built microscope with single-molecule sensitivity. The single-particle tracks revealed that most U1 snRNPs were bound to specific intranuclear sites, many of those presumably representing pre-mRNA splicing sites. The dissociation kinetics from these sites showed a multiexponential decay behavior on time scales ranging from milliseconds to seconds, reflecting the involvement of U1 snRNPs in numerous distinct interactions. The average dwell times for U1 snRNPs bound at sites within the nucleoplasm did not differ significantly from those in speckles, indicating that similar processes occur in both compartments. Mobile U1 snRNPs moved with diffusion constants in the range from 0.5 to 8 μm2/s. These values were consistent with uncomplexed U1 snRNPs diffusing at a viscosity of 5 cPoise and U1 snRNPs moving in a largely restricted manner, and U1 snRNPs contained in large supramolecular assemblies such as spliceosomes or supraspliceosomes.
INTRODUCTION
Cell nuclei exhibit a high degree of spatial and functional organization of their molecular components (Cremer and Cremer, 2001; Misteli, 2005). The question how nuclear factors move and interact within this well-organized structure, how molecular factors find their targets, and how trafficking exerts a possible regulatory function is currently a focus in cell biology (Bubulya and Spector, 2004; Pederson, 2004; Gorski and Misteli, 2005). An exact quantification of interactions and molecular mobilities is the prerequisite for a detailed understanding of the formation of intranuclear structures and the regulation of their function by modifications of interactions and transport (Gorski et al., 2006).
Eukaryotic pre-mRNA transcripts go through several post-transcriptional modifications before their translocation by the NPCs into the cytoplasm (Darzacq et al., 2005). Usually pre-mRNAs have noncoding sequences designated as introns that must be removed from the sequence to yield functional mRNA. This essential biochemical processing is designated as pre-mRNA splicing, which is achieved by intranuclear molecular pre-assembled complexes, the so-called spliceosomes. Spliceosomes consist of more than 70 different proteins, many of which are part of the uridine-rich small nuclear ribonucleoproteins (U snRNPs), which are classified as U1, U2, U5, and U4/U6, according to their small nuclear RNA (snRNA) content. With the exception of U6, the snRNAs are synthesized in the nucleus by RNA polymerase II and exported to the cytoplasm, where sets of common and specific proteins bind to the snRNAs (Will and Luhrmann, 2001). After their cytoplasmic assembly U snRNPs are reimported into the nucleus. Spliceosomes have been shown to be subcomplexes of huge multicomponent nuclear RNP complexes, so-called supraspliceosomes. Purified by density gradient centrifugation they sedimented as 200S complexes (Sperling et al., 1985; Spann et al., 1989) with a mass of 21 MDa (Muller et al., 1998). Three-dimensional image reconstruction of isolated supraspliceosomes revealed a geometric extension of 50 × 50 × 35 nm3 (Sperling et al., 1997; Medalia et al., 2002).
The spatiotemporal distribution of splicing factors within cell nuclei is an important example of the functional organization of the cell nucleus (Lamond and Spector, 2003). Fluorescence labeling of splicing factors such as ASF/SF2 or U snRNPs reveals numerous irregular, punctuate structures distributed on a more homogeneous background within cell nuclei. These fluorescent structures are formed by the enrichment of splicing factors in subnuclear structures such as interchromatin granule clusters and perichromatin fibrils collectively designated as splicing factor compartments or speckles. The functional role of speckles is still unresolved. Possible functions include splicing factor reprocessing sites or storage spaces regulating the level of free and active factors. Another hypothesis is that in speckles splicing factors are assembled together with other components of the transcription and RNA processing machinery into supramolecular complexes, whereas the dispersed splicing factors might represent active complexes involved in cotranscriptional splicing.
In the last few years large efforts have been undertaken to gain insight into intranuclear mobility and interactions of intranuclear molecular components—DNA-binding proteins, splicing factors, and RNP particles. The experimental approaches mostly used were fluorescence correlation spectroscopy (FCS; Brock et al., 1998; Politz et al., 1998, 2006; Schwille et al., 1999; Wachsmuth et al., 2000), and fluorescence recovery after photobleaching (FRAP) or photoactivation (PA) combined with mathematical modeling (Seksek et al., 1997; Houtsmuller et al., 1999; Kruhlak et al., 2000; Lukacs et al., 2000; Phair and Misteli, 2000; Verkman, 2002; Carrero et al., 2003; Braga et al., 2004; Phair et al., 2004; Beaudouin et al., 2006). In addition to these established techniques, recently single-particle imaging based on state-of-the-art videomicroscopy has proven its power to visualize details of trafficking within the cell nucleus in a sequence of publications (Goulian and Simon, 2000; Kues et al., 2001a, 2001b; Seisenberger et al., 2001; Babcock et al., 2004; Shav-Tal et al., 2004; Bausinger et al., 2006).
The results obtained so far must be discriminated according to analysis of tracer molecule mobility and studies focusing on functionally active proteins or RNPs (see review, Gorski et al., 2006). Inert tracer molecules usually show diffusion coefficients within cell nuclei ∼4–15 times smaller than aqueous solution (Lang et al., 1986; Seksek et al., 1997; Braga et al., 2004). Usually, biologically active molecules were reduced in their apparent mobility by a factor of 10–100 compared with aqueous solution (reviewed by Houtsmuller and Vermeulen, 2001; Verkman, 2002; Gorski et al., 2006). The significant reduction of mobility was interpreted to indicate frequent, but transient interactions of the examined molecular factors with numerous largely immobile intranuclear structures. Obviously, the motion of nuclear proteins, RNA molecules, or RNP particles reflects their intranuclear function. Surprisingly, the GFP conjugate of ASF/SF2 showed the same mobility independently of whether it was associated with speckles or dispersed in the nucleoplasm (Kruhlak et al., 2000). In accordance to this work, it was recently found that the mobility of poly(A) RNA did not differ between speckles and nucleoplasm in HeLa cell nuclei (Politz et al., 2006).
In the last few years single-molecule tracking (SMT) by high-speed fluorescence videomicroscopy has evolved to a routine method in the biosciences (Schwille and Kettling, 2001; Moerner, 2003; Sako and Yanagida, 2003; Tinnefeld and Sauer, 2005). It still appeared debatable, however, whether the time resolution attainable by high-speed cameras was really high enough to follow the trajectories of single protein molecules within the cellular interior. Recently, we demonstrated the imaging and tracking of single protein molecules in physiological buffer at frame rates of ∼350 Hz (Grunwald et al., 2006). Analysis of the single-molecule trajectories yielded the same diffusion constants as control measurements performed by FCS. Considering the generally higher intracellular viscosity, it was thus proven that the tracking of proteins inside living cells is faithfully possible if frame rates in the range of 100 frames per second or higher can be achieved. Previously we used single-molecule imaging for analyzing the movements of a recombinant β-galactosidase protein (Kues et al., 2001b) and of the splicing factor U1 snRNP (Kues et al., 2001a) in digitonin-permeabilized cells with maximum frame rates of 35 Hz. These cells represented a system, which still contained intracellular structures as geometric constraints on mobility, but presumably not the functionally intact DNA and RNA processing complexes.
In the current study we applied single-molecule tracking to study the intranuclear dynamics of a biologically active splicing factor in live cells. We microinjected fluorescently labeled splicing factors U1 snRNPs into the cytoplasm of living cells and therefore maintained their biochemical functions, integrity, and the structure of the nuclei. The splicing factors were imported into the nucleus by nucleo-cytoplasmic transport. Imaging was performed using a fast and sensitive electron-multiplying CCD (EMCCD). Using this camera we could follow the movements of U1 snRNPs in real time, but could also focus on slow events by reducing the imaging frame rate. We found that U1 snRNPs moved with diffusion coefficients in the range of 0.5–8 μm2/s. Although long-distance movements of U1 snRNPs could clearly be observed, transient binding to immobile sites was the dominating process. The dissociation kinetics from these binding sites was analyzed on different time scales ranging from milliseconds to seconds. Our data provided new insight into the molecular dynamics of a functional ribonucleoprotein particle within living cells.
MATERIALS AND METHODS
Reagents and Buffers
Cy5-labeled U1 snRNPs were prepared as described in Huber et al. (1998). Purity, functionality, and integrity of labeled U1 snRNPs were confirmed as described in Marshallsay and Luhrmann (1994). Before final use in microinjection experiments U1 snRNP-Cy5 were diluted and centrifuged in transport buffer (50 mM HEPES/KOH, pH 7.3, 110 mM potassium acetate, 5 mM sodium acetate, 2 mM magnesium acetate, 1 mM EGTA, 2 mM DTT). The plasmid coding for fusion proteins of ASF/SF2-GFP was a kind gift from Judith Sleeman.
Cell Culture and Transfection
HeLa cells were grown in DMEM supplemented with 10% FCS. For live cell analysis cells were seeded on cover glasses. As reference label for the nuclear speckles cells were transfected with plasmids coding for fusion proteins of ASF/SF2-GFP (Sleeman et al., 1998) using an Effectene transfection kit (Qiagen, Hilden, Germany) 1 d after seeding. Microscopic analysis was performed in a custom-built sample holder at room temperature 24 h after transfection to allow expression of fusion proteins.
Single-Molecule Microscopy
Single-particle tracking (SPT) experiments were performed using a custom-built single-molecule microscope based on a Zeiss Axiovert 100TV equipped with a 63× NA 1.4 oil immersion objective lens (Jena, Germany; Kubitscheck et al., 2005). Green fluorescence was excited by an Ar+-Laser emitting at 488 nm, and red fluorescence was excited by a HeNe-Laser emitting at 632.8 nm. Laser illumination was switched on only during image acquisition by means of an acousto-optical tunable filter. For single-particle image acquisition we used the iXon DV 860 BI camera (Andor Technology, Belfast, Northern Ireland) in combination with a 4× magnifier yielding a pixel size in the object space of 95.24 nm. Microinjection of U1 snRNPs was carried out with an Eppendorf injection and micromanipulation setup using an injection time of 1 s at an injection pressure of 100 hPa and a holding pressure 15 hPa. Single-particle imaging was started 10 min after microinjection of U1 snRNPs into the cytoplasm to allow cells to recover. Cell recovery was monitored by examining the cellular morphology in bright-field mode by digitally contrast-enhanced imaging. Before acquisition of the movies a focal plane was searched to optimize the contrast of the GFP-labeled nuclear speckles. After taking an image in the green channel with a Zeiss Axiocam MRm, movies recorded in the red channel illustrated the motion of U1 snRNP-Cy5 after its nuclear import. Usually 1000 frames were recorded in a single movie, with integration times of 5 and 10 ms and frame rates of kacq = 5, 10, 100, and 200 Hz. A total of 10 cells was examined, yielding more than 100 single movies. The green and red fluorescence channels were scaled and aligned to each other using images of dispersed, immobilized multicolor fluorescence beads (TetraSpeck Microspheres, diameter 0.1 μm, Molecular Probes, Leiden, The Netherlands).
Image Processing of Video Images
Identification and tracking of the single-molecule signals was accomplished using Diatrack 3.0 (Semasphot, North Epping, Australia), a commercial image processing program for the identification and localization of single-particle signals and trajectories (Vallotton et al., 2003). For tracking a maximal displacement of 10 pixels from frame to frame was allowed. The application of the automated data analysis scheme to our data was problematic, because the single-molecule data often displayed low signal-to-noise ratios. Therefore, after Diatrack processing we verified the single-particle tracks in the original, unprocessed data by visual inspection. Intracellular compartments (cytoplasm, nucleoplasm, or speckles) were marked in specific colors using IPLab (Scanalytics Inc., Fairfax, VA), and this false color reference image was used for compartment assignment of the individual tracks with the help of user-written macros in Origin 7.5 (Microcal Software, Northhampton, MA). All tracks within the cytoplasm including a 10-pixel border region near the nuclear envelope were discarded to avoid evaluation of particles during their import into the nucleus. Also, all tracks within a distance of eight pixels from the image border were discarded.
Trajectory Analysis
Each U1 snRNP-Cy5 trajectory was defined as a set of coordinates (xi, yi) with 1 ≤ i ≤ N, where N denoted the total number of observations. In the case of two-dimensional Brownian motion the mean square displacements, 〈r2(tc)〉, are related to time and diffusion coefficient, D:
Thus, a linear relationship between 〈r2(tc)〉 and time indicates Brownian motion. However, if the motion is not due to free diffusion but, e.g., to confined diffusion or directed flow, the relation between the mean square displacements (MSD) and time is nonlinear (Saxton and Jacobson, 1997). Furthermore, the joint analysis of the trajectories of an ensemble of molecules according to Equation 1 is not suitable when the population contains different mobility fractions. Such heterogeneous populations are more appropriately analyzed by a jump distance analysis.
Jump Distance Analysis
The probability that a particle starting at a specific position will be encountered within a shell of radius r and width dr at time t from that position is for a single species diffusing in two dimensions given as follows (Crank, 1975):
 |
if we identify the starting position with the origin. Experimentally, this probability distribution could be approximated by a frequency distribution, which was obtained by counting the jump distances within respective intervals [r, r + dr] traveled by single particles after a given time lag. In cases of particles with multiple diffusive species or particles changing the mode of motion along their trajectory the jump distance distributions cannot satisfactorily be fitted by eq. 2 assuming a single diffusion coefficient. Such different mobility fractions can be detected, and quantified by curve fitting taking several diffusion terms into account. E.g., for a jump distance distribution containing contributions from three species with differing diffusion constants,
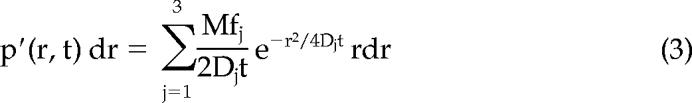 |
where M is related to the number of jumps considered in the analysis, and f1, f2, and f3 designate the fractions with diffusion constants D1, D2, and D3, respectively.
Immobile Particles
For immobile particles the jump distance between two subsequent frames corresponded to a maximum drmax, which was determined by the localization precision alone. We defined as drmax the threefold localization precision (drmax = 3σloc ≈ 100 nm). All particles that did not jump farther than drmax between subsequent frames were taken as immobile.
To determine the binding durations, we screened all trajectories for the jump distances between subsequent frames and counted the number of subsequent steps with jump lengths smaller than drmax. This number, n, characterized the length of an immobile trajectory or trajectory segment. For all immobile trajectory segments identified in this manner, the maximum extensions in the x and y direction, Δxmax and Δymax, were determined. All trajectories with either Δxmax or Δymax >150 nm were inspected visually to decide whether they were produced by indisputable immobile particles with a random distribution of the jump directions. This was done to exclude the possibility that several smaller steps into the same direction would finally lead to a significant, sliding movement beyond the localization precision. No trajectory had to be rejected because of this criterion. Finally, n was translated into a binding time, τ, by τ = (n + 1)/kaq. The single values of τ were used to calculate a decay curve N(τ) giving the number of particles, which were still immobile after time τ.
Correction of Photobleaching
Photobleaching was quantified by plotting the average intensity in the cell nucleus as a function of time. Because U1 snRNPs were not exported, the observed fluorescence decay was due to photobleaching. The fluorescence decay was fitted by a monoexponential function, which yielded a bleaching time constant of τbl = 120 ± 30 ms. Hence, 50% of individual U1 snRNPs were bleached after the acquisition of 16 images at a single-frame integration time of 5 ms, corresponding to a continuous illumination of 80 ms. The decay curves N(τ) of bound particles was corrected for bleaching by N(τ)corr = N(τ) · eτ/τbl.
RESULTS
Single U1 snRNPs Can Be Visualized and Tracked in Real Time in Live Cell Nuclei
U1 snRNPs labeled by Cy5 were microinjected at a low concentration into the cytoplasm of live HeLa cells transiently expressing ASF/SF2-GFP. By using very gentle injection conditions the internal structure of the nuclei was left unaffected by the microinjection, and the particles could be examined in an undisturbed intranuclear environment after their nuclear import. According to previous work (Kleinschmidt and Pederson, 1990) only a very small percentage of the U1 snRNPs introduced into the cytoplasm was expected to be imported into the nucleus after 10 min, which was the time when measurements were started. The concentration of the injected fluorescently labeled U1 snRNPs was chosen such that the concentration in the nucleus was in the picomolar range. This extremely low concentration of particles allowed imaging the particles spatially separated from each other. Using a custom-built single-molecule microscope equipped with efficient laser irradiation and a fast, highly sensitive EMCCD imaging system, single fluorescent RNP complexes could be visualized in real time in the cellular interior. Thereby high-speed movies of the functioning of single U1 snRNPs within living cells (see Supplementary Movie 1, Online Supplementary Material) could be recorded, which allowed the identification and extraction of single-particle traces by dedicated image processing tools (for details on particle identification and trajectory extraction, see Materials and Methods). An example of the trajectories of single Cy5-labeled U1 snRNPs and their spatial positions within a cell nucleus are shown in Figure 1. The corresponding Supplementary Movie was recorded at 200 Hz. Figure 1A shows trajectories of numerous single mobile and immobile U1snRNPs. The RNP traces were overlaid to the green fluorescence image of the same HeLa cell nucleus expressing ASF/SF2-GFP. The brighter spots marked by dark-gray lines indicated the positions of splicing factor compartments or speckles. Note that the ASF/SF2-GFP was not imaged by a confocal but a normal fluorescence microscope. Therefore, the contrast of the speckles was not as high as can be achieved by confocal imaging (Lamond and Spector, 2003). Plots like this were produced for each acquired single-particle movie and represented the first qualitative views onto the U1 snRNP dynamics within living cell nuclei. Mobile U1 snRNPs as well as transiently immobilized particles could well be distinguished and analyzed in the nucleoplasm as well as inside speckles. The white box in Figure 1A marks a region containing a single trajectory, which was analyzed in detail in Figure 1, B–D. Figure 1B displays the sequence of single frames showing the RNP on its trajectory. A magnified plot of the trajectory is displayed in Figure 1C. This plot reveals that the particle moved to a specific site, resided here for a short time, and then left the site again. Figure 1D displays the time course of the fluorescence signal in the attachment region. On approach of the particle, the signal increased from background level and remained clearly above it for nine images. This illustrated that the particle remained for 45 ms at the specific position before leaving. In addition, this plot demonstrated the excellent signal-to-noise ratio (SNR) of single U1 snRNP-Cy5 imaging in the cell nuclei.
Figure 1.

Trajectories of single U1 snRNPs in a living cell nucleus. (A) Trajectories (black dots connected by black lines) of numerous single U1snRNPs extracted from a single-molecule movie, which was recorded at 200 Hz (Supplementary Movie 1, Online Supplementary Data). The trajectories were plotted over an image of the ASF/SF2-GFP, which was transiently expressed in the respective HeLa cell nucleus. Here, all nuclear trajectories were shown; however, those close to the borders were not evaluated (see Materials and Methods). The brighter spots marked by dark gray lines indicated the positions of speckles. The approximate position of the nuclear envelope was deduced from the limits of ASF/SF2-GFP fluorescence, and indicated by the white line. Mobile U1 snRNPs as well as transiently immobilized RNPs could well be distinguished within nucleoplasm and speckles. The white bar corresponded to 2 μm. The white box marks a region containing a single trajectory, which was scrutinized in B to D. (B) The short image sequence of the trajectory marked in A. The size of a single image was 8 μm2. (C) Magnified view of the positions, at which the U1 snRNP was observed, revealing that the RNP moved to a specific site, resided there for a certain time and then left the site again. Please note that the complete field shown corresponds to 1 μm2 only. (D) Time course of the fluorescence signal at the attachment region x = 6.77 ± 0.05 and y = 2.67 ± 0.05 μm, which indicated that the particle remained for 45 ms at the specific nucleoplasmic position before leaving.
Single U1 snRNPs Were Predominantly Observed during Binding
Single U1snRNP particles were often observed for longer periods of time at specific sites such as shown in the example above (Figure 1C). Figure 2A shows a magnified view of a specific region of a cell nucleus. At numerous positions (see black arrows) single U1 snRNPs were observed for extended periods of time at specific spots. We examined the geometrical extension of these spots by calculating the center of mass of 100 arbitrarily selected spots in different cells and plotted the distance distribution of the single positions to their respective centers (Figure 2B). This distance distribution could satisfactorily be described by a Gaussian distribution with a SD of σexp = 30 ± 5 nm. It should be noted that the position measurement of a single particle or molecule necessarily has a limited precision, which is defined by the SNR and other parameters, such as pixel size and magnification of the microscope (Kubitscheck et al., 2000; Thompson et al., 2002). The fundamental cause for the limited precision is the photon noise of the single-molecule fluorescence emission. Hence, for a completely immobile molecule, the measured position has a specific variation upon repetition of the measurement, which is designated as localization precision. This localization precision can be estimated by theoretical and experimental means and yielded for the SNR values of 5–10 obtained by us in the cellular interior a value of σtheo = 20–25 nm (Kubitscheck et al., 2000). Hence, the single U1 snRNPs, which appeared repetitively at distinct positions within the nuclei, showed a positional variation almost identical to that of completely immobile particles. We can conclude that these particles were firmly attached to geometrically well-defined, specific sites over the respective observation time.
Figure 2.

The majority of single U1 snRNPs was in a bound state. (A) Magnified view of a specific region of a cell nucleus. At many positions as marked by black arrows single U1 snRNPs were observed for extended periods of time at specific sites; scale bar, 1 μm. (B) The distance distribution of the single positions of 100 randomly selected immobile trajectories to their respective centers could well be described by a Gaussian distribution with a SD of 30 nm (dashed line). A slight deviation between fit and histogram occurred at distances greater than 60 nm.
Dwell Times of Single U1 snRNPs at Their Binding Sites
Movies of the intranuclear U1 snRNP dynamics revealed that binding durations of individual particles varied significantly ranging from milliseconds to seconds. However, single-particle fluorescence could only be observed in a limited number of frames before final photobleaching. The average frame number over which single U1 snRNPs could be observed was 12. Therefore, photobleaching made the direct observation of long binding events with a high frame rate difficult. To obtain a more complete view of the U1 snRNP binding events, we acquired movies at different frame rates kacq ranging from 5 to 200 Hz.
For immobile particles the lateral distance between two subsequent observations was defined solely by the localization precision. To account for all immobile particles, we defined a maximum step size drmax, the threefold localization precision (drmax = 3σexp ≈ 100 nm). All particles that did not move beyond drmax between subsequent frames were regarded as immobile, and 99.7% of all immobile particles were taken into account by this criterion.
For determination of the binding durations the jump distances between subsequent frames were screened, and the number of subsequent steps with jump lengths smaller than drmax was counted. This number n corresponded to the length of an immobile trajectory segment. Finally, the number of jumps in sequence n for which the particles did not move was translated into a binding time τ, with τ = (n + 1)/kacq. These data were used to construct a decay curve N(τ) quantifying the number of molecules, which were still bound at a specific site after time τ. Such decay curves were determined from all movies obtained with a given kacq for intranuclear binding sites within and outside speckles. Finally the decay curves were corrected for photobleaching of the U1 snRNPs (see Materials and Methods).
Figure 3, A–D, shows the resulting decay curves N(τ) quantifying the dissociation of U1 snRNPs from the putative binding sites observed at imaging rates of 200, 100, 10, and 5 Hz. The decay curves were determined for the nucleoplasm (○) and speckles (•). The decay kinetics did not comply with monoexponential functions, but fits using double-exponential decay functions yielded for all data sets satisfactory results (full and dotted lines in Figure 3, A–D, respectively). From the fits we calculated the weighted averages of the respective decay times τave and plotted these as a function of the cycle time (inverse of the frame rate) in Figure 3E. Obviously, the average decay times for nucleoplasm and speckles did not differ much, indicating comparable dwell times of U1 snRNPs in both nuclear domains. However, it was remarkable that the dwell times were not constant for different cycle times, but on the contrary depended on the time scale at which the binding was analyzed. Obviously the dissociation of U1 snRNPs from their intranuclear binding sites could not be described by a simple bimolecular dissociation kinetics. The unusual kinetics is discussed thoroughly below.
Figure 3.

Binding duration of immobile U1 snRNPs. (A–D) The curves quantify the dissociation of U1 snRNPs from binding sites observed at 200, 100, 10, and 5 Hz as indicated in the graphs. The axis labels given at the left hand axis refer to the nucleoplasmic binding (○), and the labels at the right hand axis refer to the binding in speckles (•). The lines show the results of fits to the data using a sum of two exponentials. Dotted lines, the fits to the nucleoplasm data; solid lines, fits to the speckle data. (E) The averaged decay times as determined by the fits in A–D were determined and plotted as a function of the image cycle time. Obviously the binding times were related to the time scale, at which the binding was analyzed.
Intranuclear Mobility of U1 snRNPs
The movie data (see Online Supplementary Material, Supplementary Movie 1) and Figures 1 and 2 demonstrate that U1 snRNPs were mostly observed in an immobile, obviously bound state. However, the high-speed movies also show numerous clearly mobile U1 snRNPs, from which direct information on the mobility characteristics of intranuclear U1 snRNPs could be obtained. Supplementary Movie 2 shows an example of a mobile U1 snRNP, the single frames of the sequence that are shown and analyzed in Figure 4. This mobile U1 snRNP was observed in 10 subsequent frames in a sequence acquired at 100 Hz with an integration time of 5 ms per frame. The particle was moving within the nucleoplasm (for an overlay with the ASF-GFP image, see Supplementary Figure 1 in the Online Supplementary Material). Figure 4A shows the single frames, which were filtered and background subtracted to enhance the particle contrast. Figure 4B displayed the line profile of the particle. The profile demonstrated that an unambiguous identification of the particle above the background noise was straightforward. The complete trajectory of the particle is shown in Figure 4C in a magnified view, whereas the MSDs of this trajectory were plotted as a function of time in Figure 4D. A linear fit to these data according to Eq. (1) yielded a diffusion constant of D = 6.3 ± 0.6 μm2/s.
Figure 4.

Trajectory analysis of a typical mobile U1 snRNP. (A) The frames show the trajectory of a typical mobile U1 snRNP. The position of the U1 snRNP was marked by an arrow. Sequence from a movie taken with 100 Hz and a frame integration time of 5 ms. Original images were smoothed by a Gaussian kernel (2 pixel radius), and the background was subtracted (rolling ball, r = 20) for display here; original and filtered data to this particle are available online; see Supplementary Movie 2. Full field: (128 pixel)2 corresponding to (12.2 μm)2. (B) Line intensity profile through the position indicated in frame 6 of the sequence. (C) Trajectory of the particle in a magnified view. Please note that the complete field shown corresponds to 9 μm2. (D) Mean square displacements of the single-particle trajectory as a function of time. A linear fit to these data yielded a diffusion constant of D = 6.3 ± 0.6 μm2/s. The deviations from linearity for higher MSD values were due to the fact that a trajectory formed by only 10 positions was evaluated.
To obtain a more general characterization of the U1 snRNP mobility, we analyzed the distances covered by the U1 snRNPs between subsequent frames, the so-called jump distances (Smith et al., 1999). Figure 5 shows the jump distance distributions for all U1 snRNPs, which were observed within the nucleoplasm in the movies acquired at 100 Hz. Such distributions can be described by Eq. (2), if they are due to particles diffusing with a single diffusion coefficient (see Figure 6 in Kues et al., 2001b). However, the distribution shown in Figure 5 could not at all be fitted assuming a single diffusion coefficient (Eq. 2), in contrast to jump distance distributions of molecules diffusing in buffer solution (Kubitscheck et al., 2000; Grunwald et al., 2006). For the data displayed in Figure 5 the minimum number of three diffusion terms was required for an acceptable fit. The fitting results were indicated by the lines in Figure 5. The major fraction, f1, corresponded to particles, which moved with a variance of (50 nm)2, a value close to the experimental localization precision (see legend of Figure 2). Hence, these particles did not show significant jumps beyond the localization precision and corresponded to those particles, which were identified above and discussed as particles attached to binding sites. Besides the dominating immobile fraction, two mobile fractions, f2 and f3, could be identified, which moved with diffusion coefficients of D2 = 0.51 ± 0.05 μm2/s and D3 = 8.2 ± 3 μm2/s. The area under the curves corresponded to the relative sizes of the three fractions, and yielded 77.5, 15, and 7.3% for f1, f2, and f3, respectively.
Figure 5.

U1 snRNP mobility within the nucleoplasm of living cells. Jump distance distribution for all single U1 snRNPs, which were identified and tracked within the nucleoplasm in the movies acquired at 100 Hz. A minimum number of three diffusion terms was required for an acceptable fit of the data. The largest fraction (long dashes, 77.5%) corresponded to particles, which were immobile. In other words, they performed only a virtual movement caused by the limited localization precision. Here, we obtained a value of σimmob = 50 nm. These jumps were done by those particles, which were above identified as particles involved in a binding process (Figures 2 and 3). Two particle fractions, f2 and f3, corresponded to fast diffusional motion with diffusion coefficients of D2 = 0.51 ± 0.05 μm2/s (short dashes, 15%) and D3 = 8.2 ± 3 μm2/s (dotted line, 7.3%). The sum of these fractions yielded an excellent description of the data (full line). The inset shows the same plot with a magnification of the y-scale in order to demonstrate the significant number of large jumps due to particles moving with D3.
The nucleoplasm corresponded to 90–95% of the observed intranuclear area of the various analyzed cell nuclei. The speckles had limited sizes corresponding to an average diameter of 0.5–1.5 μm, and in sum they covered 5–10% of the available area in a typical nucleus. Because of their limited geometrical extension and irregular shapes, it was very improbable to observe jumps covering distances greater than 0.5 μm within these domains, although they occurred now and then (see Figure 1A). Hence, a quantitative analysis of a jump distance histogram was not reasonable. Above we defined a maximum jump distance for immobile particles as the threefold value of the localization precision, drmax ≈ 100 nm. Therefore the fraction of mobile molecules can be estimated by considering jumps over distance greater than drmax. Within the speckles, we found 17% of all jumps to be greater than drmax, whereas within the nucleoplasm, 24% of all jumps were greater than drmax (see Figure 5). The reduction from 24 to 17% for nucleoplasmic space in comparison to speckles can be attributed to the limited geometric extensions of the speckles. Therefore, at this qualitative level there was no indication of a mobility reduction of U1 snRNPs within speckle domains.
DISCUSSION
In this study we analyzed the dynamics of U1 snRNPs within live cells at the single-particle level. The used particles were isolated from HeLa cell nuclei and then labeled by Cy5. Hence, our experiments refer to native RNPs, avoiding the potential problems of in vitro–assembled particles, which might be incomplete or dysfunctional. We microinjected Cy5-labeled U1 snRNPs at such low concentration into the cytoplasm of living HeLa cells that we could visualize single U1 snRNPs and track their movements within the cell nucleus after their nuclear import. Real-time imaging was achieved by a custom-built single-molecule microscope equipped with laser illumination and a fast EMCCD for fluorescence detection. The examined HeLa cells transiently expressed ASF/SF2-GFP so that the particle dynamics could be studied within and outside nuclear speckles. The SNR of the U1 snRNP signals was in the range of 5–10, so that they could be localized by SPT techniques with a spatial precision of roughly 30 nm. Using automatic image analysis procedures, we extracted the traces of numerous single mobile and immobile U1snRNPs, which could be overlaid to the ASF/SF2-GFP images of the corresponding cell nuclei.
The great majority of observed single U1 snRNPs was in a bound state. Almost 80% of the U1 snRNPs observed in two subsequent image frames did not move significantly. This was in stark contrast to an inert, unfunctional tracer molecule inside cell nuclei (D. Grünwald, R. Martin, V. Buschmann, H. Leonhardt, U. Kubitscheck, and M. C. Cardoso, unpublished data), which showed a much greater mobile fraction. Presumably, the immobilization was caused by interactions with large, immobile molecular structures. Obviously, being associated to large molecular structures is the standard state of a splicing factor such as U1 snRNP. The corresponding binding sites were very well defined, because the particles did not move significantly beyond the experimental localization precision. The bound RNPs were attached at fixed sites, and they did not sway or move slowly during their binding. Such small-range movements could be excluded, because the immobilized single U1 snRNPs showed a positional spreading only 5–10 nm greater than that, which would theoretically follow from their SNR. This insignificant increase was probably due to the intranuclear fluorescence background. We assume that the observed immobilization of the U1 snRNPs was often caused by the involvement of the particles in ongoing splicing events. This assumption was suggested by the fact that in a previous study using digitonin-permeabilized cells, which were largely physiologically inactive, a significantly smaller immobile fraction of U1 snRNPs was found, namely only 22% (Kues et al., 2001a). Pre-mRNA splicing is occurring often cotranscriptionally (Melcak et al., 2000). This means that an extremely large DNA/RNA–protein complex is formed, which would certainly not have a notable mobility, but would rather represent a large, anchored supramolecular complex.
The dissociation from the binding sites showed a surprising kinetics. Obviously the dissociation times were dependent on the time resolution of observation. Analyzing binding at high frequency, we observed short binding durations, whereas when observing binding at low frame rate, we obtained long binding durations. This was consistent with the fact that we obtained two decay times for each time range analyzed. This already indicated that complex interactions were observed. Altogether, dissociation times ranging from 5 ms to 1400 ms were obtained. In case of a simple molecular dissociation reaction one would expect a monoexponential decomposition of initially existing complexes with a single dissociation time constant. Our data showed that the interaction of U1 snRNPs with their intranuclear binding partners was not a simple bimolecular interaction. The dissociation of U1 snRNPs from binding sites occurred over a wide time scale, which reflected the extremely complex way, in which U1 snRNPs were interacting with additional molecular components. Possibly we perceived—besides short nonspecific interactions, molecular trapping in a chromatin network on the one hand and genuine splicing events on the other hand—further processes, such as assembly of spliceosomes before splicing and postsplicing processing (Darzacq et al., 2005). We think that a decay kinetics on many different time scales is a fundamental property of recognition events and reactions of multistep molecular interaction systems (Phair et al., 2004). In the splicing reaction, a large number of different molecular components must act together, which are preassembled in the form of spliceosomes and supraspliceosomes, which comprise U1 snRNPs (Muller et al., 1998; Azubel et al., 2006). In addition, a great number of different splicing reactions—simple and more complex ones—are taking place simultaneously within a cell nucleus. Therefore, a single dissociation constant could actually not be expected.
We quantified the kinetics of dissociation within and outside speckles. Speckles were defined on the basis of ASF/SF2-GFP fluorescence, and distinct spots of strong GFP fluorescence were interpreted as speckles. Unfortunately, our microscope was not an optical sectioning microscope. Nonconfocal videomicroscopy resulted in a rather diffuse appearance of the speckles and made the clear identification of speckle borders difficult. On the basis of the chosen speckle and nucleoplasm definitions, the dissociation kinetics on short and long time scales did not differ significantly for binding within the speckles compared with the remaining nucleoplasm (Figure 3E). This finding supported the results of Kruhlak et al. (2000), who did not detect major differences in the dynamics of ASF/SF2-GFP in nucleoplasm and speckles. It could be concluded that the increase in splicing factor concentration within the speckles was not due to an increased dwell time of U1 snRNPs at intraspeckle sites. There remain two possible explanations for the higher concentrations of splicing factors within speckles. First, the on-rate of the interaction is enhanced, which might be caused by a enhanced accessibility of splicing factors to the speckles in comparison to the remaining nucleoplasm. Second, the density of interaction sites is higher than in the remaining nucleoplasmic space, whereas the interaction is of similar nature. The latter hypothesis is supported by electron microscopic results (Puvion and Puvion-Dutilleul, 1996; Lamond and Spector, 2003). We interpreted a part of the observed binding sites as sites of on-going transcription. Together with the above observation this would suggest that splicing is taking place also in speckles, as was previously found by various researchers (Wei et al., 1999; Melcak et al., 2000; Shopland et al., 2002). However, a clear-cut statement on this question is problematic, because the fluorescence microscopic discrimination between interchromatin granule clusters forming the speckled compartments and highly active transcription sites with increased levels of pre-mRNA splicing factors is problematic (Lamond and Spector, 2003).
Altogether, the reason for the complex immobilization could not yet finally be resolved. However, the large difference in the size of the interacting U1snRNP fraction in live cells compared with digitonin-permeabilized cells (Kues et al., 2001a) underscores the requirement of live cell measurements when studying such intricate physiological processes. Further studies using inhibition of transcription respectively splicing will provide more insight into the functional relevance of immobilization events.
Finally, it should be noted that dissociation data like that shown in Figure 3 are usually available only by a special synchronization of the molecular complexes in the initial, associated state. This often presents a problem, which is very difficult or impossible to solve, especially when working in vivo. Single-molecule detection, however, can elegantly resolve this problem. The accumulation of the data here took advantage of a special feature of single-molecule research: the observation of individual molecular interaction events did not require a synchronization of a molecular ensemble (Weiss, 1999), because the individual events could be aligned in time a posteriori (Kubitscheck et al., 2005).
The presented data created an entirely new view of the molecular dynamics of a functional molecular entity during ongoing live processes. In almost all recent studies on the mobility of functional molecules within cell nuclei binding processes were postulated and accordingly modeled in order to account for mobility data obtained by photobleaching, photoactivation, or FCS techniques (Wachsmuth et al., 2000; Houtsmuller and Vermeulen, 2001; Carrero et al., 2003; Wachsmuth et al., 2003; Phair et al., 2004; Beaudouin et al., 2006). However, often models of anomalous diffusion were also able to explain the data (e.g., Wachsmuth et al., 2000). In this study using single-particle tracking binding events could unambiguously be observed and thus be proven and be discriminated from other modes of motion. We did not only observe distinct binding events, but could also measure the durations of individual interactions. Thereby we found that the kinetics of dissociation cannot be described by a single dissociation constant, but rather ranges over more than three orders of magnitude.
Single-molecule microscopy is especially well suited to follow molecular traces in time (Saxton and Jacobson, 1997). Recently we demonstrated that a frame rate of 350 Hz was sufficient to track single protein molecules such as antibodies and streptavidin molecules in buffer exhibiting diffusion coefficients as high as 40 and 80 μm2/s, respectively. Therefore we could assume that the maximum repetition rate of 200 Hz used in this study was high enough to track the U1 snRNPs with a molecular weight of 240 kDa in real time, especially because a 5- to 10-fold mobility reduction in cells compared with buffer solution could be expected according to previous FRAP studies (Lang et al., 1986; Seksek et al., 1997; Braga et al., 2004). By analyzing the jumps of single U1 snRNPs between subsequent frames, we obtained a general insight into the dynamic behavior of the particles within the cell nuclei. As shown already by previous studies using FCS and SPT the mobility of single molecules within cell nuclei cannot be characterized by simple Brownian motion (Goulian and Simon, 2000; Wachsmuth et al., 2000; Kues et al., 2001b). We could discriminate one immobile and at least two mobile fractions. We want to emphasize here that the dissection of the jump distance distribution into three fractions represented a minimum number. Three fractions were sufficient to fit the data in Figure 5. However, the fit could have been further improved by assuming more than three fractions. For the following discussion of the mobile fractions one should also keep in mind that the fractions do not resemble different particles with distinct mobilities. Rather—as could be noted in the trajectory analyzed in Figure 1C—single particles switched their mode of motion along their trajectory. Hence, the fractions identified in the jump distance histograms represent different modes of motion of possibly identical particles. Altogether, we suppose that distinct mobility fractions do not exist, but rather that the U1 snRNP mobility ranges from 0.5 to 8 μm2/s in a continuous distribution.
In the mobility analysis particles with mobilities ranging from 0.5 to 8 μm2/s were observed. A diffusion coefficient of 8 μm2/s is four- to fivefold lower than that expected for a 240-kDa protein in aqueous solution. A fourfold reduction in mobility was also found in previous mobility studies of tracer molecules within cell nuclei performed by FRAP (Seksek et al., 1997). Therefore, we assume that the high mobility was shown by uncomplexed U1 snRNPs, which moved within nuclei as in a solution with an effective viscosity of 5 cPoise compared with aqueous buffer of 1 cPoise. In vivo all U snRNPs are central components of preformed complexes designated as spliceosomes. It has been shown that these complexes occur in a structure termed supraspliceosome, which contains four native spliceosomes, with a total mass of 21 MDa and dimensions of 50 × 50 × 35 nm3 (Sperling et al., 1997; Muller et al., 1998; Medalia et al., 2002). Such complexes, if moving by unrestricted Brownian motion, would have a diffusion constant of about D = 2 μm2/s in a solution of 5-cPoise viscosity. This value for supraspliceosomes lies in the range of diffusion constants determined for mobile U1 snRNPs. It is very unlikely that large objects like supraspliceosomes would move in an unrestricted manner within the molecular crowded intranuclear space. Rather, they would be prone to multiple collisions or interactions with chromatin or other large structures, which would slow it down. This has been reported for large dextran molecules with a molecular mass of 580 kDa to 2 MDa. Their mobility was dependent on the concentration of intracellular obstacles (Seksek et al., 1997). Furthermore, it has been shown that chromatin regions represent a significant obstruction for the accessibility of large probe molecules (Gorisch et al., 2003). Hence, jumps corresponding to a mobility as low as D = 0.5 μm2/s could well correspond to uncomplexed U1 snRNPs or to U1 snRNPs contained in spliceosomes and supraspliceosomes tumbling in a hindered manner through the nucleoplasm.
The established way to analyze intracellular mobility is by FRAP, which measures bulk mobility on a spatial scale of several micrometers in a time window of a few to 50 s. On the other hand, SPT quantifies mobility of individual molecules on length scales significantly smaller than 1 μm in time windows of milliseconds to seconds. It is not straightforward to extrapolate from the single-molecule data to the results of FRAP measurements. To accomplish this a respective simulation of bulk mobility on the basis of the single-particle data would be required, which has not been done yet. However, we can correlate our results with FRAP results in the following manner. FRAP detected a three- to fivefold reduction in D for larger tracer molecules within the nuclei and a significantly more pronounced reduction for molecules with specific intranuclear interactions (Gorski et al., 2006). Our SPT data also reveal a four- to fivefold reduction in D for mobile, noninteracting, and up to an 70-fold reduction for presumably interacting U1snRNPs. Finally, we obtained a very detailed and quantitative view to the interactions of a U1snRNP with immobilizing binding partners on a subsecond time scale.
Single-molecule microscopy and single-particle tracking permits a completely new view to intracellular dynamics. It shows that splicing factor dynamics inside living cells is extremely complex. U snRNPs move freely, are incorporated into huge supramolecular complexes such as supraspliceosomes, attach to binding sites for extended periods of time, and are released again. Binding and dissociation occurs obviously under widely varying kinetic conditions. A detailed analysis of long single-particle trajectories, use of several fluorescent labels in parallel, and the combination with complementary techniques such as FCS and quantitative photobleaching techniques will provide further insights into complex in vivo processes such as RNA processing.
Supplementary Material
ACKNOWLEDGMENTS
U.K. is heavily indebted to Reiner Peters for using numerous experimental facilities in his lab, and thanks M. Cristina Cardoso for helpful discussions and Jan-Peter Siebrasse for critical reading of the manuscript. U.K. gratefully acknowledges financial support by the Volkswagen Foundation (Grant I/78852) and the German Research Foundation (Grant Ku 975/3-3).
Abbreviations used:
- ASF
alternative splicing factor
- EMCCD
electron multiplying CCD
- FCS
fluorescence correlation spectroscopy
- FRAP
fluorescence recovery after photobleaching
- MSD
mean square displacements
- SPT
single-particle tracking
- snRNA
small nuclear RNA
- MSD
mean square displacements
- U snRNP
uridine-rich small nuclear ribonucleoprotein
Footnotes
This article was published online ahead of print in MBC in Press (http://www.molbiolcell.org/cgi/doi/10.1091/mbc.E06-06-0559) on September 20, 2006.

 The online version of this article contains supplemental material at MBC Online (http://www.molbiolcell.org).
REFERENCES
- Azubel M., Habib N., Sperling R., Sperling J. Native spliceosomes assemble with pre-mRNA to form supraspliceosomes. J. Mol. Biol. 2006;356:955–966. doi: 10.1016/j.jmb.2005.11.078. [DOI] [PubMed] [Google Scholar]
- Babcock H. P., Chen C., Zhuang X. Using single-particle tracking to study nuclear trafficking of viral genes. Biophys. J. 2004;87:2749–2758. doi: 10.1529/biophysj.104.042234. [DOI] [PMC free article] [PubMed] [Google Scholar]
- Bausinger R., von Gersdorff K., Braeckmans K., Ogris M., Wagner E., Brauchle C., Zumbusch A. The transport of nanosized gene carriers unraveled by live-cell imaging. Angew. Chem. Int. Ed. Engl. 2006;45:1568–1572. doi: 10.1002/anie.200503021. [DOI] [PubMed] [Google Scholar]
- Beaudouin J., Mora-Bermudez F., Klee T., Daigle N., Ellenberg J. Dissecting the contribution of diffusion and interactions to the mobility of nuclear proteins. Biophys. J. 2006;90:1878–1894. doi: 10.1529/biophysj.105.071241. [DOI] [PMC free article] [PubMed] [Google Scholar]
- Braga J., Desterro J. M., Carmo-Fonseca M. Intracellular macromolecular mobility measured by fluorescence recovery after photobleaching with confocal laser scanning microscopes. Mol. Biol. Cell. 2004;15:4749–4760. doi: 10.1091/mbc.E04-06-0496. [DOI] [PMC free article] [PubMed] [Google Scholar]
- Brock R., Hink M. A., Jovin T. M. Fluorescence correlation microscopy of cells in the presence of autofluorescence. Biophys. J. 1998;75:2547–2557. doi: 10.1016/S0006-3495(98)77699-4. [DOI] [PMC free article] [PubMed] [Google Scholar]
- Bubulya P. A., Spector D. L. “On the move”ments of nuclear components in living cells. Exp. Cell Res. 2004;296:4–11. doi: 10.1016/j.yexcr.2004.03.018. [DOI] [PubMed] [Google Scholar]
- Carrero G., McDonald D., Crawford E., de Vries G., Hendzel M. Using FRAP and mathematical modeling to determine the in vivo kinetics of nuclear proteins. Methods. 2003;29:14–28. doi: 10.1016/s1046-2023(02)00288-8. [DOI] [PubMed] [Google Scholar]
- Crank J. Oxford: Clarendon Press; 1975. The Mathematics of Diffusion. [Google Scholar]
- Cremer T., Cremer C. Chromosome territories, nuclear architecture and gene regulation in mammalian cells. Nat. Rev. Genet. 2001;2:292–301. doi: 10.1038/35066075. [DOI] [PubMed] [Google Scholar]
- Darzacq X., Singer R. H., Shav-Tal Y. Dynamics of transcription and mRNA export. Curr. Opin. Cell Biol. 2005;17:332–339. doi: 10.1016/j.ceb.2005.04.004. [DOI] [PMC free article] [PubMed] [Google Scholar]
- Gorisch S. M., Richter K., Scheuermann M. O., Herrmann H., Lichter P. Diffusion-limited compartmentalization of mammalian cell nuclei assessed by microinjected macromolecules. Exp. Cell Res. 2003;289:282–294. doi: 10.1016/s0014-4827(03)00265-9. [DOI] [PubMed] [Google Scholar]
- Gorski S., Misteli T. Systems biology in the cell nucleus. J. Cell Sci. 2005;118:4083–4092. doi: 10.1242/jcs.02596. [DOI] [PubMed] [Google Scholar]
- Gorski S. A., Dundr M., Misteli T. The road much traveled: trafficking in the cell nucleus. Curr. Opin. Cell Biol. 2006;18:284–290. doi: 10.1016/j.ceb.2006.03.002. [DOI] [PubMed] [Google Scholar]
- Goulian M., Simon S. M. Tracking single proteins within cells. Biophys. J. 2000;79:2188–2198. doi: 10.1016/S0006-3495(00)76467-8. [DOI] [PMC free article] [PubMed] [Google Scholar]
- Grunwald D., Hoekstra A., Dange T., Buschmann V., Kubitscheck U. Direct observation of single protein molecules in aqueous solution. Chemphyschem. 2006;7:812–815. doi: 10.1002/cphc.200500632. [DOI] [PubMed] [Google Scholar]
- Houtsmuller A. B., Rademakers S., Nigg A. L., Hoogstraten D., Hoeijmakers J. H., Vermeulen W. Action of DNA repair endonuclease ERCC1/XPF in living cells. Science. 1999;284:958–961. doi: 10.1126/science.284.5416.958. [DOI] [PubMed] [Google Scholar]
- Houtsmuller A. B., Vermeulen W. Macromolecular dynamics in living cell nuclei revealed by fluorescence redistribution after photobleaching. Histochem. Cell Biol. 2001;115:13–21. doi: 10.1007/s004180000234. [DOI] [PubMed] [Google Scholar]
- Huber J., Cronshagen U., Kadokura M., Marshallsay C., Wada T., Sekine M., Luhrmann R. Snurportin1, an m3G-cap-specific nuclear import receptor with a novel domain structure. EMBO J. 1998;17:4114–4126. doi: 10.1093/emboj/17.14.4114. [DOI] [PMC free article] [PubMed] [Google Scholar]
- Kleinschmidt A. M., Pederson T. RNA processing and ribonucleoprotein assembly studied in vivo by RNA transfection. Proc. Natl. Acad. Sci. USA. 1990;87:1283–1287. doi: 10.1073/pnas.87.4.1283. [DOI] [PMC free article] [PubMed] [Google Scholar]
- Kruhlak M. J., Lever M. A., Fischle W., Verdin E., Bazett-Jones D. P., Hendzel M. J. Reduced mobility of the alternate splicing factor (ASF) through the nucleoplasm and steady state speckle compartments. J. Cell Biol. 2000;150:41–51. doi: 10.1083/jcb.150.1.41. [DOI] [PMC free article] [PubMed] [Google Scholar]
- Kubitscheck U., Grunwald D., Hoekstra A., Rohleder D., Kues T., Siebrasse J. P., Peters R. Nuclear transport of single molecules: dwell times at the nuclear pore complex. J. Cell Biol. 2005;168:233–243. doi: 10.1083/jcb.200411005. [DOI] [PMC free article] [PubMed] [Google Scholar]
- Kubitscheck U., Kückmann O., Kues T., Peters R. Imaging and tracking of single GFP molecules in solution. Biophys. J. 2000;78:2170–2179. doi: 10.1016/S0006-3495(00)76764-6. [DOI] [PMC free article] [PubMed] [Google Scholar]
- Kues T., Dickmanns A., Lührmann R., Peters R., Kubitscheck U. High intranuclear mobility and dynamic clustering of the splicing factor U1 snRNP observed by single particle tracking. Proc. Natl. Acad. Sci. USA. 2001a;98:12021–12026. doi: 10.1073/pnas.211250098. [DOI] [PMC free article] [PubMed] [Google Scholar]
- Kues T., Peters R., Kubitscheck U. Visualization and tracking of single protein molecules in the cell nucleus. Biophys. J. 2001b;80:2954–2967. doi: 10.1016/S0006-3495(01)76261-3. [DOI] [PMC free article] [PubMed] [Google Scholar]
- Lamond A. I., Spector D. L. Nuclear speckles: a model for nuclear organelles. Nat. Rev. Mol. Cell Biol. 2003;4:605–612. doi: 10.1038/nrm1172. [DOI] [PubMed] [Google Scholar]
- Lang I., Scholz M., Peters R. Molecular mobility and nucleocytoplasmic flux in hepatoma cells. J. Cell Biol. 1986;102:1183–1190. doi: 10.1083/jcb.102.4.1183. [DOI] [PMC free article] [PubMed] [Google Scholar]
- Lukacs G. L., Haggie P., Seksek O., Lechardeur D., Freedman N., Verkman A. S. Size-dependent DNA mobility in cytoplasm and nucleus. J. Biol. Chem. 2000;275:1625–1629. doi: 10.1074/jbc.275.3.1625. [DOI] [PubMed] [Google Scholar]
- Marshallsay C., Luhrmann R. In vitro nuclear import of snRNPs: cytosolic factors mediate m3G-cap dependence of U1 and U2 snRNP transport. EMBO J. 1994;13:222–231. doi: 10.1002/j.1460-2075.1994.tb06252.x. [DOI] [PMC free article] [PubMed] [Google Scholar]
- Medalia O., Typke D., Hegerl R., Angenitzki M., Sperling J., Sperling R. Cryoelectron microscopy and cryoelectron tomography of the nuclear pre-mRNA processing machine. J. Struct. Biol. 2002;138:74–84. doi: 10.1016/s1047-8477(02)00027-8. [DOI] [PubMed] [Google Scholar]
- Melcak I., Cermanova S., Jirsova K., Koberna K., Malinsky J., Raska I. Nuclear pre-mRNA compartmentalization: trafficking of released transcripts to splicing factor reservoirs. Mol. Biol. Cell. 2000;11:497–510. doi: 10.1091/mbc.11.2.497. [DOI] [PMC free article] [PubMed] [Google Scholar]
- Misteli T. Concepts in nuclear architecture. Bioessays. 2005;27:477–487. doi: 10.1002/bies.20226. [DOI] [PubMed] [Google Scholar]
- Moerner W. Optical measurements of single molecules in cells. TRAC-Trends Analyt. Chem. 2003;22:544–548. [Google Scholar]
- Muller S., Wolpensinger B., Angenitzki M., Engel A., Sperling J., Sperling R. A supraspliceosome model for large nuclear ribonucleoprotein particles based on mass determinations by scanning transmission electron microscopy. J. Mol. Biol. 1998;283:383–394. doi: 10.1006/jmbi.1998.2078. [DOI] [PubMed] [Google Scholar]
- Pederson T. The molecular cytology of gene expression: fluorescent RNA as both a stain and tracer in vivo. Eur. J. Histochem. 2004;48:57–64. [PubMed] [Google Scholar]
- Phair R. D., Misteli T. High mobility of proteins in the mammalian cell nucleus. Nature. 2000;404:604–609. doi: 10.1038/35007077. [DOI] [PubMed] [Google Scholar]
- Phair R. D., Scaffidi P., Elbi C., Vecerova J., Dey A., Ozato K., Brown D. T., Hager G., Bustin M., Misteli T. Global nature of dynamic protein-chromatin interactions in vivo: three-dimensional genome scanning and dynamic interaction networks of chromatin proteins. Mol. Cell. Biol. 2004;24:6393–6402. doi: 10.1128/MCB.24.14.6393-6402.2004. [DOI] [PMC free article] [PubMed] [Google Scholar]
- Politz J. C., Browne E. S., Wolf D. E., Pederson T. Intranuclear diffusion and hybridization state of oligonulceotides measured by fluorescence correlation spectroscopy in livings cells. Proc. Natl. Acad. Sci. USA. 1998;95:6043–6048. doi: 10.1073/pnas.95.11.6043. [DOI] [PMC free article] [PubMed] [Google Scholar]
- Politz J. C., Tuft R. A., Prasanth K. V., Baudendistel N., Fogarty K. E., Lifshitz L. M., Langowski J., Spector D. L., Pederson T. Rapid, diffusional shuttling of poly(A) RNA between nuclear speckles and the nucleoplasm. Mol. Biol. Cell. 2006;17:1239–1249. doi: 10.1091/mbc.E05-10-0952. [DOI] [PMC free article] [PubMed] [Google Scholar]
- Puvion E., Puvion-Dutilleul F. Ultrastructure of the nucleus in relation to transcription and splicing: roles of perichromatin fibrils and interchromatin granules. Exp. Cell Res. 1996;229:217–225. doi: 10.1006/excr.1996.0363. [DOI] [PubMed] [Google Scholar]
- Sage D., Neumann F. R., Hediger F., Gasser S. M., Unser M. Automatic tracking of individual fluorescence particles: application to the study of chromosome dynamics. IEEE Trans. Image Process. 2005;14:1372–1383. doi: 10.1109/tip.2005.852787. [DOI] [PubMed] [Google Scholar]
- Sako Y., Yanagida T. Single-molecule visualization in cell biology. Nat. Cell Biol. 2003:Ss1–Ss5. [PubMed] [Google Scholar]
- Saxton M. J., Jacobson K. Single-particle tracking: applications to membrane dynamics. Annu. Rev. Biophys. Biomol. Struct. 1997;26:373–399. doi: 10.1146/annurev.biophys.26.1.373. [DOI] [PubMed] [Google Scholar]
- Schwille P., Haupts U., Maiti S., Webb W. W. Molecular dynamics in living cells observed by fluorescence correlation spectroscopy with one- and two-photon excitation. Biophys. J. 1999;77:2251–2265. doi: 10.1016/S0006-3495(99)77065-7. [DOI] [PMC free article] [PubMed] [Google Scholar]
- Schwille P., Kettling U. Analyzing single protein molecules using optical methods. Curr. Opin. Biotechnol. 2001;12:382–386. doi: 10.1016/s0958-1669(00)00231-7. [DOI] [PubMed] [Google Scholar]
- Seisenberger G., Ried M. U., Endress T., Buning H., Hallek M., Brauchle C. Real-time single-molecule imaging of the infection pathway of an adeno-associated virus. Science. 2001;294:1929–1932. doi: 10.1126/science.1064103. [DOI] [PubMed] [Google Scholar]
- Seksek O., Biwersi J., Verkman A. S. Translational diffusion of macromolecule-sized solutes in cytoplasm and nucleus. J. Cell Biol. 1997;138:131–142. doi: 10.1083/jcb.138.1.131. [DOI] [PMC free article] [PubMed] [Google Scholar]
- Shav-Tal Y., Darzacq X., Shenoy S. M., Fusco D., Janicki S. M., Spector D. L., Singer R. H. Dynamics of single mRNPs in nuclei of living cells. Science. 2004;304:1797–1800. doi: 10.1126/science.1099754. [DOI] [PMC free article] [PubMed] [Google Scholar]
- Shopland L. S., Johnson C. V., Lawrence J. B. Evidence that all SC-35 domains contain mRNAs and that transcripts can be structurally constrained within these domains. J. Struct. Biol. 2002;140:131–139. doi: 10.1016/s1047-8477(02)00507-5. [DOI] [PubMed] [Google Scholar]
- Sleeman J., Lyon C. E., Platani M., Kreivi J. P., Lamond A. I. Dynamic interactions between splicing snRNPs, coiled bodies and nucleoli revealed using snRNP protein fusions to the green fluorescent protein. Exp. Cell Res. 1998;243:290–304. doi: 10.1006/excr.1998.4135. [DOI] [PubMed] [Google Scholar]
- Spann P., Feinerman M., Sperling J., Sperling R. Isolation and visualization of large compact ribonucleoprotein particles of specific nuclear RNAs. Proc. Natl. Acad. Sci. USA. 1989;86:466–470. doi: 10.1073/pnas.86.2.466. [DOI] [PMC free article] [PubMed] [Google Scholar]
- Sperling R., Koster A. J., Melamed-Bessudo C., Rubinstein A., Angenitzki M., Berkovitch-Yellin Z., Sperling J. Three-dimensional image reconstruction of large nuclear RNP (lnRNP) particles by automated electron tomography. J. Mol. Biol. 1997;267:570–583. doi: 10.1006/jmbi.1997.0898. [DOI] [PubMed] [Google Scholar]
- Sperling R., Sperling J., Levine A. D., Spann P., Stark G. R., Kornberg R. D. Abundant nuclear ribonucleoprotein form of CAD RNA. Mol. Cell. Biol. 1985;5:569–575. doi: 10.1128/mcb.5.3.569. [DOI] [PMC free article] [PubMed] [Google Scholar]
- Thompson R. E., Larson D. R., Webb W. W. Precise nanometer localization analysis for individual fluorescent probes. Biophys. J. 2002;82:2775–2783. doi: 10.1016/S0006-3495(02)75618-X. [DOI] [PMC free article] [PubMed] [Google Scholar]
- Tinnefeld P., Sauer M. Branching out of single-molecule fluorescence spectroscopy: challenges for chemistry and influence on biology. Angew. Chem. Int. Ed. Engl. 2005;44:2642–2671. doi: 10.1002/anie.200300647. [DOI] [PubMed] [Google Scholar]
- Vallotton P., Ponti A., Waterman-Storer C. M., Salmon E. D., Danuser G. Recovery, visualization, and analysis of actin and tubulin polymer flow in live cells: A fluorescent speckle microscopy study. Biophys. J. 2003;85:1289–1306. doi: 10.1016/S0006-3495(03)74564-0. [DOI] [PMC free article] [PubMed] [Google Scholar]
- Verkman A. S. Solute and macromolecule diffusion in cellular aqueous compartments. Trends Biochem. Sci. 2002;27:27–33. doi: 10.1016/s0968-0004(01)02003-5. [DOI] [PubMed] [Google Scholar]
- Wachsmuth M., Waldeck W., Langowski J. Anomalous diffusion of fluorescent probes inside living cell nuclei investigated by spatially-resolved fluorescence correlation spectroscopy. J. Mol. Biol. 2000;298:677–689. doi: 10.1006/jmbi.2000.3692. [DOI] [PubMed] [Google Scholar]
- Wachsmuth M., Weidemann T., Muller G., Hoffmann-Rohrer U., Knoch T., Waldeck W., Langowski J. Analyzing intracellular binding and diffusion with continuous fluorescence photobleaching. Biophys. J. 2003;84:3353–3363. doi: 10.1016/S0006-3495(03)70059-9. [DOI] [PMC free article] [PubMed] [Google Scholar]
- Wei X., Somanathan S., Samarabandu J., Berezney R. Three-dimensional visualization of transcription sites and their association with splicing factor-rich nuclear speckles. J. Cell Biol. 1999;146:543–558. doi: 10.1083/jcb.146.3.543. [DOI] [PMC free article] [PubMed] [Google Scholar]
- Weiss S. Fluorescence spectroscopy of single biomolecules. Science. 1999;283:1676–1683. doi: 10.1126/science.283.5408.1676. [DOI] [PubMed] [Google Scholar]
- Will C. L., Luhrmann R. Spliceosomal UsnRNP biogenesis, structure and function. Curr. Opin. Cell Biol. 2001;13:290–301. doi: 10.1016/s0955-0674(00)00211-8. [DOI] [PubMed] [Google Scholar]
Associated Data
This section collects any data citations, data availability statements, or supplementary materials included in this article.