

Abstract
Synaptic plasticity is induced by the influx of calcium ions (Ca2+) through N-methyl-D-aspartate receptors (NMDARs), and the direction and strength of the response depend on the frequency of the synaptic inputs. Recent studies have shown that the direction of synaptic plasticity is also governed by two distinct NMDAR subtypes (NR1/NR2A, NR1/NR2B). How are the different types of regulation (frequency-dependent and receptor-specific) processed simultaneously? To clarify the molecular basis of this dual dependence of synaptic plasticity, we have developed a mathematical model of spatial Ca2+ signaling in a dendritic spine. Our simulations revealed that calmodulin (CaM) activation in the vicinity of NMDARs is strongly affected by the diffusion coefficient of CaM itself, and that this ‘local CaM diffusion system' works as a dual decoder of both the frequency of Ca2+ influxes and their postsynaptic current shapes, generated by two NMDAR subtypes, implying that spatial factors may underlie the complicated regulation scheme of synaptic plasticity.
Keywords: local signaling, molecular diffusion, NMDA receptor subtypes, mathematical model
Introduction
Ca2+ ions play a role in triggering signal transduction pathways that regulate a variety of neurobiological processes including synaptic plasticity, one of the major mechanisms underlying learning and memory. In a neuron, Ca2+ signaling is spatiotemporally regulated both globally, within a cellular compartment such as a dendritic spine, and locally at the site of Ca2+ entry. Thus, the differences between local and global Ca2+ signaling must be elucidated in order to fully understand the spatial regulation of signal transduction cascades.
The frequency of synaptic inputs, and hence the frequency of Ca2+ influxes caused by N-methyl-D-aspartate receptor (NMDAR) activation, is thought to dictate the direction and strength of synaptic plasticity (Dudek and Bear, 1992; Markram et al, 1997; Johnston et al, 2003). It was reported recently, however, that the direction of synaptic plasticity is also governed by NR2A- and NR2B-containing NMDAR subtypes; the induction of long-term potentiation (LTP) is blocked by antagonists of NR2A but not of NR2B, whereas the induction of long-term depression (LTD) is blocked by antagonists of NR2B but not of NR2A (Liu et al, 2004a; Massey et al, 2004). This implies a controversial ‘receptor-specific regulation' of synaptic plasticity (Bliss and Schoepfer, 2004; Rusakov et al, 2004; Wong et al, 2004). How the distinct characteristics of synaptic plasticity (i.e., frequency-dependent and receptor-specific regulation) are realized simultaneously has yet to be elucidated.
With respect to global Ca2+ signaling within an entire dendritic spine, there is a potential problem with receptor-specific regulation. Because Ca2+ diffusion is very rapid, and the volume of a dendritic spine is relatively small (<1 μm3), the Ca2+ concentration should, in effect, become instantaneously uniform within a spine. If so, downstream signals originating from different Ca2+ sources are likely to become entangled. This problem could be avoided if the downstream signaling works specifically in the so-called Ca2+ nano-domain, an area with a relatively high Ca2+ concentration localized near Ca2+ channels (Augustine et al, 2003).
Studies in hippocampal neurons have indicated that molecular regulation in local Ca2+ signaling is associated with changes in synaptic weight. An electrophysiological study using two different exogenous Ca2+ buffers, BAPTA and EGTA, provided circumstantial evidence of local Ca2+ signaling around NMDARs during the induction of LTP (Hoffman et al, 2002). Moreover, a Ca2+ imaging experiment has shown that L-type voltage-sensitive Ca2+ channels do not contribute measurably to increasing Ca2+ levels in spines, but instead to activating calcium/calmodulin (CaM)-dependent kinase II (CaMKII), suggesting the existence of local Ca2+ signaling (Yasuda et al, 2003). Immunohistochemical studies have shown that plasticity-related molecules, such as CaMKII and protein phosphatase 1 (PP1), are localized at the postsynaptic densities (PSDs) just below synaptic membranes (Sheng and Lee, 2000; Winder and Sweatt, 2001; Blackstone and Sheng, 2002; Lisman et al, 2002; Petersen et al, 2003). The significance of local Ca2+ signaling can also be predicted computationally in simulation studies of Ca2+ signaling. When the signaling pathway was modeled as a uniform system, the computed level of CaM activation was low and insufficient to upregulate CaMKII (Bhalla, 2002a, 2002b), probably due to the lack of spatially localized reactions. Despite this evidence of local Ca2+ signaling, its role in the regulation of synaptic plasticity has not yet been clarified.
The diffusion of Ca2+ is so rapid that it is probably difficult to regulate local Ca2+ signaling in small components such as dendritic spines. In this study, we focus on local signaling mediated by CaM instead of Ca2+ itself, because CaM diffuses relatively slowly, and hence allow for flexible control on the signaling. CaM, a Ca2+ effector protein, is a primary transducer that mediates the Ca2+-regulated inductions of synaptic plasticity (Xia and Storm, 2005).
The effects of molecular diffusion must be considered as local regulation, because molecular diffusion should be physically and chemically impeded if proteins accumulate to a high level in a local space. In fact, the abundance of actin filaments and PSD-95 (a scaffolding protein) under synaptic membranes is a remarkable aspect of dendritic spines (Kennedy, 2000; Matus, 2000). Furthermore, the in vivo suppression of molecular diffusion has been reported in neurons and smooth muscle cells (Popov and Poo, 1992; Luby-Phelps et al, 1995); this impedance should contribute to the local molecular regulation of synaptic plasticity.
To examine the contributions of local reactions in the Ca2+ nano-domain and the impeded diffusion of CaM to the regulation of synaptic plasticity, we have constructed a mathematical model of spatial Ca2+ signaling in a dendritic spine, in which Ca2+ flows into the cytoplasm and interacts with diffusing CaM. To clarify the molecular basis of the frequency-dependent and receptor-specific regulation of synaptic plasticity, in particular, we have examined the response of local Ca2+ signaling while taking into account the frequency and postsynaptic current shapes of Ca2+ influxes generated by two NMDAR subtypes (Erreger et al, 2005). First, we show that local Ca2+ signaling is regulated in a different manner from global signaling. Second, we shed light on a significant dependence of local CaM dynamics on CaM diffusion, suggesting that to achieve a sufficient level of local CaM activation, the system requires a moderate CaM diffusion coefficient. Third, we demonstrate that as long as CaM is able to diffuse, local Ca2+ signaling can process different features of synaptic inputs: the frequency and current shapes of Ca2+ influxes. Moderate CaM diffusion enables local Ca2+ signaling to act as a ‘dual decoder' to translate these input features into the correlated level of CaM activity. We also show that these local dynamics are highly robust to various Ca2+-regulating factors, such as the buffering system and excretion by Ca2+ pumps, and hence that the decoding properties are preserved under any conditions. These findings suggest that a ‘local CaM diffusion system' functions as the molecular basis of the complicated regulation scheme of synaptic plasticity.
Results
To simulate local dynamics of Ca2+ signaling, we constructed a model of spatial Ca2+ signaling in a dendritic spine (1 μm3), which included Ca2+ influx through NMDARs, Ca2+ uptake by pumps, leakage through the membrane, buffering by Ca2+-binding proteins, and CaM activation (Figure 1A; for details, see Materials and methods and Supplementary Figure 1). To pay attention to the locality of Ca2+ signaling, we assumed radial diffusion from a Ca2+ source consisting of a cluster of NMDARs.
Figure 1.

A scheme of a model spine and a local Ca2+ profile. (A) The model spine is composed of hemispherical elements and has a volume of 1 μm3. Ca2+ ions were injected through NMDARs as a point source located at the center of the spine (red arrow). Diffusing molecules were assumed to diffuse radially from the NMDARs. Ca2+ influx, Ca2+ uptake by pumps, leakage from the membrane, and buffering by Ca2+-binding proteins were all incorporated into the model. To compare local and global signaling, we focused on the concentrations of Ca2+ and CaM in the local and global areas as indicators of the degree of signaling activity at the PSD and in the whole spine, respectively. (B) The spatiotemporal Ca2+ profile when a sequence of 10 Ca2+ influxes was injected at 50 Hz (upper panel) into the model. Each injected current was biologically realistic (amplitude=9 pA, Ca2+ fraction=11%, period=10 ms) (Pina-Crespo and Gibb, 2002; Nimchinsky et al, 2004). The horizontal axis denotes the elapsed time from the onset of current injection, and the vertical axis denotes the distance from the site of the NMDARs (lower panel).
The difference between local and global Ca2+ signaling
To examine the characteristic difference between local and global Ca2+ signaling, we first investigated the spatiotemporal details of Ca2+ and CaM responding to Ca2+ influxes injected through NMDARs. When Ca2+ influxes were applied to the model spine, a high Ca2+ concentration (>90 μM) was localized at the Ca2+ nano-domain, which is within 50 nm of the influx source (≈scale of PSDs) (Figure 1B), and its transient time course formed rectangular shapes (Figure 2A, upper panel), reflecting the shapes of the influx time course (Figure 1B, upper panel) (Supplementary Figure 2 shows the case when triangular-shaped currents were applied). Such transient responses of Ca2+ in the local area are considered to occur owing to the rapid formation of a Ca2+ steady gradient resulting from fast Ca2+ diffusion. In contrast to these local Ca2+ dynamics, the global Ca2+ response was rather slow and cumulative (Figure 2A, lower panel). The cumulative effect of Ca2+ depended on the distance from the NMDARs (Figure 2B), as has been suggested by a modeling study of a presynaptic system for the facilitation of vesicle release (Tang et al, 2000).
Figure 2.

The details of local and global Ca2+ signaling. (A) The time courses of Ca2+ in the local area (25–50 nm away from the NMDARs, upper panel) and in the global area (>350 nm from the NMDARs, lower panel). These curves were extracted from Figure 1B. (B) Accumulation effect of Ca2+ response, dependent on the distance from NMDARs. Peak Ca2+ responses are plotted against the number of input pulses in a burst stimulus (10 pulses) so that each Ca2+ peak value at the onset is normalized at 1. (C) The time courses of CaM activation in the local (upper panel) and global (lower panel) areas, induced by Ca2+ influxes. (D) Temporal changes of Ca2+ (upper panel) and CaM (lower panel) activities are plotted against the distance from NMDARs. Red, black, blue, and green lines indicate the time of 0, 1, 10, and 60 ms, respectively, elapsed after Ca2+ stimulation was finished at 190 ms.
Responding to such Ca2+ profiles, CaM was highly activated in the local area, but only weakly activated in the global area (Figure 2C). This high CaM activity in the local area was sufficient to upregulate CaMKII, a CaM effector protein (Supplementary Figure 3). A particularly important aspect of local CaM activation is the accumulation of input stimuli, which is not realized by the local Ca2+ concentration. The slower diffusion of CaM than of Ca2+ (Figure 2D) induces the accumulation of activated CaM in the local area. In contrast, the obtained global CaM activity was small, less than 0.75 μM, which was insufficient to upregulate CaMKII (Supplementary Figure 3). This activation was due to diffusion of activated CaM from the local area, and actually CaM was not activated in the global area when the CaM diffusion was blocked (Supplementary Figure 4). These observations suggest that the regulation of Ca2+ signaling should be treated as a spatial system, rather than as a uniform system, which ignores spatial factors, even in a tiny spine.
The behavior of simulated global Ca2+ is consistent with biological data. In our simulation, peak concentration was around 1 μM and decay time constant was around 23.5 ms (Figure 2A, lower panel). Comparable values were measured by Ca2+ imaging studies in dendritic spines (Murthy et al, 2000; Holthoff et al, 2002; Sabatini et al, 2002) (see the comparison of Ca2+ decay behavior with experimental data in Supplementary Figure 5). If a Ca2+ indicator (Fluo-4, 200 μM) was added to the model spine in a simulation experiment, peak Ca2+ decreased and the decay of global Ca2+ concentration became slower (Supplementary Figure 6). To show the adequacy of the model behaviors from a different perspective, we reproduced the experimentally observed effects of exogenous Ca2+ buffers, BAPTA and EGTA, on local and global Ca2+ signaling (Supplementary Figure 7) (Hoffman et al, 2002). Moreover, we checked the robustness of local and global Ca2+ signaling against variation in buffering systems, excretion by Ca2+ pumps, and spine morphology such as size and geometry. To summarize the results, global Ca2+ signaling was sensitive to most of those factors, but local Ca2+ signaling was highly robust (Supplementary Figures 8–12).
The effects of molecular diffusion on local Ca2+ signaling
Local diffusion of CaM may be impeded not only chemically by interaction with CaM effectors, but also physically by the cytoskeleton and scaffolding proteins, because PSDs in dendritic spines contain an abundance of proteins. Indeed, it was found that the diffusion coefficient of receptors moving two-dimensionally on the plasma membrane decreases exponentially as scaffolding proteins accumulate (Nakada et al, 2003). To examine the effects of this restricted molecular diffusion on local Ca2+ signaling, we investigated CaM activation in the Ca2+ nano-domain using various diffusion coefficients for CaM. CaM activation resulting from the high Ca2+ level in the local area depended strongly on the diffusion coefficient of CaM (Figure 3B). When the CaM diffusion coefficient estimated in vitro (Yang et al, 2001) was used, CaM activity was close to zero, as observed in previous simulation studies based on a uniform system (Bhalla, 2002a, 2002b), whereas nondiffusible CaM resulted in CaM activation that exceeded the level required for 100% CaMKII autophosphorylation (Figure 3A and B and Supplementary Figure 3). When the diffusion coefficient of CaM was set to the value observed in vivo (Luby-Phelps et al, 1995), the level of CaM activation in the local area lay within the controllable range for CaMKII autophosphorylation (green line in Figure 3A and B). Local CaM activation was thus found to relate inversely to the diffusion coefficient of CaM (Figure 3C). These results suggest that CaM must diffuse at a moderate rate, as has been observed in vivo, to be activated and controlled in the local area. Moreover, these results imply that the cytoskeleton may regulate local signal transduction by influencing molecular diffusion in the area.
Figure 3.

The dependence of local CaM activation on CaM diffusion. (A) Estimated autophosphorylation percent of CaMKII responding to the concentration of CaM-4Ca2+ in the condition where the endogenous factor PP1 dephosphorylates CaMKII (Winder and Sweatt, 2001). Using experimentally measured parameters in the Hill's equation for the autophosphorylation of CaMKII against Ca2+ in vitro (Bradshaw et al, 2003), we depicted the relationship of CaMKII activity with CaM-4Ca2+ to indicate a rough criterion for how much CaM activity is required for transducing signals to CaM effector proteins. The estimation method is detailed in Supplementary Figure 3. The approximate concentration range in which active CaM (CaM-4Ca2+) can control CaMKII autophosphorylation (0–100%) is depicted in light blue color. Note that this outcome is not very sensitive to the affinity change of CaM for Ca2+ (see Supplementary Figure 3). (B) The time course of CaM-4Ca2+ formation in the local area (25–50 nm away from the NMDARs). The diffusion coefficients of CaM were 0 (blue), 60 (red), and 0.25 μm2/s (green), representing nondiffusible CaM, diffusible CaM as estimated in vitro (Yang et al, 2001), and diffusible CaM as measured in vivo (Luby-Phelps et al, 1995), respectively. Ca2+ inputs were the same as in Figure 1B. (C) The dependence of the peak concentration of local CaM-4Ca2+ on the diffusion coefficients of CaM.
A local CaM diffusion system as a dual decoder
The dependence of Ca2+ signaling dynamics on frequency and current shapes of Ca2+ influxes was examined. First, three kinds of Ca2+ bursting influxes were applied to the model spine (Figure 4A). To see solely the effect of frequency here, each burst contained the same number of Ca2+ influxes and hence the same quantity of Ca2+ ions. As shown in Figure 2A and B, there was no cumulative effect in local Ca2+ (Figure 4C), whereas both global Ca2+ and local active CaM accumulated depending on the frequency (Figure 4B and D). Next, the shape of Ca2+ influxes is another important characteristic because it is known that current shape depends on the two main subtypes of NMDARs, NR2A- and NR2B-containing NMDA receptors; the current produced by NR2A-containing NMDARs has a higher amplitude and a shorter duration than that produced by NR2B-containing receptors (Erreger et al, 2005). To investigate the effect of current shape on Ca2+ signaling, we prepared three current shapes including the same quantity of Ca2+ (Figure 4E). Different current shapes induced different peak values of Ca2+ concentration (Figure 4G) and CaM activation (Figure 4H) in the local area, but the difference was not very prominent for global Ca2+ (Figure 4F).
Figure 4.

The time course of Ca2+ signaling in response to various frequencies and current shapes of Ca2+ influxes. (A) Three frequency patterns of Ca2+ influxes. Each injected current was the same as shown in Figure 1B. (B–D) The responses of global Ca2+ (B), local Ca2+ (C), and local CaM (D) to the three frequencies of Ca2+ influxes: blue: 20 Hz; black: 50 Hz; and red: 80 Hz. (E) Three current shapes of Ca2+ influx, which was applied at a fixed frequency of 50 Hz. The total quantity of Ca2+ ions in each current was set constant. (F–H) The responses of global Ca2+ (F), local Ca2+ (G), and local CaM (H) to the Ca2+ influxes, which each contains one of three different current shapes: blue: wide; black: medium; and red: narrow.
In the induction of synaptic plasticity, the direction and strength depend on the frequency of Ca2+ influxes (Dudek and Bear, 1992; Markram et al, 1997; Johnston et al, 2003) and NMDAR subtypes (Liu et al, 2004a; Massey et al, 2004). This frequency-dependent and receptor-specific regulation is evidence that Ca2+ signaling simultaneously transfers both the frequency and influx rate signals to downstream cascades (‘dual decoder') in levels of Ca2+, CaM, or CaM effectors. We propose that such a dual regulation can be explained by integrating the results of Figure 4. To examine if responses of Ca2+ and CaM in local and global area correlated with the frequency and influx rate signals, peak responses of Ca2+ signaling to these two input features are summarized in Figure 5. Here, for simple representation of the influx rate, the shape of a rectangular current was characterized by the amplitude and time width for a fixed total quantity of Ca2+ ions.
Figure 5.

The ability of Ca2+ and CaM to decode the frequency and the influx rate of Ca2+ influxes. (A, B) Decoding by Ca2+ (A) and CaM (B) of the frequency of Ca2+ influxes. (C, D) Decoding by Ca2+ (C) and CaM (D) of the influx rate of the Ca2+ influxes. The horizontal axis denotes the amplitude of the rectangular current. The influx rate is characterized as the current amplitude. The duration of the current varied inversely with the amplitude of the current to keep the total quantity of Ca2+ ions. (A, C) Peak plots of the Ca2+ concentration in the local area (left panel) and in the global area (>350 nm from the NMDARs) (right panel). (B, D) Peak plots of the CaM-4Ca2+ concentration in the local area for the nondiffusible CaM model (left panel) and the diffusible CaM model using the CaM diffusion coefficient observed in vivo (Luby-Phelps et al, 1995) (right panel). Red lines indicate the cases in which the affinity dependence of CaM for Ca2+ on CaM effector proteins was considered, as shown in (F). (E) A summary of the decoding abilities of Ca2+ and CaM. If the peak response correlated linearly with the frequency or the influx rate, decoding is regarded as success (an open circle), otherwise, as failure (a filled circle). Correspondence to subfigures is also shown; for example, ‘A, left' means this decoding success can be observed in the left panel of subfigure (A). (F) Dose–response curve of CaM for Ca2+. This curve is derived from kinetic parameters of CaM using CaM4Ca=CaMtotal K1K2K3K4 Ca4/(1+K1 Ca1+K1K2 Ca2+K1K2K3 Ca3+K1K2K3K4 Ca4), Ki=Kfi/Kbi (i=1–4). Black and red lines indicate the cases without and with the kinetic parameter values of backward reaction in the third and fourth binding of Ca2+ being one-tenth; the red-colored condition represents the increase in the affinity of CaM for Ca2+ due to the interaction with CaM effector proteins.
The Ca2+ level in the global area depended on the frequency of Ca2+ influxes, but not significantly on the influx rate (Figure 5A and C, left panels), suggesting that the dual decoder does not work in global Ca2+ signaling. In contrast, the local Ca2+ level was proportional to the influx rate but independent of the frequency (Figure 5A and C, right panels). For local CaM activation, the frequency of the influxes and the influx rate were directly proportional to the amount of activated CaM (CaM-4Ca2+) when the CaM diffusion coefficient measured in vivo was used (Figure 5B and D, right panels), but not when CaM was prevented from diffusing (Figure 5B and D, left panels) (the time course of nondiffusible CaM activity is shown in Supplementary Figure 13). Thus, this local CaM diffusion system is necessary for Ca2+ signaling to be able to dual-decode the frequency of influxes and the shape of currents (Figure 5E). In particular, the ability to detect the influx rate (current shape) may be the basis of receptor-specific regulation of synaptic signal transduction.
One or two Ca2+-bound CaM molecules interact with CaM effector proteins such as CaMKII and adenylate cyclase, and the interactions increase the affinity of CaM for Ca2+ by reducing the dissociating reaction rate rather than by increasing the binding reaction rate (Johnson et al, 1996). When we introduced an increased affinity, by employing a one-tenth value for the kinetic parameter, to the backward reaction in the third and fourth binding of Ca2+ (Figure 5F), little effect was found on the local CaM activity (red lines in Figure 5B and D, right panels), whereas global CaM activation was facilitated as expected (Supplementary Figure 14). This result implies that dual decoding is not influenced by CaM affinity. Moreover, the dual decoding was found to be robust against variations in the buffering, excretion system, spine morphology, and current shapes of injected Ca2+ influxes (see Supplementary Figures 15–19).
Synaptic plasticity induced by local CaM activity
The dependence of CaM activation on the frequency and current shapes of Ca2+ influxes is comprehensively evaluated in Figure 6A. For the bridge between CaM activation (Figure 6A) and the expression of LTP and LTD (represented by the plasticity factor), we assumed that the plasticity factor is defined by a U-shaped function of the CaM-4Ca2+ concentration (Figure 6B).
Figure 6.

Reproduction of frequency- and NMDAR subtype-based regulation of synaptic plasticity. (A) The peak concentrations of CaM-4Ca2+ in the local area, computed after 100 identical Ca2+ influxes were applied to the model spine, are displayed. The frequency (horizontal axis) and the influx rate (vertical axis) of the Ca2+ influxes were varied in each trial. (B) Synaptic plasticity was modeled by a U-shaped function of the CaM-4Ca2+ concentration. The plasticity factor is expressed as positive and negative values for LTP and LTD, respectively. The boundary between LTD and LTP was set at 30 μM CaM-4Ca2+, which corresponds to the concentration necessary for around 65% CaMKII activity at equilibrium (see Figure 3A). (C) The resultant synaptic plasticity computed from the peak CaM-4Ca2+ concentration (A) using the U-shaped function (B). The meaning of labels (i–iv) is explained in the text. (D) An illustration of the regulation of synaptic plasticity by the subtypes of NMDARs. The labels (i–iv) correspond to those in (C). (E) The dependence of synaptic plasticity on the frequency of Ca2+ influxes for two influx rate values, corresponding to NR2A- and NR2B-containing receptors. These data are extracted from (C). The blue and red curves are schematic, each roughly interpolating the circles. (F) The relationship between synaptic plasticity and the global Ca2+ level in the model spine. The horizontal and vertical axes denote the peak of global Ca2+ concentration and the plasticity factor, respectively. These data are also extracted from (C), with a variety of frequencies (5, 10, 20, 30, 40, and 50 Hz) and influx rates (11–15 pA). As in (E), the black curve shows schematic interpolation. Note that the plasticity factor is obtained by applying the U-shaped function (B) to the local CaM-4Ca2+ concentration (A), not to the global Ca2+ concentration.
The U-shaped function was mathematically derived from the network structure of downstream cascade (CaMKII/calcineurin-PP1 system) (D'Alcantara et al, 2003), based on the idea that the change in synaptic weight regulated by phosphorylation of AMPA receptors is determined by a balance between kinase (CaMKII) and phosphatase (calcineurin, PP1) activities (Lisman, 1989). In great deals of signaling cascades involving the regulation of synaptic plasticity, CaM behaves as a hub and is believed to integrate Ca2+ signals (Xia and Storm, 2005). Then, it is reasonable to evaluate synaptic plasticity outcomes with respect to CaM activity.
Applying this U-shaped function to the calculated levels of activated CaM obtained from burst stimulations with variable frequencies and influx rates resulted in two-dimensional synaptic plasticity as shown in Figure 6C. The parameter space can be divided into four regions: (i) the stimulations induced LTP, (iii) the stimulations induced LTD, and (ii) and (iv) no plasticity was induced.
We propose here that our model can explain the NMDAR subtype-specific regulation of synaptic plasticity (Liu et al, 2004a; Massey et al, 2004) (Figure 6C and D). Under control conditions, high-frequency stimulation (HFS) causes both subtypes of NMDARs to respond in this spine, leading to plasticity factor values in regions (i) and (ii), whose combination results in LTP. If the NR2A subtypes are blocked, only region (ii) remains and no plasticity is induced. If the NR2B subtypes are blocked, only region (i) remains and LTP is induced. On the other hand, low-frequency stimulation (LFS) results in plasticity factor values in regions (iii) and (iv) thereby inducing LTD. If the NR2B subtypes are blocked, region (iii) disappears and no plasticity is generated. Conversely, if the NR2A subtypes are blocked, only region (iv) disappears and LTD is induced.
In addition, our model reproduced the dependence of synaptic plasticity on the frequency of synaptic inputs being U-shaped (Figure 6C) (Dudek and Bear, 1992; Johnston et al, 2003). Furthermore, consistent with the observation that during neuronal development, the NR2A/NR2B ratio in NMDARs increases (Liu et al, 2004b) and LTP gradually becomes dominant over LTD (Puyal et al, 2003), we found that LTP became dominant when a high influx rate was applied to the model (Figure 6E). We also found a U-shaped relationship between the global Ca2+ concentration and synaptic plasticity (Figure 6F). This reminds us of the conventionally discussed relationship between plasticity and the spatially averaged Ca2+ level, which has been observed in Ca2+ imaging studies (Hansel et al, 1997; Cormier et al, 2001; Johnston et al, 2003). It should be noted here that the plasticity factor in our model was determined by local CaM activity and not by global Ca2+ levels (Figure 6B).
Discussion
The connections between spatial factors in signal transduction and specific biological functions have not been sufficiently investigated. We have shown the significance of spatial factors, such as local reactions within the Ca2+ nano-domain and the diffusion of Ca2+ effector proteins, to the Ca2+ signaling required for synaptic plasticity.
Ca2+ nano-domain (>90 μM, <50 nm) appeared during the application of Ca2+ influxes (Figure 1B). This high Ca2+ concentration activated CaM excessively because of inherent strong affinity of CaM for Ca2+ when CaM could not diffuse (Figure 3B). Such excessive CaM activation was, however, prevented by diffusion of CaM itself, as shown in Figure 3B and C. As long as CaM diffuses at a moderate rate as in vivo, local CaM activity remains in an appropriate range, which is useful to control downstream signaling (Figure 3A). This ‘local CaM diffusion system' functions as a ‘dual decoder' of both the frequency of Ca2+ influxes and the current shapes generated by two distinct NMDA receptor subtypes (Erreger et al, 2005) (Figure 5B and D, right panels). Frequency decoding is realized by CaM diffusion transferring transient frequency-independent Ca2+ responses into accumulated responses of CaM, whereas influx rate decoding is realized by means of Ca2+ levels before the signals are transduced into the CaM activity. The dual decoding in local Ca2+ signaling is strongly robust, regardless of how global Ca2+ behaves.
Previous studies proposed that CaMKII detects the stimulation frequency by becoming autophosphorylated, thereby translating the frequency level into the strength of LTP. CaMKII was observed to act as a frequency decoder of Ca2+ stimulation in vitro and in vivo (De Koninck and Schulman, 1998; Eshete and Fields, 2001). On the other hand, a biochemical study revealed that the phosphorylation state of CaMKII at equilibrium depends on the Ca2+ concentration (Bradshaw et al, 2003), hence on CaM activity (Figure 3A). In our simulation, the phosphorylation level of CaMKII was in effective determined by the peak concentration of active CaM, because the local concentration of active CaM was rapidly increased and saturated as Ca2+ stimulation and the saturated level depended on the frequency and the influx rate of Ca2+ stimulation. This is the reason why we evaluated the decoder's ability in relation to the peak response of active CaM, but not to its temporal integration. Therefore, our results indicate that the local CaM diffusion system, rather than CaMKII, plays the main role in decoding the information of synaptic stimulation (Figure 5).
The dual decoding by the local CaM diffusion system provides a mechanism for both the frequency-dependent and NMDAR subtype-specific regulation of synaptic plasticity (Figure 6C); our model of local Ca2+ signaling with constrained molecular diffusion successfully realized the receptor-specific regulation, which could not be accomplished by global Ca2+ signaling. Moreover, our model reproduced the observed developmental shift from LTD to LTP (Figure 6E).
We also found that the relationship between the global Ca2+ concentration and the synaptic plasticity induced by local CaM activity was U-shaped (Figure 6F). Currently, it is thought that synaptic plasticity is simply determined by the Ca2+ concentration in a U-shaped fashion (Hansel et al, 1997; Yang et al, 1999; Cormier et al, 2001; Johnston et al, 2003); high and moderate Ca2+ concentrations induce LTP and LTD, respectively. In this simplified scheme, however, the Ca2+ concentration is averaged over the entire spine, and hence does not reflect local Ca2+ signaling. On the other hand, recent experimental studies showed that local Ca2+ signaling around Ca2+ channels regulates the induction of LTP (Hoffman et al, 2002; Yasuda et al, 2003), suggesting that synaptic plasticity cannot be explained simply by the averaged Ca2+ concentration, and that local Ca2+ signaling must be taken into account. We, therefore, speculate that the conventional ‘global Ca2+ hypothesis' is too macroscopic to allow us to understand the complicated regulation scheme of synaptic plasticity.
Local CaM activation was found to be strongly affected by the diffusion coefficient of CaM itself (Figure 3C). CaM diffusion may be regulated by cytoskeletal structures such as actin filaments. The polymerization of actin is affected by synaptic stimulation; HFS facilitates actin polymerization, whereas LFS facilitates actin depolymerization (Okamoto et al, 2004), suggesting that HFS or LFS would suppress or facilitate CaM diffusion, respectively. These observations suggest that synaptic plasticity also depends on the temporal change in the CaM diffusion coefficient caused by previous synaptic stimulations. When an LFS occurs, the induced actin depolymerization facilitates CaM diffusion, making it more difficult to activate CaM and induce LTP. After an HFS, in contrast, it becomes easier to induce LTP. These predictions are consistent with ‘meta-plasticity', an observed experimental phenomenon in which the LTP resulting from an HFS was decreased if the stimulation followed a previously applied LFS that did not induce LTD (Fujii et al, 1991; O'Dell and Kandel, 1994; Mockett et al, 2002).
Although local Ca2+ dynamics have been investigated in other computational studies (Holmes and Levy, 1990; Zador et al, 1990; Naraghi and Neher, 1997; Markram et al, 1998; Tang et al, 2000; Franks et al, 2001), those studies did not discuss local CaM activation involving own diffusion and its responses to various characteristics of Ca2+ stimulations. A couple of studies modeled spatial Ca2+ signaling associated with LTP by introducing cylindrical morphology to a spine head (Holmes and Levy, 1990; Zador et al, 1990). This cylindrical approximation assumed that diffusion occurs only in the direction perpendicular to the membrane but not in the direction parallel to the membrane, which makes the discussion on the locality of Ca2+ signaling difficult. Another computational study has exhibited the frequency dependence of CaM response in an entire spine, which originates from the frequency dependence of global Ca2+ (Franks et al, 2001). However, local CaM activation and the diffusion process of CaM were not addressed in that study. Our spatial model showed consistently that the global Ca2+ response is frequency-dependent (Figure 5A, left panel).
Ca2+ micro-domains (<1 μm) were directly identified in GABAergic interneurons even in the absence of special structures such as dendritic spines (Goldberg et al, 2003). In our study, we also showed the existence of a Ca2+ nano-domain (<50 nm), whose scale is comparable to that of PSD and much less than that of a dendritic spine (Figure 1B). Although these two kinds of local Ca2+ compartmentalizations have different scales, they may share a common molecular mechanism actualized by Ca2+ influx, buffering, and fast Ca2+ extrusion.
The issue of stochasticity of signal transduction in a dendritic spine is important because the number of signaling molecules in such a small region is often small. Stochastic properties of signal transduction pathways with positive-feedback loops, such as CaMKII autophosphorylation, are quite different from deterministic processes at the level of single spines (Hayer and Bhalla, 2005; Miller et al, 2005). However, experimental measurements of synaptic plasticity (i.e., EPSP) are spatial averages over a large number of synapses, and, moreover, they should be averaged temporally (i.e., trial average) when the direction or strength of plasticity is evaluated. Therefore, we expect that deterministic simulation is valid for assessing the spatiotemporally averaged response of a local CaM diffusion system, which does not involve a positive-feedback loop.
Ca2+ ions act as secondary messengers to transmit extracellular signals to intracellular proteins during a variety of cellular functions. The properties of local reactions (the biochemical processes) and molecular diffusion (the physical processes) can be extended to other molecular systems, such as axon guidance by growth cones controlled by Ca2+ signaling (Nishiyama et al, 2003), to gain an overall understanding of the subcellular biology.
Materials and methods
Geometry of model spine and diffusion processes
For simulating radial diffusion, the model spine (1 μm3) was divided into 15 elements of hemispherical shells with a thickness of 25 nm (from the 1st to the 14th shells) or 781.6 nm (the 15th shell) (Figure 1A and Supplementary Figure 1). Molecular diffusion from one shell to adjacent shells was introduced according to the difference between the concentrations in the shells:
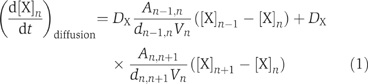
where [X]n denotes the concentration of diffusible molecules (Ca2+, CaM, and mobile calcium-binding protein (CBP)) in the nth shell, DX is the diffusion coefficient, An−1,n is the surface area between the (n−1)th and the nth shells, dn−1,n is the distance between the shells' midpoints, and Vn is the volume of the nth shell. Molecular concentrations in each shell were assumed to be uniform. Diffusion of Ca2+ between a spine and a dendritic shaft was not considered, because spines are thought to be isolated compartments of signaling (Svoboda et al, 1996; Helmchen, 2002; Sabatini et al, 2002). We also confirmed that the diffusive exchange between the spine and the dendritic shaft does not significantly affect Ca2+ signaling in a spine (Supplementary Figure 20).
In this study, we used hemispherical approximation for spine head to simulate local Ca2+ signaling, in contrast to conventional cylindrical approximation (Holmes and Levy, 1990; Zador et al, 1990). Compared with the cylindrical approximation, our model pays more attention to locality of Ca2+ signaling around a localized cluster of NMDARs: NR2A-containing NMDA receptors are localized specifically in synaptic clefts, whereas those containing NR2B tend to be localized far from the release sites of presynaptic vesicles (Collingridge et al, 2004; Liu et al, 2004b).
Ca2+ regulation
Ca2+ ions were injected through a number of NMDARs as a point source located at the center of the first shell (Figure 1A and Supplementary Figure 1). Ca2+ influx was given as a rectangular shape (Figure 1B, upper panel) and the concentration change was defined by
![]()
where γ denotes the fraction of current I carried by Ca2+ through the NMDARs and F is the Faraday's constant. Because the estimated number of NMDARs opened in a single spine by a synaptic spike is three (Nimchinsky et al, 2004) and the current through a single channel was measured at 3 pA (Pina-Crespo and Gibb, 2002), I was set at 9 pA (10 ms), except when examining the effect of Ca2+ influx rate on local Ca2+ signaling (Figures 4, 5 and 6).
Extrusion of Ca2+ from the spine was modeled by three types of Ca2+ pumps (SERCA, Na+/Ca2+ exchanger, and PMCA) situated only at the outermost (15th) shell (Figure 1A and Supplementary Figure 1). The Ca2+ extrusion process was described by Hill's equation:
![]()
where νmax is the maximal velocity of Ca2+ clearance, Km is the half-maximal concentration of Ca2+ for each pump, and h is the Hill coefficient. Leak Ca2+ flow was also added into the outermost shell with the leak constants Lextracell and LER (Figure 1A and Supplementary Figure 1):
where [Ca2+]extracell and [Ca2+]ER are Ca2+ concentrations outside the model spine and in the endoplasmic reticulum, respectively.
For Ca2+ buffering, we distributed five kinds of Ca2+-binding proteins uniformly into the model spine: four kinds of immobile, and one mobile, CBPs. The kinetic parameters of immobile CBPs (fast CBP, medium CBP, slow CBP, and very-slow CBP) followed the previous models (Markram et al, 1998; Franks et al, 2001). Mobile CBPs, which are likely to contribute to Ca2+ dynamics, are diffusible and their diffusion coefficients are independent of Ca2+ binding in the model. Binding of Ca2+ ions to CBPs was modeled by the association and dissociation reactions:
![]()
where kf and kb are the association and dissociation rates, respectively.
Calmodulin regulation
CaM has four binding sites for Ca2+ ions (two sites in each of the C- and N-terminal domains) and its transducer function was assumed to emerge when all four sites are occupied (CaM-4Ca2+). Each Ca2+ binding step in this fourth-order reaction was calculated by
where [CaM·zCa2+]n denotes the concentration of CaM bound by zCa2+ ions, and kf,z and kb,z are the association and dissociation rates in the zth step reaction (z=0, 1, 2, 3, 4). Note that the association rate of N-terminal domains used in the model was one-tenth that measured in vitro (Luby-Phelps et al, 1995), because Ca2+ binding is interfered owing to the interaction of CaM with Mg2+ and K+ ions, and the effective rates then decrease (Linse et al, 1991; Malmendal et al, 1999). The concentration of CaM was set at 200 μM in the model spine. For the diffusion coefficient of CaM, we used the value previously measured in smooth muscle cells (Luby-Phelps et al, 1995), except when examining model behaviors against various values of the diffusion coefficient (Figure 3C). The diffusion coefficient of CaM was assumed to be independent of Ca2+ binding.
In this biochemical model, we did not distinguish the kinetic parameters of Ca2+ binding with CaM free or trapped by CaM effector proteins. The rate constants were adopted from an in vitro experimental report; to use these experimentally measured values, which should be a mixture of the rate constants of free and trapped CaM, implicitly incorporates the effect of interaction between CaM and CaM effector proteins (Johnson et al, 1996). Furthermore, in the diffusion process, we did not model differential diffusions between free CaM and trapped CaM, and we adopted the diffusion coefficient measured in vivo (Luby-Phelps et al, 1995); this experimental value should also include the effect of interaction between CaM and CaM effector proteins. Therefore, recruitment of the reaction rate constants and diffusion coefficient measured in vivo represents the average dynamics of signaling mediated by free CaM and trapped CaM.
All parameters used in the control condition of our model are listed with their values in Supplementary Table 1. Simulations were performed using MATLAB (The Mathworks Inc., MA).
Supplementary Material
Supplementary Information
Acknowledgments
We thank Dai Keyakidani for valuable discussion. This work was supported by the 21st Century COE Program and Special Coordination Funds Promoting Science and Technology both from the MEXT (Ministry of Education, Culture, Sports, Science, and Technology), Japan.
References
- Augustine GJ, Santamaria F, Tanaka K (2003) Local calcium signaling in neurons. Neuron 40: 331–346 [DOI] [PubMed] [Google Scholar]
- Bhalla US (2002a) Biochemical signaling networks decode temporal patterns of synaptic input. J Comput Neurosci 13: 49–62 [DOI] [PubMed] [Google Scholar]
- Bhalla US (2002b) Mechanisms for temporal tuning and filtering by postsynaptic signaling pathways. Biophys J 83: 740–752 [DOI] [PMC free article] [PubMed] [Google Scholar]
- Blackstone C, Sheng M (2002) Postsynaptic calcium signaling microdomains in neurons. Front Biosci 7: d872–d885 [DOI] [PubMed] [Google Scholar]
- Bliss T, Schoepfer R (2004) Neuroscience. Controlling the ups and downs of synaptic strength. Science 304: 973–974 [DOI] [PubMed] [Google Scholar]
- Bradshaw JM, Kubota Y, Meyer T, Schulman H (2003) An ultrasensitive Ca2+/calmodulin-dependent protein kinase II-protein phosphatase 1 switch facilitates specificity in postsynaptic calcium signaling. Proc Natl Acad Sci USA 100: 10512–10517 [DOI] [PMC free article] [PubMed] [Google Scholar]
- Collingridge GL, Isaac JT, Wang YT (2004) Receptor trafficking and synaptic plasticity. Nat Rev Neurosci 5: 952–962 [DOI] [PubMed] [Google Scholar]
- Cormier RJ, Greenwood AC, Connor JA (2001) Bidirectional synaptic plasticity correlated with the magnitude of dendritic calcium transients above a threshold. J Neurophysiol 85: 399–406 [DOI] [PubMed] [Google Scholar]
- D'Alcantara P, Schiffmann SN, Swillens S (2003) Bidirectional synaptic plasticity as a consequence of interdependent Ca2+-controlled phosphorylation and dephosphorylation pathways. Eur J Neurosci 17: 2521–2528 [DOI] [PubMed] [Google Scholar]
- De Koninck P, Schulman H (1998) Sensitivity of CaM kinase II to the frequency of Ca2+ oscillations. Science 279: 227–230 [DOI] [PubMed] [Google Scholar]
- Dudek SM, Bear MF (1992) Homosynaptic long-term depression in area CA1 of hippocampus and effects of N-methyl-D-aspartate receptor blockade. Proc Natl Acad Sci USA 89: 4363–4367 [DOI] [PMC free article] [PubMed] [Google Scholar]
- Erreger K, Dravid SM, Banke TG, Wyllie DJ, Traynelis SF (2005) Subunit-specific gating controls rat NR1/NR2A and NR1/NR2B NMDA channel kinetics and synaptic signaling profiles. J Physiol 563: 345–358 [DOI] [PMC free article] [PubMed] [Google Scholar]
- Eshete F, Fields RD (2001) Spike frequency decoding and autonomous activation of Ca2+-calmodulin-dependent protein kinase II in dorsal root ganglion neurons. J Neurosci 21: 6694–6705 [DOI] [PMC free article] [PubMed] [Google Scholar]
- Franks KM, Bartol TM, Sejnowski TJ (2001) An MCell model of calcium dynamics and frequency-dependence of calmodulin activation in dendritic spines. Neurocomputing 38–40: 9–16 [Google Scholar]
- Fujii S, Saito K, Miyakawa H, Ito K, Kato H (1991) Reversal of long-term potentiation (depotentiation) induced by tetanus stimulation of the input to CA1 neurons of guinea pig hippocampal slices. Brain Res 555: 112–122 [DOI] [PubMed] [Google Scholar]
- Goldberg JH, Tamas G, Aronov D, Yuste R (2003) Calcium microdomains in aspiny dendrites. Neuron 40: 807–821 [DOI] [PubMed] [Google Scholar]
- Hansel C, Artola A, Singer W (1997) Relation between dendritic Ca2+ levels and the polarity of synaptic long-term modifications in rat visual cortex neurons. Eur J Neurosci 9: 2309–2322 [DOI] [PubMed] [Google Scholar]
- Hayer A, Bhalla US (2005) Molecular switches at the synapse emerge from receptor and kinase traffic. PLoS Comput Biol 1: e20. [DOI] [PMC free article] [PubMed] [Google Scholar]
- Helmchen F (2002) Raising the speed limit—fast Ca(2+) handling in dendritic spines. Trends Neurosci 25: 438–441, discussion 441 [DOI] [PubMed] [Google Scholar]
- Hoffman DA, Sprengel R, Sakmann B (2002) Molecular dissection of hippocampal theta-burst pairing potentiation. Proc Natl Acad Sci USA 99: 7740–7745 [DOI] [PMC free article] [PubMed] [Google Scholar]
- Holmes WR, Levy WB (1990) Insights into associative long-term potentiation from computational models of NMDA receptor-mediated calcium influx and intracellular calcium concentration changes. J Neurophysiol 63: 1148–1168 [DOI] [PubMed] [Google Scholar]
- Holthoff K, Tsay D, Yuste R (2002) Calcium dynamics of spines depend on their dendritic location. Neuron 33: 425–437 [DOI] [PubMed] [Google Scholar]
- Johnston D, Christie BR, Frick A, Gray R, Hoffman DA, Schexnayder LK, Watanabe S, Yuan LL (2003) Active dendrites, potassium channels and synaptic plasticity. Philos Trans R Soc London B 358: 667–674 [DOI] [PMC free article] [PubMed] [Google Scholar]
- Johnson JD, Snyder C, Walsh M, Flynn M (1996) Effects of myosin light chain kinase and peptides on Ca2+ exchange with the N- and C-terminal Ca2+ binding sites of calmodulin. J Biol Chem 271: 761–767 [DOI] [PubMed] [Google Scholar]
- Kennedy MB (2000) Signal-processing machines at the postsynaptic density. Science 290: 750–754 [DOI] [PubMed] [Google Scholar]
- Linse S, Helmersson A, Forsen S (1991) Calcium binding to calmodulin and its globular domains. J Biol Chem 266: 8050–8054 [PubMed] [Google Scholar]
- Lisman J (1989) A mechanism for the Hebb and the anti-Hebb processes underlying learning and memory. Proc Natl Acad Sci USA 86: 9574–9578 [DOI] [PMC free article] [PubMed] [Google Scholar]
- Lisman J, Schulman H, Cline H (2002) The molecular basis of CaMKII function in synaptic and behavioural memory. Nat Rev Neurosci 3: 175–190 [DOI] [PubMed] [Google Scholar]
- Liu L, Wong TP, Pozza MF, Lingenhoehl K, Wang Y, Sheng M, Auberson YP, Wang YT (2004a) Role of NMDA receptor subtypes in governing the direction of hippocampal synaptic plasticity. Science 304: 1021–1024 [DOI] [PubMed] [Google Scholar]
- Liu XB, Murray KD, Jones EG (2004b) Switching of NMDA receptor 2A and 2B subunits at thalamic and cortical synapses during early postnatal development. J Neurosci 24: 8885–8895 [DOI] [PMC free article] [PubMed] [Google Scholar]
- Luby-Phelps K, Hori M, Phelps JM, Won D (1995) Ca(2+)-regulated dynamic compartmentalization of calmodulin in living smooth muscle cells. J Biol Chem 270: 21532–21538 [DOI] [PubMed] [Google Scholar]
- Malmendal A, Linse S, Evenas J, Forsen S, Drakenberg T (1999) Battle for the EF-hands: magnesium–calcium interference in calmodulin. Biochemistry 38: 11844–11850 [DOI] [PubMed] [Google Scholar]
- Markram H, Lubke J, Frotscher M, Sakmann B (1997) Regulation of synaptic efficacy by coincidence of postsynaptic APs and EPSPs. Science 275: 213–215 [DOI] [PubMed] [Google Scholar]
- Markram H, Roth A, Helmchen F (1998) Competitive calcium binding: implications for dendritic calcium signaling. J Comput Neurosci 5: 331–348 [DOI] [PubMed] [Google Scholar]
- Massey PV, Johnson BE, Moult PR, Auberson YP, Brown MW, Molnar E, Collingridge GL, Bashir ZI (2004) Differential roles of NR2A and NR2B-containing NMDA receptors in cortical long-term potentiation and long-term depression. J Neurosci 24: 7821–7828 [DOI] [PMC free article] [PubMed] [Google Scholar]
- Matus A (2000) Actin-based plasticity in dendritic spines. Science 290: 754–758 [DOI] [PubMed] [Google Scholar]
- Miller P, Zhabotinsky AM, Lisman JE, Wang XJ (2005) The stability of a stochastic CaMKII switch: dependence on the number of enzyme molecules and protein turnover. PLoS Biol 3: e107. [DOI] [PMC free article] [PubMed] [Google Scholar]
- Mockett B, Coussens C, Abraham WC (2002) NMDA receptor-mediated metaplasticity during the induction of long-term depression by low-frequency stimulation. Eur J Neurosci 15: 1819–1826 [DOI] [PubMed] [Google Scholar]
- Murthy VN, Sejnowski TJ, Stevens CF (2000) Dynamics of dendritic calcium transients evoked by quantal release at excitatory hippocampal synapses. Proc Natl Acad Sci USA 97: 901–906 [DOI] [PMC free article] [PubMed] [Google Scholar]
- Nakada C, Ritchie K, Oba Y, Nakamura M, Hotta Y, Iino R, Kasai RS, Yamaguchi K, Fujiwara T, Kusumi A (2003) Accumulation of anchored proteins forms membrane diffusion barriers during neuronal polarization. Nat Cell Biol 5: 626–632 [DOI] [PubMed] [Google Scholar]
- Naraghi M, Neher E (1997) Linearized buffered Ca2+ diffusion in microdomains and its implications for calculation of [Ca2+] at the mouth of a calcium channel. J Neurosci 17: 6961–6973 [DOI] [PMC free article] [PubMed] [Google Scholar]
- Nimchinsky EA, Yasuda R, Oertner TG, Svoboda K (2004) The number of glutamate receptors opened by synaptic stimulation in single hippocampal spines. J Neurosci 24: 2054–2064 [DOI] [PMC free article] [PubMed] [Google Scholar]
- Nishiyama M, Hoshino A, Tsai L, Henley JR, Goshima Y, Tessier-Lavigne M, Poo MM, Hong K (2003) Cyclic AMP/GMP-dependent modulation of Ca2+ channels sets the polarity of nerve growth-cone turning. Nature 423: 990–995 [DOI] [PubMed] [Google Scholar]
- O'Dell TJ, Kandel ER (1994) Low-frequency stimulation erases LTP through an NMDA receptor-mediated activation of protein phosphatases. Learn Mem 1: 129–139 [PubMed] [Google Scholar]
- Okamoto K, Nagai T, Miyawaki A, Hayashi Y (2004) Rapid and persistent modulation of actin dynamics regulates postsynaptic reorganization underlying bidirectional plasticity. Nat Neurosci 7: 1104–1112 [DOI] [PubMed] [Google Scholar]
- Petersen JD, Chen X, Vinade L, Dosemeci A, Lisman JE, Reese TS (2003) Distribution of postsynaptic density (PSD)-95 and Ca2+/calmodulin-dependent protein kinase II at the PSD. J Neurosci 23: 11270–11278 [DOI] [PMC free article] [PubMed] [Google Scholar]
- Pina-Crespo JC, Gibb AJ (2002) Subtypes of NMDA receptors in new-born rat hippocampal granule cells. J Physiol 541: 41–64 [DOI] [PMC free article] [PubMed] [Google Scholar]
- Popov S, Poo MM (1992) Diffusional transport of macromolecules in developing nerve processes. J Neurosci 12: 77–85 [DOI] [PMC free article] [PubMed] [Google Scholar]
- Puyal J, Grassi S, Dieni C, Frondaroli A, Dememes D, Raymond J, Pettorossi VE (2003) Developmental shift from long-term depression to long-term potentiation in the rat medial vestibular nuclei: role of group I metabotropic glutamate receptors. J Physiol 553: 427–443 [DOI] [PMC free article] [PubMed] [Google Scholar]
- Rusakov DA, Scimemi A, Walker MC, Kullmann DM (2004) Comment on ‘Role of NMDA receptor subtypes in governing the direction of hippocampal synaptic plasticity'. Science 305: 1912 author reply [DOI] [PMC free article] [PubMed] [Google Scholar]
- Sabatini BL, Oertner TG, Svoboda K (2002) The life cycle of Ca(2+) ions in dendritic spines. Neuron 33: 439–452 [DOI] [PubMed] [Google Scholar]
- Sheng M, Lee SH (2000) Growth of the NMDA receptor industrial complex. Nat Neurosci 3: 633–635 [DOI] [PubMed] [Google Scholar]
- Svoboda K, Tank DW, Denk W (1996) Direct measurement of coupling between dendritic spines and shafts. Science 272: 716–719 [DOI] [PubMed] [Google Scholar]
- Tang Y, Schlumpberger T, Kim T, Lueker M, Zucker RS (2000) Effects of mobile buffers on facilitation: experimental and computational studies. Biophys J 78: 2735–2751 [DOI] [PMC free article] [PubMed] [Google Scholar]
- Winder DG, Sweatt JD (2001) Roles of serine/threonine phosphatases in hippocampal synaptic plasticity. Nat Rev Neurosci 2: 461–474 [DOI] [PubMed] [Google Scholar]
- Wong TP, Liu L, Sheng M, Wang YT (2004) Response to comment on ‘Role of NMDA receptor subtypes in governing the direction of hippocampal synaptic plasticity'. Science 305: 1912. [DOI] [PubMed] [Google Scholar]
- Xia Z, Storm DR (2005) The role of calmodulin as a signal integrator for synaptic plasticity. Nat Rev Neurosci 6: 267–276 [DOI] [PubMed] [Google Scholar]
- Yang C, Jas GS, Kuczera K (2001) Structure and dynamics of calcium-activated calmodulin in solution. J Biomol Struct Dyn 19: 247–271 [DOI] [PubMed] [Google Scholar]
- Yang SN, Tang YG, Zucker RS (1999) Selective induction of LTP and LTD by postsynaptic [Ca2+]i elevation. J Neurophysiol 81: 781–787 [DOI] [PubMed] [Google Scholar]
- Yasuda R, Sabatini BL, Svoboda K (2003) Plasticity of calcium channels in dendritic spines. Nat Neurosci 6: 948–955 [DOI] [PubMed] [Google Scholar]
- Zador A, Koch C, Brown TH (1990) Biophysical model of a Hebbian synapse. Proc Natl Acad Sci USA 87: 6718–6722 [DOI] [PMC free article] [PubMed] [Google Scholar]
Associated Data
This section collects any data citations, data availability statements, or supplementary materials included in this article.
Supplementary Materials
Supplementary Information