

Abstract
Results of a first-stage Sea Urchin Genome Project are summarized here. The species chosen was Strongylocentrotus purpuratus, a research model of major importance in developmental and molecular biology. A virtual map of the genome was constructed by sequencing the ends of 76,020 bacterial artificial chromosome (BAC) recombinants (average length, 125 kb). The BAC-end sequence tag connectors (STCs) occur an average of 10 kb apart, and, together with restriction digest patterns recorded for the same BAC clones, they provide immediate access to contigs of several hundred kilobases surrounding any gene of interest. The STCs survey >5% of the genome and provide the estimate that this genome contains ≈27,350 protein-coding genes. The frequency distribution and canonical sequences of all middle and highly repetitive sequence families in the genome were obtained from the STCs as well. The 500-kb Hox gene complex of this species is being sequenced in its entirety. In addition, arrayed cDNA libraries of >105 clones each were constructed from every major stage of embryogenesis, several individual cell types, and adult tissues and are available to the community. The accumulated STC data and an expanding expressed sequence tag database (at present including >12,000 sequences) have been reported to GenBank and are accessible on public web sites.
The requirement for sea urchin genomics stems primarily from the widespread use of these organisms for research into the molecular mechanisms of development. The developmental biology of sea urchin embryos is relatively well known because of their many natural experimental advantages, which were exploited for many decades by experimental embryologists (1, 2). Molecular biologists have exploited other advantages: the ease of gene transfer into sea urchin eggs, which encourages high-throughput cis-regulatory analysis, and the tremendous fecundity of these animals, which permits picomole quantities of rare proteins (e.g., transcription factors) to be purified directly from embryo nuclei. Sea urchin eggs also lend themselves to microinjection of RNAs encoding negatively acting variants of specific regulatory and signaling molecules or constructs encoding proteins that intervene in the regulatory system by specific knock-out or ectopic expression (for reviews and examples, see refs. 3–5). Sea urchin embryos now provide an advanced research model for analysis of gene regulatory networks (3, 6). The phylogenetic position of sea urchins provides an additional inducement. Together with the hemichordates (which barely have begun to be studied in the laboratory), sea urchins constitute the sister clade to the chordates within the deuterostomes (7–9). They offer unique advantages for comparative genomics as an outgroup with respect to vertebrates for studies of gene use and of functional gene regulatory organization.
The sea urchin genome we chose was that of Strongylocentrotus purpuratus, the “California purple sea urchin,” and for comparative purposes some materials were prepared as well from Eucidaris tribiloides, a representative of the most distantly related group of extant sea urchins [Strongylocentrotus belongs to the major modern clade of sea urchins, the euechinoids, whereas Eucidaris, a pencil urchin, is a member of one of the few echinoid lineages to survive the great Permian extinction, which occurred about 250 million years ago (10)]. S. purpuratus is fairly abundant from Vancouver to Northern Mexico and is the major species used for gene regulation research. Eggs can be obtained from it under laboratory conditions at all times of the year, although it is seasonal in the wild. It is a relatively hardy animal that has been maintained for years in the laboratory, and it can be carried in egg-to-egg culture and even inbred (11, 12).
The Sea Urchin Genome Project was made possible through the vision and generosity of the Stowers Institute for Medical Research. It was a 2-year effort funded at a total cost of 4 million dollars. The project was undertaken by a consortium of five laboratories. The objectives were to (i) create a virtual bacterial artificial chromosome (BAC)-end sequence tag connector (STC) map of the genome that could provide immediate access to any desired region of the genome and serve as a scaffold for future genomic sequencing, (ii) obtain from the STC sequence data an estimate of gene number for this species and to characterize its complex complement of repetitive sequences (13, 14), (iii) obtain the complete sequence of the 500-kb Hox gene complex of S. purpuratus (15), (iv) generate and print large, arrayed cDNA libraries representing every stage of development and many adult tissues (16), and (v) compile an expandable expressed sequence tag (EST) database from cDNA-sequencing projects carried forward on these same libraries and set up other publicly available databases for the STC and Hox domain sequences. Of these objectives, all but the Hox complex sequence are now essentially completed.
Materials and Methods
BAC Library Construction.
A BAC library was constructed in the BACe3.6 vector (17). Sperm cells from a single animal were embedded in agarose, and the blocks were extracted with lithium dodecylsulfate (18) to give a DNA concentration of 7.5 mg per block (8.8 × 10⁶ cells per block). Agarose-embedded DNA was partially digested by EcoRI restriction enzyme–EcoRI methylase competition (19). Partially digested DNA was size-fractionated by pulsed-field gel electrophoresis, and the size fraction spanning 130–160 kb was purified from the gel by electroelution (20). Insert DNA was ligated into vector and electroporated into DH10B bacterial cells (Electromax; GIBCO/BRL). General methods used for library construction and recombinant analysis can be found in refs. 18 and 21. The library was arrayed into 384-well plates and stored at −80°C.
BAC Template Preparation, BAC-End Sequencing, and DNA Fingerprinting.
Before template preparation, the 384-well plates from the BAC library were thawed at room temperature, freshly replicated into LB, and grown inverted overnight. Approximately 104 cells from each well of this culture were transferred robotically into 4.5 ml of LB and incubated overnight. After growth, BAC DNA was extracted by using the Autogen 740 robot (Intregrated Separation Systems, Natick, NJ), employing alkaline lysis chemistry. Cyclic sequencing reactions of a 40-μl volume were set up robotically by using 32 μl of BAC DNA template and 8 μl of sequencing reaction mix that included the Big Dye Terminator mix (PE Biosystems, Foster City, CA). For pBACe3.6, primer 5′-TAA TAC GAC TCA CTA TAG GGA GA-3′ was used in the forward T7 direction, and 5′-GTT TTT GCG ATC TGC CGT TTC-3′ was used in the SP6E (reverse) direction. Unincorporated dyes and salts were removed by precipitation, and the reaction products were resuspended in 2.0 μl of sequencing loading dye for sequencing on ABI377 instruments (PE Biosystems, Foster City, CA) or 10 μl of deionized formamide for sequencing on MegaBACE instruments (Amersham Pharmacia). Run conditions for the ABI377 were: 4.5% FMC acrylamide in 1× TBE buffer (90 mM Tris/64.6 mM boric acid/2.5 mM EDTA, pH 8.3), 36-cm plates, and 96 lanes run for 3.5 h at 2,880 V. MegaBACE run conditions were a 90-sec injection at 2 kV and a 150-sec run at 7 kV. Raw chromatographic data from both ABI377s and MegaBACE DNA sequencers was processed by using phred (22, 23). The minimum criterion quality measures for ST sequence data were Q20 > 50 and Q10 > 200. Read lengths >750 bases on the ABI377 and >950 bases on MegaBACE were thrown out because they consisted mostly of noise.
Restriction enzyme fingerprint digests used 10-μl reaction volumes consisting of 7.5 μl of BAC DNA and 2.5 μl of restriction enzyme mix. Restriction enzyme mix contained 1.0 μl of H2O, 0.5 μl of EcoRI restriction enzyme, and 1.0 μl of 10× restriction enzyme buffer. After mixing, these reactions were incubated at 37°C for 3–5 h. Restriction digests were resolved by agarose gel electrophoresis. After resolution, these gels were stained with Vistra Green (Amersham Pharmacia) and imaged by using a Molecular Dynamics 595 Fluorimager. Images were processed further by using frag automated analysis software.
Macroarray Library Preparation, Arraying, and Spotting.
Total RNA was prepared from the selected embryonic stage, embryonic cell type, or adult tissue type by using RNAzol B (Leedo Medical Laboratories, Houston, TX). mRNA then was isolated with Oligo dT Dynabeads (Dynal, Great Neck, NY) and used to construct a directional cDNA library. First-strand cDNA was synthesized from the polyadenylated RNA by using a random (N6) primer to eliminate bias toward the 3′ end of the mRNA molecules. Double-stranded cDNA was cloned into the SalI and NotI sites of the pSPORT1 vector and electroporated into DH10B cells (Electromax; GIBCO/BRL). The average insert length for each of the libraries ranged from 1,000 to 1,500 bp. For each library, approximately 110,000 clones were arrayed into 288 384-well microtiter plates. These plates then were spotted onto six 22-cm × 22-cm Hybond N+ nylon filters (Amersham Pharmacia). Arraying and spotting was accomplished with a “Q-Bot” robot (Genetix, Christchurch, Dorset, U.K.). To maintain consistent spot size and reduce streaking, bacterial filters were grown on 3% agar plates and colony size was monitored rigorously. Colonies were grown for approximately 12 h at 37°C and then processed for screening according to standard protocols (24, 25).
Results and Discussion
BAC-End STC Scan of the S. purpuratus Genome.
The BAC-end STC scan is valuable in two respects (26). Not only does it provide a virtual map and immediate access for further study of any given genomic region, but it also provides sequence from a significant, random sample of the whole genome. After editorial removal of substandard sequence (see Materials and Methods), the average length of the sequence reads in the final STC database was 610 bp. The data set consists of about 7.6 × 10⁴ BAC-end sequences. The genome size of S. purpuratus is 8 × 10⁸ bp, based on sperm DNA content (27), so the STC sequences in total amount to >5% of the genomic sequence length. On average, they will occur about every 10 kb in the genome.
A summary of some key parameters of the S. purpuratus genome deriving from the STC data is given in Table 1. To obtain an estimate of the number of protein-coding genes, we determined the number of matches with known protein-coding sequences in the Swiss Prot database (blast criterion: <e−6 matches to entries from species other than sea urchins and <e−12 echinoid matches) and then applied a correction for bona fide coding sequences not recognized at this criterion in the database. This was obtained from previously published analyses of S. purpuratus EST data (28, 29). The outcome is an estimate that the S. purpuratus genome contains about 2.7 × 10⁴ genes (see Table 1 legend). This is greater than the 1.4–2.0 × 10⁴ genes estimated for Drosophila (30), Caenorhabditis elegans (31), or Ciona intestinalis (32) and significantly less than the 7–10 × 104 genes estimated for mammals (33). As Table 1 shows, the average gene density for S. purpuratus is thus about one gene per 25–40 kb.
Table 1.
Parameters of the S. purpuratus genome
| Genome size, Mb* | 800 |
| Number of genes† | 27,350 |
| Average gene spacing, bp | 29,000 |
| Frequency of middle repeat families, elements per genome‡ | 500–8,500 (7.5% of genome DNA) |
| 2109B repeat family elements per genome§ | 22,000 (0.3% of genome DNA) |
| Simple sequence repeat elements per genome¶ | 70,000 |
From measurements of sperm DNA content, 1.78 pg per nucleus (17).
Estimated from recovery of recognized coding sequence in the BAC-end STC data set as described in ref. 27. The number of matches to the Swiss database in 7.6 × 10⁴ STCs was 1,058. We corrected for unmatched gene sequences on the basis of two carefully analyzed EST data sets (27, 28). These yield a factor of 1.5 for total gene-encoding proteins per recognized gene. Considering that the STCs constitute a sample equal to 5.8% of the genome, the listed number of genes is obtained.
Estimated from analysis of all sequences in a sample of 37,187 STCs that react with other sequences within that set, as described in the legend to Fig. 2.
2109B is the highest-frequency repeat in the sea urchin genome (37). The basic 2109B repeat element length is 119 bp.
About 4,000 simple sequence repeats were observed in the STC data set, of which 70% are dinucleotide repeats, 25% are trinucleotide, and the remainder are tetra-, penta-, and hexanucleotide repeats.
The number of genes used during embryonic development of S. purpuratus was measured earlier in a long series of quantitative mRNA excess hybridizations against single-copy DNA (for review, see ref. 34). At gastrula stage there are about 8,500 diverse mRNAs being translated on the embryo polysomes. The mRNA complexities of other stages are largely overlapping in sequence content and fall within 20% of the gastrula complexity. Like most modern sea urchin species, S. purpuratus develops by an evolutionarily basal indirect process, in which the product of embryogenesis is a feeding larva that bears almost no morphological relationship to the body plan of the adult. The embryo produces only a simple, single-cell-thick larva consisting of about 12 differentiated cell types (2), and the adult body plan forms in a separate and much more complex postembryonic process (2), which is already known to use some genes not required in embryogenesis (35). By reference to the present estimate of total gene number, it is clear that embryogenesis in this species requires less than a third of the total gene content. This can be taken as a confirmation of the concept that the embryonic phase of the process of maximal indirect development, as displayed by S. purpuratus, is genetically simple, compared with the formation and operation of the adult body (36). This argument in itself is an interesting example of the returns to be obtained by application of genomics approaches to organisms outside of the conventional “model systems.”
The BAC-end STC map is a resource for the future. The BAC recombinants from which the STCs were obtained reside in a permanently arrayed format. As illustrated in the diagram in Fig. 1, a contig of terminally overlapping BACs surrounding any particular gene can be obtained by several simple screening steps and reference to the publicly available sequence and restriction digest data. Comparison of the overlapping restriction maps confirms the relationships of the clones to one another and identifies insertions, deletions, or rearrangements in the BAC clones. This resource is certain to prove useful for studies of synteny with respect to other organisms, for isolation and characterization of cis-regulatory systems, and, perhaps most importantly in the long run, to provide a scaffold for large-scale sequencing of interesting regions of the genome (37).
Figure 1.
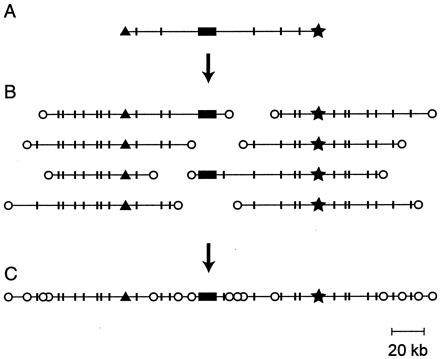
The virtual map. Recovery of a contig surrounding a known gene by use of the STC database. (A) The arrayed BAC library is screened by using a cDNA probe, and a BAC containing the gene sequence is selected; the most desirable clone would be the longest that has the gene sequence (solid box) toward the middle. The STCs for that BAC (▴, ★) are recovered from the database together with the length distribution of restriction fragments produced by the sites (indicated by short, vertical lines). (B) Oligonucleotide probes are created from the left and right STCs and used to scan the BAC library. The selected clones are aligned to overlap in the restriction digest patterns. The probes should not lie within repetitive sequences: if they do, too many BACs will score positive, and their restriction fragment lengths will not align. (C) The clones extending the longest distance left and right plus the original clone (A) constitute a contig surrounding the gene, marked by STC tags at frequent intervals.
Repetitive Sequences of the S. purpuratus Genome.
There are a large number of distinct families of repeated sequence in the sea urchin genome. For an initial examination, 37,187 of the STCs, which constituted a subset, were compared with one another. The result is a total of about 3,000,000 statistically significant matches because of sequences repeated at least once in the sample. Of these, 242,597 are matches that, according to calculation, would be recognized by hybridization under normal incubation conditions (60°C, 0.18 M Na+). This is termed the “hybridization criterion” for the significance of repeated sequences and is the criterion applied throughout this description. The quantity and frequency of repeated sequence is larger if shorter or less well matched repeated sequence motifs are considered.
The observed matches were used to classify sequences into families whose members are similar to a canonical sequence of the family. These families have a wide range in the number of copies in the genome (“frequency of repetition”). Fig. 2 represents the families that have >10 member sequences in this subset of the STCs, so that their frequency can be estimated with some accuracy. The histogram shows the fraction of the genome in sets of families as a function of repeat frequency. The numbers within the bars indicate the number of different families in that frequency domain. The total content of repetitive sequence in these frequency classes, i.e., >500 copies per genome, is summarized in Table 1. Here, a separate entry is reserved for a specific repeat sequence (2109B) studied earlier (38), which is the highest-frequency repetitive element of the S. purpuratus genome. In addition, there are large numbers of lower-frequency families for which the actual genomic frequency is yet uncertain. These are not shown explicitly in Fig. 2 and are not included in Table 1. About 3,120 of these lower-frequency repeats occur in the sample of 37,187 BAC STCs, in which they are present in 2–10 copies. A little less than a third of the genome is made up of all repeated sequences at hybridization criterion, in agreement with reassociation kinetic estimates made a quarter of a century ago (39).
Figure 2.
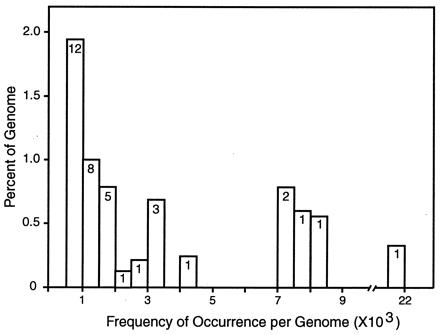
Fraction of the S. purpuratus genome in families of repetitive sequence over a range of frequencies. The matches from an all-to-all comparison of 37,187 STCs were listed by score, and, starting with the highest scores, individual sequences and all of those that matched at hybridization criterion (see text) were set aside into families. The matching regions of the family members were summed to estimate how many nucleotides are present in the sequences of each family. The families were classified by frequency in intervals of 500, and the total matching length was compared with the genome, correcting for the fraction of the genome in the STC sample. Vertical axis is the percentage of the genome in repeat families in each frequency domain. Horizontal axis is the genomic frequency. The numbers in the histogram boxes are the numbers of distinct repeat families in each frequency domain. There are many additional families in the 2- to 500-copy frequency domain, but because of limited sampling in this small fraction of the genome, neither their frequencies nor the fraction of the genome that they account for can be calculated accurately yet.
Macroarray Library Resource.
For an organism such as S. purpuratus, where there is as yet a relatively small EST database, the main use of arrayed libraries is gene discovery. For this purpose large cDNA libraries are desirable. Table 2 lists the arrayed libraries generated in the Sea Urchin Genome Project. These libraries consist of >105 clones each, carried in 384-well plates. Each library is printed on six 22-cm × 22-cm (“macroarray”) filters (16). Our ambitious objective was that every stage of embryonic development should be accessible to the research community in these libraries, and this objective was attained. In addition, Table 2 lists a number of libraries representing single cell types and adult tissues. Although screening macroarray filters prepared from bacterial colonies is inherently inaccurate compared with two-color DNA microarray screening, quantitative technologies now have been developed that permit recovery from the macroarray filters of differentially expressed genes at a sensitivity down to a few copies per average cell (J.P.R., G. Amore, C. B. Livi, A. Ransick, and E.H.D., unpublished data). The macroarray resource summarized in Table 2 should enable detection and recovery of genes expressed differentially in S. purpuratus embryogenesis.
Table 2.
cDNA library resource
| Name | Source | Description |
|---|---|---|
| Seven-hour cDNA | Whole embryo | Cleavage stage embryo of about 64 cells |
| Fifteen-hour cDNA | Whole embryo | Hatched blastula of about 200 cells |
| Twenty-hour cDNA | Whole embryo | Mesenchyme blastula stage (400 cells) |
| Forty-hour cDNA | Whole embryo | Gastrula stage (600 cells) |
| Larval cDNA | Whole larva | Eight-arm larva, early rudiment stage (1 × 10⁴ cells) |
| Skeletogenic mesenchyme | Embryonic cell type | Skeletogenic mesenchyme cells cultured from primary mesenchyme cells |
| Gut cDNA | Adult organ | From dissected adult guts |
| Mesentery | Adult organ | From adult mesenteries |
| Lantern | Adult organ | Adult jaw apparatus, including muscles and nerve ring |
| Egg cDNA | Egg cells | Spawned eggs |
| Ovary cDNA | Adult organ | Dissected from adult, includes gonial cells and oocytes at various stages of development |
| Testis cDNA | Adult organ | Dissected from adult; contains gonial cells and developing spermatozoa |
| BAC genomic | Single male | Extracted from sperm |
| PAC genomic | Single male | Extracted from sperm |
A list of the macroarray libraries assembled for the sea urchin genome project. Each library contains 100,000 clones made from cDNA or genomic DNA obtained as listed under source. A description of each source also is given.
EST Database.
EST data are beginning to accumulate for the Genome Project arrayed libraries (ref. 27; J.P.R., G. Amore, C. B. Livi, A. Ransick, and E.H.D., unpublished data). At present, there are about 12,000 ESTs in the database. Oligonucleotide mapping has been used to create a unique EST database for an unfertilized egg library (28). As a demonstration, in this project we obtained a unique EST data set that consists of >7,400 different sequences (8,300 EST sequences total) from cDNA of skeletogenic mesenchyme cells, a single, differentiated cell type of the embryo (conclusions from this data set are to be described elsewhere; C.A.E. and G.M., unpublished data). Sea urchin embryos can be disaggregated efficiently, and this provides access to single cell types. Any cell type defined by a given regulatory state, in principle, can be isolated. That is, where a particular developmental cis-regulatory element is used to define the regulatory state, this element is used to drive a green fluorescent protein (GFP) reporter in an injected construct, and the green cells then are sorted by FACS. This method already has been used to separate out cells that are ectopically expressing the brachyury gene under control of an exogenous cis-regulatory element, together with GFP (J.P.R. and E.H.D., unpublished data). Application of this technology can be expected to enrich the S. purpuratus EST database, with sequence sets representing single states of differentiation and various transient developmental regulatory states.
Complete Sequence of the S. purpuratus Hox Gene Cluster.
The single Hox gene cluster of S. purpuratus contains at least 10 genes linked within a 500-kb span (15). An overlapping set of BAC and PAC recombinants are being sequenced in the course of the S. purpuratus Genome Project to about 10-fold coverage (results to be presented elsewhere). This effort will be completed in the near future. Other than the Hox genes, no recognizable coding regions were observed within the cluster, as in other organisms (40). The immediate usefulness of this effort is that it will provide intergenic sequence for comparative computational analysis of control sequences.
Web Sites.
The address of the S. purpuratus Genome Project Web site, in which all BAC-end STC data, EST data, list of arrayed libraries, and repetitive sequence information are stored, is http://sea-urchin.caltech.edu/genome.
Conclusions
The Sea Urchin Genome Project was undertaken to exploit the advantages sea urchins offer for experimental developmental biology by application of the resolving power of high-throughput genomics. Development is fundamentally a process encoded in the vast regulatory apparatus of the genome. To understand this process will require system-level technologies and computational approaches, as well as causal experimentation. Genome-level understanding, furthermore, brings us directly into the domain of evolutionary process.
We have obtained a considerable amount of new information about the S. purpuratus genome, as summarized briefly in this report. Neither the estimates of gene number and density nor the description of the zoo of repetitive sequence families that emerged from the STC analysis were available heretofore. The virtual STC map will be immediately useful for research, as we have described, but its main importance is that it provides a foundation for larger-scale sequencing of genomic regions.
Echinoderms provide excellent opportunities for comparative sequence analyses of regulatory systems. Species are available at every range of evolutionary distance, from congeners only a few million years away from S. purpuratus, to members of other echinoderm classes whose last common ancestor with S. purpuratus lived in the Cambrian period.
The strategy described here is applicable to many other genomes and, indeed, could be applied widely to a range of phylogenetically interesting organisms. It is economical in that the scientific returns are relatively large and the cost is relatively modest. A much broadened science of genomics would provide access to a causal exploration of animal diversity, one of the profound problems in bioscience.
Acknowledgments
This project was supported by the Stowers Institute for Medical Research, to which the whole field of sea urchin molecular/developmental biology is pleased to acknowledge its gratitude. J.P.R. was supported by a National Institutes of Health Individual National Research Service Award (GM-18478). The Caltech Beckman Institute provided invaluable support for the robotics arraying facility essential to this project.
Abbreviations
- STCs
sequence tag connectors
- BAC
bacterial artificial chromosome
- EST
expressed sequence tag
Footnotes
Data deposition: The sequences reported in this paper have been deposited in the GenBank database (accession nos. AZ135866–AZ211804).
Article published online before print: Proc. Natl. Acad. Sci. USA, 10.1073/pnas.160261897.
Article and publication date are at www.pnas.org/cgi/doi/10.1073/pnas.160261897
References
- 1.Hörstadius S. Experimental Embryology of Echinoderms. Oxford: Clarendon; 1973. [Google Scholar]
- 2.Davidson E H, Cameron R A, Ransick A. Development (Cambridge, UK) 1998;125:3269–3290. doi: 10.1242/dev.125.17.3269. [DOI] [PubMed] [Google Scholar]
- 3.Davidson E H. Curr Opin Genet Dev. 1999;9:530–541. doi: 10.1016/s0959-437x(99)00013-1. [DOI] [PubMed] [Google Scholar]
- 4.Angerer L M, Angerer R C. Dev Biol. 2000;218:1–12. doi: 10.1006/dbio.1999.9553. [DOI] [PubMed] [Google Scholar]
- 5.Bogarad L D, Arnone M I, Chang C, Davidson E H. Proc Natl Acad Sci USA. 1998;95:14827–14832. doi: 10.1073/pnas.95.25.14827. [DOI] [PMC free article] [PubMed] [Google Scholar]
- 6.Yuh C-H, Bolouri H, Davidson E H. Science. 1998;279:1896–1902. doi: 10.1126/science.279.5358.1896. [DOI] [PubMed] [Google Scholar]
- 7.Wada H, Satoh N. Proc Natl Acad Sci USA. 1994;91:1801–1804. doi: 10.1073/pnas.91.5.1801. [DOI] [PMC free article] [PubMed] [Google Scholar]
- 8.Turbeville J M, Schultz J R, Raff R A. Mol Biol Evol. 1994;11:648–655. doi: 10.1093/oxfordjournals.molbev.a040143. [DOI] [PubMed] [Google Scholar]
- 9.Cameron C B, Garey J R, Swalla B J. Proc Natl Acad Sci USA. 2000;97:4469–4474. doi: 10.1073/pnas.97.9.4469. [DOI] [PMC free article] [PubMed] [Google Scholar]
- 10.Paul C R C, Smith A B. Biol Rev. 1984;59:443–482. [Google Scholar]
- 11.Leahy P S. Methods Cell Biol. 1986;27:1–13. doi: 10.1016/s0091-679x(08)60339-8. [DOI] [PubMed] [Google Scholar]
- 12.Cameron R A, Leahy P S, Britten R J, Davidson E H. Dev Biol. 1999;208:255–264. doi: 10.1006/dbio.1999.9224. [DOI] [PubMed] [Google Scholar]
- 13.Britten R J, Graham D E, Eden F C, Painchaud D M, Davidson E H. J Mol Evol. 1976;9:1–23. doi: 10.1007/BF01796119. [DOI] [PubMed] [Google Scholar]
- 14.Klein W H, Thomas T L, Lai C, Scheller R H, Britten R J, Davidson E H. Cell. 1978;14:889–900. doi: 10.1016/0092-8674(78)90344-6. [DOI] [PubMed] [Google Scholar]
- 15.Martinez P, Rast J P, Arenas-Mena C, Davidson E H. Proc Natl Acad Sci USA. 1999;96:1469–1474. doi: 10.1073/pnas.96.4.1469. [DOI] [PMC free article] [PubMed] [Google Scholar]
- 16.Maier E, Meier-Ewert S, Ahmadi A R, Curtis J, Lehrach H. J Biotechnol. 1994;35:191–203. doi: 10.1016/0168-1656(94)90035-3. [DOI] [PubMed] [Google Scholar]
- 17.Frengen E, Weichenhan D, Zhao B, Osoegawa K, van Geel M, de Jong P J. Genomics. 1999;58:250–253. doi: 10.1006/geno.1998.5693. [DOI] [PubMed] [Google Scholar]
- 18.Amemiya C T, Ota T, Litman G W. In: Nonmammalian Genomic Analysis: A Practical Guide. Birren B, Lai E, editors. San Diego: Academic; 1996. pp. 223–256. [Google Scholar]
- 19.Larin Z, Monaco A P, Lehrach H. Proc Natl Acad Sci USA. 1991;88:4123–4127. doi: 10.1073/pnas.88.10.4123. [DOI] [PMC free article] [PubMed] [Google Scholar]
- 20.Strong S J, Ohta Y, Litman G W, Amemiya C T. Nucleic Acids Res. 1997;25:3959–3961. doi: 10.1093/nar/25.19.3959. [DOI] [PMC free article] [PubMed] [Google Scholar]
- 21.Osoegawa K, Woon P Y, Zhao B, Frengen E, Tateno M, Catanese J J, de Jong P J. Genomics. 1998;52:1–8. doi: 10.1006/geno.1998.5423. [DOI] [PubMed] [Google Scholar]
- 22.Ewing B, Hillier L, Wendl M C, Green P. Genome Res. 1998;8:175–185. doi: 10.1101/gr.8.3.175. [DOI] [PubMed] [Google Scholar]
- 23.Ewing B, Green P. Genome Res. 1998;8:186–194. [PubMed] [Google Scholar]
- 24.Clark M D, Panopoulou G D, Cahill D J, Bussow K, Lehrach H. Methods Enzymol. 1999;303:205–233. doi: 10.1016/s0076-6879(99)03015-3. [DOI] [PubMed] [Google Scholar]
- 25.Nizetic D, Drmanac R, Lehrach H. Nucleic Acids Res. 1991;19:182. doi: 10.1093/nar/19.1.182. [DOI] [PMC free article] [PubMed] [Google Scholar]
- 26.Mahairas G G, Wallace J C, Smith K, Swartzell S, Holzman T, Keller A, Shaker R, Furlong J, Young J, Zhao S Y, et al. Proc Natl Acad Sci USA. 1999;96:9739–9744. doi: 10.1073/pnas.96.17.9739. [DOI] [PMC free article] [PubMed] [Google Scholar]
- 27.Hinegardner R. Comp Biochem Physiol. 1974;49B:219–226. doi: 10.1016/0305-0491(74)90156-4. [DOI] [PubMed] [Google Scholar]
- 28.Poustka A, Herwig R, Krause A, Hennig S, Meier-Ewert S, Lehrach H. Genomics. 1999;59:122–133. doi: 10.1006/geno.1999.5852. [DOI] [PubMed] [Google Scholar]
- 29.Lee Y-H, Huang M, Cameron R A, Graham G, Davidson E H, Hood L, Britten R J. Development (Cambridge, UK) 1999;126:3857–3867. doi: 10.1242/dev.126.17.3857. [DOI] [PubMed] [Google Scholar]
- 30.Adams M D, Celniker S E, Holt R A, Evans C A, Gocayne J D, Amanatides P G, Scherer S E, Li P W, Hoskins R A, Galle R F, et al. Science. 2000;287:2185–2195. doi: 10.1126/science.287.5461.2185. [DOI] [PubMed] [Google Scholar]
- 31.C. elegans Sequencing Consortium. Science. 1998;282:2012–2018. doi: 10.1126/science.282.5396.2012. [DOI] [PubMed] [Google Scholar]
- 32.Simmen M W, Leitgeb S, Clark V H, Jones S J M, Bird A. Proc Natl Acad Sci USA. 1998;95:4437–4440. doi: 10.1073/pnas.95.8.4437. [DOI] [PMC free article] [PubMed] [Google Scholar]
- 33.Collins F S. Proc Natl Acad Sci USA. 1995;92:10821–10823. doi: 10.1073/pnas.92.24.10821. [DOI] [PMC free article] [PubMed] [Google Scholar]
- 34.Davidson E H. Gene Activity in Early Development. 3rd Ed. Orlando, FL: Academic; 1986. [Google Scholar]
- 35.Arenas-Mena C, Martinez P, Cameron R A, Davidson E H. Proc Natl Acad Sci USA. 1998;95:13062–13067. doi: 10.1073/pnas.95.22.13062. [DOI] [PMC free article] [PubMed] [Google Scholar]
- 36.Davidson E H, Peterson K, Cameron R A. Science. 1995;270:1319–1325. doi: 10.1126/science.270.5240.1319. [DOI] [PubMed] [Google Scholar]
- 37.Venter J C, Smith H O, Hood L. Nature (London) 1996;381:364–366. doi: 10.1038/381364a0. [DOI] [PubMed] [Google Scholar]
- 38.Scheller R H, Costantini F D, Kozlowski M R, Britten R J, Davidson E H. Cell. 1978;15:189–203. doi: 10.1016/0092-8674(78)90094-6. [DOI] [PubMed] [Google Scholar]
- 39.Graham D E, Neufeld B R, Davidson E H, Britten R J. Cell. 1974;1:127–137. [Google Scholar]
- 40.Ruddle F H, Bentley K L, Murtha M T, Risch N. Development (Cambridge, U.K.) 1994. Suppl., 155–161. [PubMed] [Google Scholar]