

Summary
The head direction cell system of the rat brain is composed of multiple regions associated with the hippocampal formation. The dynamics of head direction tuning curves (HDTCs) were compared with place fields of the hippocampus. In both familiar and cue-altered environments, as a rat ran an increasing number of laps on a circular track, the center of mass (COM) of the HDTC tended to shift backwards, similar to previous observations of hippocampal place cells. However, important differences existed between these two sets of cells in terms of the shift patterns relative to the cue-altered conditions, the proportion of backward vs. forward shifts, and the time course of shift resetting. The demonstration of backward COM shifts in simultaneous recordings of head direction cells and place cells suggests that similar plasticity mechanisms (such as temporally asymmetric LTP induction or spike timing-dependent plasticity) may work in both of these brain systems, and these processes may reflect a general mechanism to store learned sequences of neural activity patterns.
Introduction
The encoding and storage of temporal sequences are critical components of many forms of learning and memory, including classical conditioning, operant conditioning, and episodic memory. These remembered sequences allow organisms to predict future events based on current sensory input, internal cognitive states, and prior experience. Hebb’s notion of a phase sequence stipulated that through experience, a neural assembly representing one brain state (e.g., a representation of the animal’s location or of a visual scene) can activate sequentially the neural assemblies that represent other brain states that, in the past, have tended to follow the current state (Hebb, 1949). This sequential activation endows the animal with the ability to predict likely consequences of current brain activity, and thereby allows adaptive behavior to avoid negative consequences or to pursue anticipated positive rewards. Moreover, the sequential activation of previous brain states allows the recall of the temporal order of events, which is a hallmark of human episodic memory.
Long-term potentiation (LTP) is thought to be a cellular mechanism by which changes in synaptic strength between coactive neurons underlies associative learning (Bliss and Lømo, 1973; McNaughton and Morris, 1987). Importantly, the presynaptic neuron must fire before the postsynaptic neuron in order to induce LTP, thereby preserving the temporal causation of firing (Levy and Steward 1983; Markram et al. 1997; Bi and Poo 1998). The temporally asymmetric nature of hippocampal LTP inspired a number of theoretical studies of how spatially selective, hippocampal pyramidal cells (place cells) could encode temporal or spatial sequences in the patterns of synaptic weights in the network (Levy, 1996; August and Levy 1999; Blum and Abbott 1996; see also Muller et al., 1996a). A prediction of these models was that, if an animal ran a stereotyped sequence of locations in a route, presynaptic place cells that fired in one location would increase the strength of their connections onto postsynaptic neurons that tend to fire at a location slightly ahead. As a result of the strengthened connections, the place fields would become larger and shift backwards (that is, in a direction opposite to the rat’s trajectory), because the firing of presynaptic place cells would cause the postsynaptic cells to fire earlier than they did initially. Subsequent experiments confirmed this prediction (Mehta et al., 1997, 2000; Frank et al., 2002; Lee et al., 2004b). The changes in the center of mass of the place fields in these experiments were interpreted as a reflection of underlying synaptic weight changes that encode the learned spatial sequences. This phenomenon was disrupted by NMDA-receptor antagonists (Ekstrom et al., 2001) and was absent in aged rats, which are known to have deficits in spatial learning and in LTP (Shen et al., 1997).
A fundamental question is whether the plasticity mechanisms that generate the backward shift of place fields are specific to hippocampal processing or whether they are present in other brain regions and cause similar effects (Mehta, 2001; Mehta and Wilson, 2000). Evidence from anesthetized cats suggests that similar mechanisms may alter tuning curves of visual cortex neurons (Yao and Dan 2001; Fu et al., 2002). In contrast, Frank et al. (2002) did not observe the backward shift phenomenon in recordings from deep-layer entorhinal cortex neurons, which receive output from CA1. It is thus possible that, among limbic structures implicated in learning and memory, the backward shift phenomenon may be specific to the hippocampus and may indicate a special role of the hippocampus in encoding learned sequences of behaviorally relevant information.
Another class of neurons, head direction cells, is found in various brain areas such as the postsubiculum and thalamus. These cells encode the current head direction and serve as an “internal compass” for the animal, presumably used to set the orientation of the hippocampal place cell system relative to environmental landmarks (Ranck 1985; Taube et al., 1990; Muller et al., 1996b; Leutgeb et al., 2000; Knierim et al., 1995; Yoganarasimha et al., 2006). To test the generality of the backward shift phenomenon in different brain systems related to spatial orientation in behaving animals, the present study examined whether backward shifts also exist in the head direction cells. The results indicated that head direction tuning curves shift backward in ways that are similar, but not identical, to CA1 place fields. The differences suggest that a process that is at least partially independent of the hippocampus causes this backward shift. These results are consistent with the idea that learned sequences of activation states (Hebbian phase sequences) may be a general phenomenon of neural processing in diverse brain regions, useful for prediction of future brain states (i.e., of location or direction) or to fine-tune neural response profiles to take into account the temporal regularities of experience.
Data from this study have been published previously in abstract form (Yu et al., 2005) and in a separate publication that performed a completely separate analysis (Yoganarasimha et al., 2006).
Results
Simultaneous recording of head direction cells and place cells from 6 rats were obtained by 18 tetrodes implanted in the anterior thalamus and the CA1 region while rats ran clockwise (CW) on a textured circular track placed in a cue-controlled environment (Figure 1). After training, 5 recording sessions, which included 3 standard sessions interleaved with 2 mismatch sessions, were given daily for at least 4 consecutive days (except for one rat that experienced only 2 days of recording). The standard sessions (STD-1, STD-2, and STD-3) had the same cue configuration that the rats had experienced during training. In the mismatch sessions (MIS-1 and MIS-2), the proximal cues on the track were rotated counterclockwise (CCW) and the distal cues away from the track were rotated CW by an equal amount (resulting in relative cue mismatches of 45°, 90°, 135°, or 180°). Each session consisted of 15 continuous, unidirectional (CW) laps on the circular track. This experimental design was used to enable a direct comparison of these data with prior data recorded from the CA1 and CA3 regions of the hippocampus, in which region-specific dissociations in the backward shift phenomenon were observed depending on the cue configurations (STD vs. MIS) and on the novelty of the mismatch environments (Lee et al., 2004b).
Figure 1.

Experimental Design
(A) Rats were trained to run clockwise for chocolate sprinkles placed on a centrally placed circular track having four different textured surfaces, each covering one quarter of the track. The circular track was surrounded by a black curtain with distinct distal landmarks placed at the perimeter of the curtain. During training, the relationship between proximal and distal cues remained constant, as shown in the standard (STD-1, STD-2, STD-3) configurations. On recording days, the standard sessions were interleaved with mismatch sessions of different mismatch angles (MIS-1 and MIS-2), in which the circular track was rotated counterclockwise and all the distal cues were rotated clockwise by the same amount, resulting in a total mismatch between proximal and distal cues of 45°, 90°, 135°, or 180°. (B) A photograph of the recording room, with the circular track and 2 of the 6 distal cues. (C) Backward shifts of place fields were previously observed in different hippocampal subfields (CA1 and CA3) while the rats ran stereotyped routes. The aim of the present study was to examine whether backward shifts also exist in the head direction cells.
For head direction cells, head direction tuning curves (HDTCs) were generated by dividing the number of spikes fired when the rat faced a particular direction (in bins of 1°) by the total amount of time the rat spent facing that direction on the circular track (head direction was calculated as the angle between a set of colored LEDs over the rat’s head and a second set of LEDs on a boom arm that extended 15 cm behind the front array and that turned with the rat’s head). For CA1 place cells, in which firing rates are correlated with the rat’s location, the circular track was linearized (in bins of 1°) and place fields were generated by dividing the number of spikes fired when the rat occupied a bin by the amount of time the rat spent in that bin (rat location was calculated as the position on the track of the front set of diodes centered over the rat’s head). After Mehta et al. (1997), the location of a lap place field or the preferred direction of a HDTC was defined as the difference between the center of mass (COM) of the place field or HDTC on an individual lap and the COM of the place field or HDTC averaged over the 15 laps during a recording session. In this paper, the term “backward shift” is applied equivalently to both place fields and HDTCs, referring to a shift in the firing rate distribution of these cells in a direction opposite to the rat’s direction of motion (a positional shift for place fields and a directional shift for head direction cells).
For each rat, an average of 2.3 head direction cells (range 1-5) and 13.7 CA1 place cells (range 1-31) met HDTC or place field criteria in at least one of the five sessions recorded each day. Each cell contributed to multiple analyses, as 5 sessions were run each day for 4 days. In addition, we made no attempt to determine whether the same cells were recorded over many days, as sometimes new cells appeared and other cells disappeared over the course of the 4 days of recording. Most of the HDTC data points (150/208, 72%) were recorded from the anterior dorsal nucleus (ADN) of the thalamus (a data point refers to a tuning curve from an individual recording session, e.g., STD-1 of day 1). A minority (58/208, 28%) of the HDTC data points was recorded outside of ADN and all these non-ADN data points came from one rat (rat 86; see Yoganarasimha et al., 2006 for details). There were no noticeable differences between the ADN head direction cells and non-ADN cells in terms of the COM shifts.
Head Direction Tuning Curves Shift Backward with Laps
The tuning curves of head direction cells demonstrated robust, backward shifts over laps, similar to that previously reported for hippocampal place cells (Mehta et al., 1997, 2000; Ekstrom et al., 2001). Two examples are shown in Figure 2, which plots the directional tuning curves (Fig. 2A) and spike rasters (Fig. 2B) of two head direction cells for each of the 15 laps of a standard session. The preferred direction of cell 1 was approximately 280° on lap 1, and shifted steadily backward with each lap, such that its preferred direction on lap 15 was approximately 250°. A similar shift occurred for cell 2 in a different recording session. Figure 2C plots the gradual backward shift of cell 1 in terms of the difference between the lap-based COM of the tuning curve and the session-based COM (y-axis), as a function of lap number (x-axis). For cell 2, Figure 2C shows that the backward shift occurred mostly in the first 3-4 laps, and the rest of the laps showed no further, consistent shift. In addition to these two typical situations of backward shifts, there were some HDTCs that had no or little backward shifts above random fluctuations. Very rarely did we observe a HDTC that showed unambiguous forward shifts (see below).
Figure 2.

Examples of Backward COM Shifts of Head Direction Cell Tuning Curves
(A) 3D ribbon plot showing the HDTCs for 15 consecutive laps recorded from two backward-shifting head direction cells (not simultaneously recorded). (B) Raster plots of individual spikes generated by the same two head direction cells. (C) Backward shifts of the HDTC for the two head direction cells shown in A were quantified as the COM of each lap relative to the session mean (COM difference). Note the gradual shifts in Cell 1 across the entire session, as opposed to the fast shifts in Cell 2 during the first 3-4 laps only.
Average COM shifts were obtained by sorting data by day and session (Figure 3, top). All but one session (MIS-2 of day 4) showed significant backward shifts measured by linear regression (p < 0.05), and 17 out of 20 sessions showed significant backward shifts measured by unpaired, two-tailed t-tests between the COMs of lap 1 and lap 15 (p < 0.05). Overall, the magnitude of shifts tended to decrease across sessions within a day, as was reported previously for place cells with the same cue manipulation (Knierim, 2002). In some cases, the average shifts resembled cell 1 of Figure 2B, in that the HDTCs shifted backward gradually over many laps (e.g., STD-1 of day 1). In other cases, the average shift resembled cell 2 of Figure 2B, in that most of the backward shift occurred rapidly during the first few laps and reached an asymptote in the later laps (e.g., MIS-1 of day 1). On many days, the shifts combined a fast, initial shift with a gradual shift in later laps. After day 4 (days 5-8), most of the recorded sessions still had statistically significant backward shifts (data not shown).
Figure 3.

Backward COM Shifts in Simultaneously Recorded Head Direction Cells and Place Cells during 4 Days of Recording
Data from all rats (n = 6) are averaged and segregated into the 5 sessions the rats experienced each day (STD-1, MIS-1, STD-2, MIS-2, and STD-3). The COM differences are normalized by the session means. The numbers above each curve are the p-values for the linear regression (upper number) and the t-test between the COMs of lap 1 and lap 15 (lower number). Numbers in boldface denote significantly negative slopes or significant difference between the COMs of lap 1 and lap 15 (p < 0.05). Error bars in the graphs are standard errors.
To test whether the COM shifts could be explained by behavioral variables such as running speed, a number of control analyses were performed. The running speed of the rats tended to decrease over laps, which produced a significant correlation between the overall slope of COM shifts in a session and the slope of changes in the rat’s running speed in the same session (r = 0.452, p = 0.0454). However, at a finer scale, the backward shift between laps was not tightly correlated with the rats’ running velocity each lap, which is consistent with the original report of backward expansion of place fields by Mehta et al. (1997). For example, there was a clear backward shift of the HDTCs in the MIS-1 session of day 1, whereas the average speed remained constant across laps in that session (Figure S1A of the Supplementary Data). Similarly, the average speed on the STD-1 session of day 1 reached a stable value after 5 laps, whereas the COM continued to shift backward in all laps. Thus, although COM shifts and running speed were correlated to a degree, the lap-by-lap dynamics of the backward COM shifts cannot be attributed to changes in running speed across laps (Figures S1B and S1C).
HDTCs Shift Backwards as an Ensemble
It has been suggested in many computational models that head direction cells form a continuously coupled ring attractor, with a fixed phase relationship among these head direction cells (Skaggs et al., 1995; Zhang, 1996; Blair, 1996; Redish et al., 1996; Song and Wang, 2005). Such an attractor model predicts that the head direction cells should maintain a strong coherence of their representation under conditions of backward COM shifts. It is thus important to determine whether all head direction cells shift backwards together as an ensemble or whether only some of them shift backwards and thereby cause the population average to shift accordingly.
COM shifts of 2 simultaneously recorded head direction cells are plotted in Figure 4A. For simplicity, only the three standard sessions are shown and the COM difference is normalized to the common mean of the three standard sessions. In STD-1 and STD-3, both cells showed a gradual backward shift (although the effect was noisy in cell 2 in STD-1). In STD-2, both cells showed evidence of a fast shift between laps 1 and 2 and virtually no shifts thereafter. The two cells also maintained high correlation during the two mismatch sessions (Figure 4B). To quantify the coherence of COM shifts within an ensemble, we calculated the average of all the pairwise correlations between the cells in that ensemble. Among all the rats recorded, we identified 13 cell ensembles that each consisted of 2-5 cells. Because each cell ensemble could have up to 5 sessions (including both standard and mismatch sessions) qualified for data analysis, the total number of HDTC ensembles was 62, and the ensemble analysis below is based on these data.
Figure 4.

HDTCs Shift Backwards as an Ensemble
(A) COM shifts of two simultaneously recorded head direction cells in three consecutive standard sessions. The COM difference of each cell is normalized to the common mean of the three standard sessions for that cell, rather than the mean of individual sessions. The inset shows the averaged HDTC during the three standard sessions. (B) Averaged pairwise correlation coefficients from 62 HDTC ensembles plotted against the COM slopes of the ensembles. The COM slope of an ensemble is calculated by linear regression of all the COM data points in the ensemble and the significance level of the regression is indicated by different symbols (red triangles: significant; blue circles: non-significant). Each correlation coefficient reflects the coherence among HDTCs from an ensemble during COM shifts. The three standard session HDTC ensembles plotted in Figure 4A and the two mismatch session HDTC ensembles from the same day are highlighted here. A plot of the averaged pairwise correlations as a function of individual HDTC COM slopes (instead of combined ensemble slopes) revealed similar results (data not shown). The inset shows the histograms of individual pairwise correlation coefficients. The distribution of individual correlations for the ensembles with significant COM shifts (red) was highly skewed toward large values, whereas the distribution of correlations for ensembles with nonsignificant COM shifts (blue) was more symmetric and contained both high and low values.
Figure 4B plots all of the averaged pairwise correlations as a function of the COM slope of the HDTC ensemble (the three standard HDTC ensembles plotted in Figure 4A and the two mismatch HDTC ensembles from the same cells are highlighted). When the HDTC ensemble showed unambiguous backward COM shifts (slope < -0.5), almost all correlations had high values (> 0.4), indicating that the HDTCs in these ensembles maintained high coherence when they shifted backwards. When the HDTC ensemble had small backward or forward COM shifts (slope > -0.5), some correlation values were still relatively high, indicating that the corresponding ensembles still maintained coherence even when they did not shift backwards by a great amount or when the backward shift was nonlinear (as in the STD-2 example in Figure 4A). The low correlations that occurred when there was little backward shift of the ensemble likely reflect the normal lap-by-lap fluctuations in the COM, as a result of sampling error or firing variability, that are distributed randomly among the different laps of a session, and therefore should not be regarded as an indication of low ensemble coherence. These lap-by-lap fluctuations did not result in low correlations when there were greater backward shifts because the strong COM shifts in such cases would dominate the calculation of correlation.
Differences between HDTCs and CA1 Place Fields in Backward COM Shift
Experience-dependent backward COM shifts in CA1 place fields have been observed in several previous studies (Mehta et al., 1997, 2000; Ekstrom et al., 2001; Knierim, 2002; Frank et al., 2002; Lee et al., 2004b). CA1 data obtained in the present study further confirmed this result (Figure 3, bottom). Overall, 15 (linear regression) or 12 (unpaired, two-tailed t-test between lap 1 and lap 15) out of 20 sessions showed significant (p < 0.05) backward shifts of the average place field COM, many more than expected by chance with an alpha level of 0.05. The first mismatch session (MIS-1) of day 1 showed no significant COM shifts (p = 0.66 and p = 0.19 respectively), but the second mismatch session (MIS-2) of that day showed a robust effect (p = 0.0009 and p = 0.026 respectively). The first mismatch session of day 2 showed apparent COM shifts, although both statistical tests were not significant (p = 0.28 for linear regression; p = 0.073 for unpaired t-test between lap 1 and lap 15). This lack of significance of the linear regression was probably the result of the nonlinear backward shift in this session, as the place fields showed a striking backward shift on the first 4 laps and were stable (or even slightly forward shifting) for the remaining 11 laps. Days 3-4 showed significant backward shifts (p < 0.05 in at least one of the two tests) in all standard and mismatch sessions. These data replicated the results of Lee et al. (2004b), showing that CA1 place fields on average do not show the backward shift on the rat’s first experience in the cue-mismatch environment (day 1, MIS-1), but show the effect on subsequent mismatch sessions and in the standard sessions.
Although both HDTCs and CA1 place fields demonstrated similar backward shifts, there were several important differences between the two classes of neurons. First, HDTCs shifted backward in both standard and mismatch sessions on day 1, whereas CA1 place fields did not shift backward during the animal’s first experience in the mismatch condition (day 1, MIS-1). This difference between the place fields and the HDTCs suggests that the HDTCs are less sensitive to environmental changes than the CA1 place fields (Lee et al., 2004b).
Second, the distributions of individual shift magnitude were markedly different between the two populations (Figure 5; Kolmogorov-Smirnov test, p < 0.001). The difference was the result of a number of factors. The distribution of COM-shifts for HDTCs was negatively skewed (skewness = -0.51), whereas the distribution for place fields was more symmetric (skewness = +0.22). The HDTCs also had a significantly tighter distribution than the place fields (p < 0.001, two-tailed variance ratio test). The average magnitude of the HDTC shifts was larger than place fields, and this was true for all days of recording. A 2-factor ANOVA (cell type × day) indicated that the COM shifts in the head direction cells were significantly larger than those in the place cells (p = 0.012) but there was no significant difference of COM shifts across different days (p = 0.175) and no interaction between the two factors (p = 0.927). This difference in the shift amount was due mainly to the presence of both backward and forward shifts in place fields, whereas HDTCs rarely shifted forward. Among the 208 HDTCs examined, only 2 (1%) showed unambiguous forward shifts (i.e., slope > 0.5 degrees/lap). By contrast, 70 out of 606 (12%) CA1 place fields had unambiguous forward shifts (consistent with recent reports that CA1 place fields can shift forward under appropriate circumstances; Lee et al., 2006). When only the backward shifts (i.e., the units with negative slopes) of the two populations were compared, the two distributions were not significantly different (Kolmogorov-Smirnov test, p > 0.4; Mann-Whitney test, p > 0.6). Because of the increased variability of the CA1 distribution, the highest magnitude shifts (both forward and backward) occurred in place fields, not HDTCs. Thus, the larger mean shift of HDTCs should not be interpreted as a tendency for HDTCs to shift by a larger amount than place fields, but rather as an indicator of the increased heterogeneity of the place field shifts.
Figure 5.
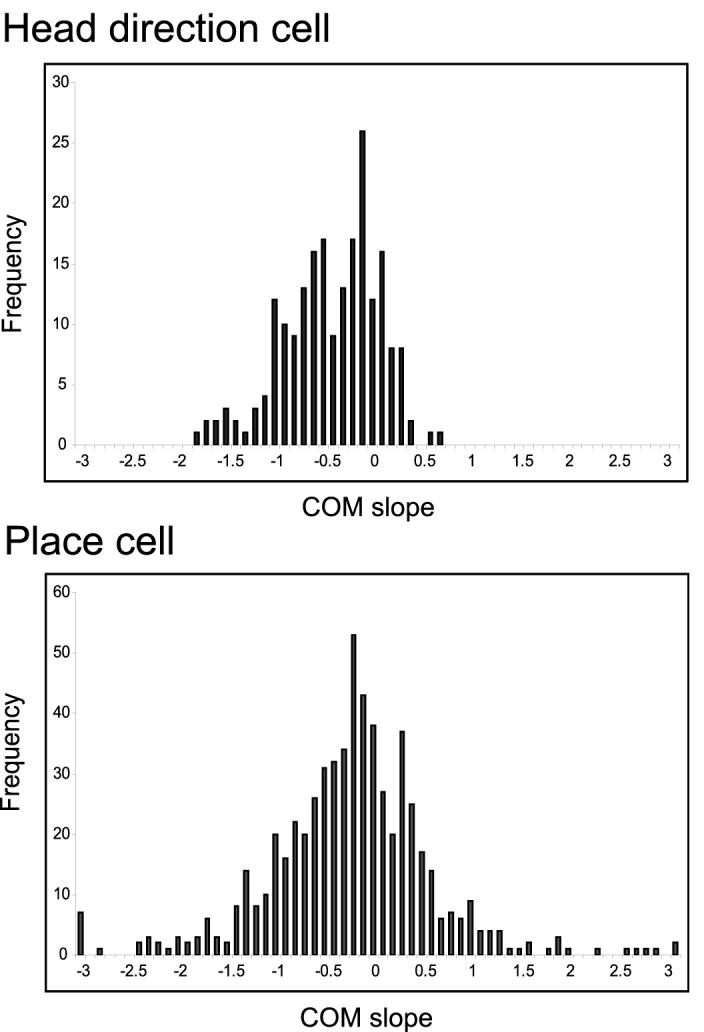
Histograms of COM-Shift Slopes (Simple Linear Regression) of 208 Individual HDTC Shifts and 606 Individual Place Field Shifts
Negative slopes correspond to backward shifts and positive slopes correspond to forward shifts. HDTC shifts have a narrower but skewed distribution while the place field shifts have a wider but approximately symmetric distribution. Both Kolmogorov-Smirnov and Mann-Whitney tests show a significant difference between the two distributions (p < 0.0001 and p = 0.0002 respectively).
Third, the head direction cells partially reset to their initial preferred directions between same-day recording sessions, while the backward shifts in the CA1 place cells showed little evidence of a reset within a day. Figure 6 compares the COM shifts across three standard sessions (STD-1, STD-2, and STD-3) recorded in the same day. (This analysis was limited to the standard sessions, because the tuning curves rotated to new, sometimes arbitrary, directions when the proximal and distal cues were counter-rotated in the mismatch sessions.) In contrast to the previous analyses, COM differences were normalized to the mean of all three standard sessions rather than the mean of individual sessions, so that relative changes between sessions could be meaningfully compared. Among all the standard session data points collected in the 4 days (122 for the HDTC and 355 for the place fields), 87 HDTC data points (87/122, 71%) and 204 place field data points (204/355, 57%) were recorded from cells that had all three standard sessions qualified for data analysis (i.e., acceptable isolation quality and no large shifts > 18° in preferred head direction between first lap and the session mean; see Experimental Procedures) and maintained similar preferred directions or firing locations across the three standard sessions (difference between session-averaged preferred firing directions/locations < 35°). The analysis was restricted to this subset of cells (although less restrictive exclusion criteria did not change the results; Figure S2C). On average, the COM of the head direction cells shifted from 6.5° back to -2.5° (normalized by the average) in STD-1, and from 2° back to -4° in both STD-2 and STD-3. Therefore, between STD-1 and STD-2, the head direction cells relaxed back approximately 50% of the COM shift that occurred in STD-1, and showed a similar reset in STD-3. Figure 3 indicates that the resetting may have occurred most strongly on day 2, as the backward shifts in the STD-2 and STD-3 sessions of that day are larger than on days 1, 3, and 4. However, when the analysis of Figure 6 was repeated using only the data from days 1, 3, and 4, the patterns of reset were not appreciably altered (Figure S2). In contrast to the HDTCs, the place fields had much less resetting between STD-1 and either of the later standard sessions (Figure 6, bottom). When we compared the COM difference between the last lap of the preceding standard session (lap 15 of STD-1 and lap 15 of STD-2) and the first lap of the succeeding standard session (lap 1 of STD-2 and lap 1 of STD-3, respectively), the HDTCs showed a significantly higher difference (-5.2° on average) than the CA1 place fields (-0.2° on average; p = 0.03). Considering that there was a mismatch session between every two standard sessions, the time course for the HDTC resetting appeared to be on the order of an hour, although the exact time course is confounded by potential influences of the intervening mismatch sessions. The time course for the place field resetting is hard to estimate from our current experiment. Combined with previous observations that the COM of the place fields reset back to baseline everyday (Mehta et al., 1997, 2000), the time course for the place field resetting appeared to be on the order of several hours.
Figure 6.
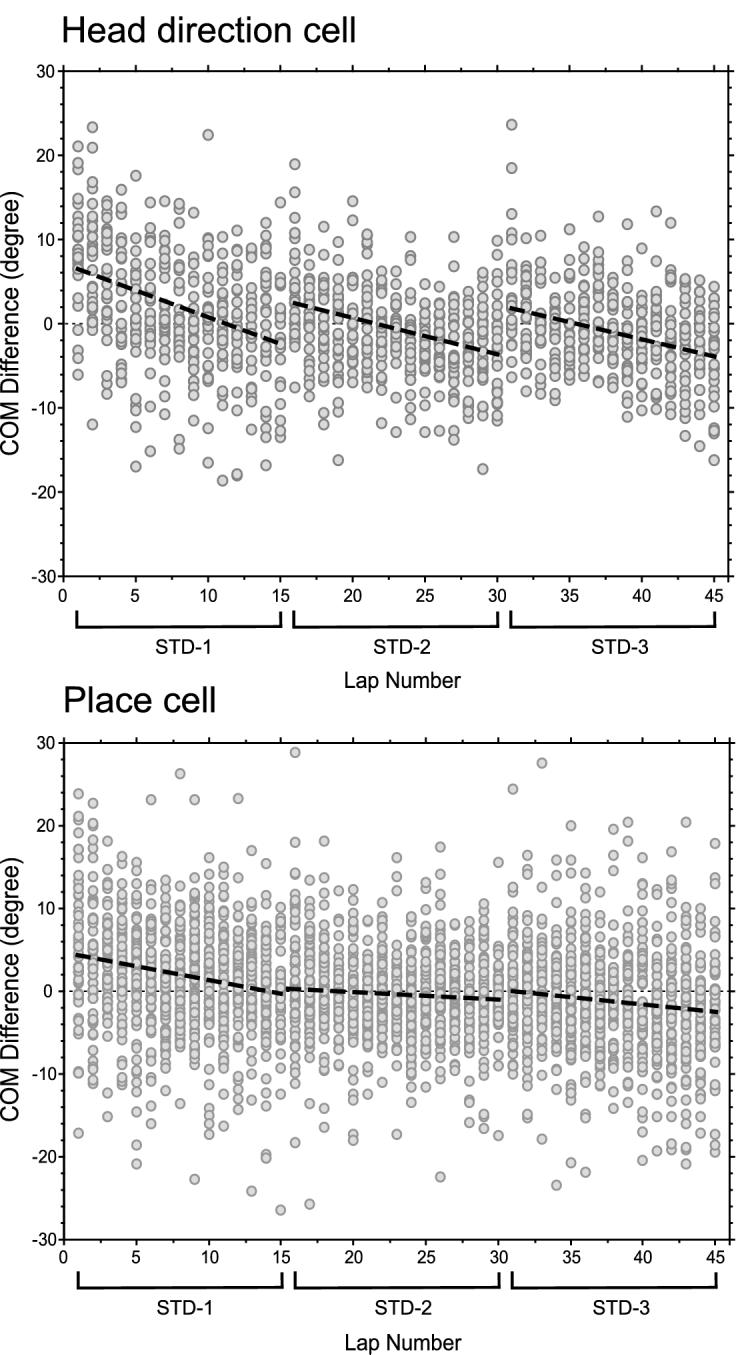
Resetting of COM Shifts between the Three Standard Sessions
Data from all 6 rats during 4 days of recording are combined. Laps 1-15 are from STD-1, laps 16-30 are from STD-2, and laps 31-45 are from STD-3. The dashed lines are the regression lines of each session. In between standard sessions, the preferred direction of head direction cells tended to partially reset back to the initial preferred direction of the first standard session, whereas the place field firing locations did not reset as quickly. (See Figure S2 for further analysis.) The time course for the resetting in the head direction cells appears to be on the order of an hour. The time course for the resetting in the place cells is hard to estimate from our current experiment but appears to be on the order of several hours (Mehta et al., 1997).
HDTCs do not show consistent changes in skewness, size, width, or maximum firing rate
Mehta et al. (2000) reported that the backward shifts of hippocampal place fields were caused by changes in symmetry of the place fields, as the place fields were initially symmetric and became negatively skewed with experience. In addition, the size of the place fields increased (Mehta et al., 1997, 2000). In the present study, no consistent changes in skewness within a session were found in the HDTCs or place fields, using several different analyses (Figure S3). The lack of a change in skewness of CA1 place fields is consistent with other studies (Lee et al., 2004b). There were some consistent changes in the size of CA1 place fields, measured by the integrated size of the place field and the maximum firing rate (Figures S4 and S5). In early sessions, the size of place fields tended to increase during the session, whereas in later sessions the size tended to decrease. However, there was no consistent change in the width of the place field (Figure S6), consistent with a prior report by Lee et al. (2004b). In contrast, HDTCs did not show consistent changes in these measures of tuning curve size. Although the integrated size of HDTCs increased significantly in 7 of 20 sessions and decreased in only 1 of 20 sessions, these changes were not consistent with the other measures of tuning curve size (Figures S4-S6). As argued previously (Lee et al., 2004b), the COM-shift phenomenon appears to be the most consistent measure of changes in tuning curve (or place field) properties during these stereotyped routes, with changes in the shape of the tuning curve more sensitive to the precise parameters of the behavioral task or performance.
Discussion
When rats run along stereotyped routes, CA1 and CA3 place fields shift backwards slightly, in a direction opposite to the direction of movement of the rat (Mehta et al., 1997, 2000; Lee et al., 2004b). This phenomenon is disrupted by NMDA receptor antagonists (Ekstrom et al., 2001), suggesting that it may be a reflection of LTP-dependent, synaptic-weight changes between place cells that encode particular locations and place cells that encode locations that tend to occur in the near future (i.e., temporal sequences of locations along a learned route). This result is consistent with predictions from a number of computational models of temporally asymmetric induction of LTP (Levy, 1996; Blum and Abbott, 1996; Lisman, 1999), and may be a correlate of Hebb’s notion of a phase sequence (Hebb, 1949; Ekstrom et al., 2001). The present study demonstrates that a phenomenon very similar to the backward shift of place cells occurs in the head direction cell system of the thalamus. These results provide striking evidence that the encoding of sequences of neural states may be a general phenomenon common to many sites in the brain, consistent with Hebb’s phase sequence notion.
Under most experimental conditions, the place cell system and the head direction cell system are tightly coupled to each other (Taube et al., 1990; Muller et al., 1996b; Knierim et al., 1995, 1998; Knierim, 2005). It is thus possible that the backward shift of the HDTCs in the present study is a passive reflection, via feedback pathways, of the backward shift of place fields. Alternatively, it is possible that the backward shift of place fields in these experiments is a passive reflection of the HDTC shift demonstrated here (i.e., head direction cells change their preferred firing directions, which cause hippocampal afferents and hippocampal place fields to shift backward accordingly). However, a number of results in the present study favor the argument that the backward shift phenomena in place cells and head direction cells are at least partially independent.
In line with prior results that demonstrate that individual place cells and head direction cells may not be tightly coupled under some circumstances (Knierim 2005; Yoganarasimha et al., 2006), the present study demonstrates a number of quantitative differences between the backward shifts of simultaneously recorded CA1 place cells and ADN head direction cells. (1) The pattern of HDTC backward shifts across sessions and across days is not the same as either the CA1 pattern (Figure 3) or the CA3 pattern (Lee et al., 2004b). Figure 3 demonstrates that the CA1 place cell population did not show the backward shift on the first mismatch session of day 1, whereas the head direction cells showed the effect. Moreover, in a prior study under the same conditions (Lee et al., 2004b), CA3 place cells did not show the backward shift in standard sessions or in the mismatch sessions after day 1, whereas the head direction cells in the present study showed the effect in almost all sessions (standard and mismatch). (2) The distributions of individual shift magnitudes were different between CA1 place cells and head direction cells, in that the CA1 distribution was more heterogeneous than the HDTC distribution (Figure 5). (3) HDTCs reset partially back to their initial preferred direction at the start of each standard session on a given day, whereas CA1 place fields reset little, if at all, in the second and third standard sessions (Figure 6). These differences argue strongly against the interpretation that one group of cells inherits passively the backward shift property from the other group of cells. Taken together, the quantitative differences in the details of the backward shift phenomenon suggest that some process that is at least partially independent in the two systems is active to produce the backward shifts of place fields and HDTCs.
A number of follow-up experiments will be necessary to test further whether the head direction cell system actively encodes learned sequences of head direction representations. Most importantly, the phenomenon must be shown to depend on neural plasticity mechanisms, as was done with place cells (Ekstrom et al., 2001). There are a number of candidate synapses. ADN head direction cells are thought to derive their firing selectivity from the lateral mammillary nucleus (LMN) (Stackman and Taube, 1998; Blair et al., 1998, 1999). Thus, the synapse from the LMN to the ADN may be the site of this plasticity. ADN receives feedback from the postsubiculum (PoS, also known as the dorsal presubiculum), which also contains head direction cells (Taube, 1998). This region may be the site of binding of representations of landmarks to the head direction cell system, to align and calibrate the self-motion-based head direction system with the external world (McNaughton et al., 1991; Goodridge and Taube 1997). It is conceivable that the backward shift originates from plasticity between head direction cells in the PoS or between the PoS and the ADN. There is evidence that NMDA receptors are present in both the presubiculum (Ma et al., 1997) and the ADN (Khan et al., 2000), so cells in both regions may be capable of supporting the temporally asymmetric LTP that would give rise to a backward shift of HDTCs. However, it is not known whether LTP occurs at these synapses.
The tighter distribution of the shifts in the head direction cells compared to the place cells (Figure 5) could be due to the different network architectures that underlie these two systems. CA1 place fields had a majority of backward shifts and a minority of forward shifts. The HDTCs had a much narrower distribution that was skewed toward the backward shifts. The narrower distribution may be the result of strong coupling among the neighboring head direction cells in a ring attractor network (Skaggs et al., 1996; Zhang 1996; Goodridge and Touretzky, 2000; Sharp et al., 2001; Song and Wang, 2005). Similar to the strong coupling between the head direction cells in terms of their near-total control by the distal landmarks in these experiments (Yoganarasimha et al., 2006), this coupling was strong enough to prevent any individual HDTC from deviating too far away from the population mean (which was a backward shift) by undergoing forward shifts. Because of the lack of such strong coupling among CA1 place cells (Shapiro et al., 1997; Knierim, 2000; Lee et al., 2004a; Yoganarasimha et al., 2006), shifts in the CA1 place fields may have been less constrained by network-level processes and therefore had a wider distribution around the mean.
The resetting of the backward shift (Figure 6) is a key piece of evidence that the phenomena are at least partially independent in the two brain areas. Previous reports have shown that the backward shift resets on the order of hours in CA1 (Mehta et al., 1997, 2000; Lee et al., 2004b), whereas the shift does not appear to reset at all in CA3, suggesting that the CA3 network may be the permanent store of the spatiotemporal sequences of place cells (Lee et al., 2004b). The present data show that the backward shift of the HDTCs resets at a time scale even faster than that of CA1. This may be the result of a shorter-lasting form of plasticity in the head direction circuit, in which the increase in strength decays with a time constant on the order of tens of minutes. Alternatively, the difference may be a reflection of the patterns of activity in the place cell system vs. the head direction cell system in the time periods between recording sessions. Mehta (2001) speculated that the CA1 place fields may reset between sessions as the result of different sequences of activity of the same place cells as the rat experiences other environments or sleeps. In this explanation, cells that fired in a stereotyped order during the experiments may fire in reversed or uncorrelated order during other behaviors and during sleep, thus weakening (through LTD) the synapses back to baseline levels. In the present experiment, the rats were placed on a holding pedestal for approximately 10-15 min in between recording sessions. In that brief time, it is unlikely that the same place cells that fired during behavior would fire in reverse sequence often enough to cause a depotentiation of synapses, largely because the cells would be silent on the pedestal if the rat was alert (because they would be unlikely to have a place field on the pedestal) or would tend to fire in the same order during sharp waves in slow-wave sleep if the rat were asleep or in quiet wakefulness (Skaggs and McNaughton 1996; Louie and Wilson, 2001; although see Foster and Wilson, 2006). However, the same head direction cells would fire on the pedestal as on the behavioral track, as head direction cells show the same preferred directions relative to each other in all environments. The many paired CW and CCW turns that the rat makes in between recording sessions may be enough to partially “erase” the potentiation that occurred during the CW-running session, thereby resetting the system almost entirely between each recording session.
The development of negative skewness in hippocampal place cells was convincingly demonstrated in some studies (Mehta et al., 2000) but not in other studies (Mehta et al., 1997; Ekstrom et al., 2001; Dragoi et al., 2003; Huxter et al., 2003), including the present study. Changes in skewness also vary between different hippocampal regions, as the development of negative skewness was evident in CA3 but not in CA1 (Lee et al., 2004b). The issue of skewness is complicated by the way lap place fields/HDTCs are defined (Mehta et al., 2000; Frank et al., 2002). In the present study, a lap-based analysis based on one set of criteria for defining the HDTC caused an artificial negative skewness at the beginning that changed to a symmetric tuning curve at the end of a session (Figure S3). This effect diminished when the boundaries of the tuning curve were extended or when the question was analyzed in a way that did not rely on the definition of the tuning curve boundaries. Because the skewness of place fields (or receptive field directional tuning curves, etc.) may arise from weak firing at the tails of the firing distribution, these criterion effects may lead to incorrect conclusions about whether the place fields in a study are symmetric or skewed. In addition, a modeling study suggested that, even though the underlying distribution of synaptic weights onto a place cell may be robustly skewed, the spiking output of the cell may filter out the skewness and show a more symmetric place field (Yu et al., 2006). These considerations reinforce the argument of Lee et al. (2004b) that the change of skewness may be a less robust effect than the backward shift of the center of mass, which appears to be less sensitive to such factors as analytical methods, experiment paradigms, and recorded brain areas.
The head direction cell system is thought to act as an orienting signal that integrates self-motion information and visual landmarks to set the orientation of the spatial representations of the hippocampus and parahippocampal areas (McNaughton et al., 1996; Muller et al., 1996a; O’Keefe and Burgess, 2005; Knierim, 2005; Yoganarasimha and Knierim, 2005; Sargolini et al., 2006). One question that arises from the present results is whether there is any ethological significance to the backward shift of the HDTCs demonstrated here. This is a difficult question to address, as there is little conclusive evidence that the rat uses the head direction signal directly to control its behavioral choices (Muir and Taube 2004; Frohardt et al., 2006). It is conceivable that this shift is part of a network mechanism that allows the brain to predict the likely next head direction based on the current direction and other contextual information (e.g., the current location), perhaps allowing more efficient performance in a well-learned task. Alternatively, the backward shift phenomenon may have no overt consequences for behavior, but rather may be an epiphenomenon of neural plasticity rules that are necessary for proper formation and maintenance of the circuitry underlying the head direction signal (e.g., attractor networks). In this regard, it would be interesting to determine whether this effect is related to the description of anticipatory firing of head direction cells in a number of brain regions (Blair and Sharp, 1995; Blair et al., 1998; Taube and Muller, 1998). The backward shift may occur only under the artificial constraints imposed by the experimental situation, similar to effects generated on receptive field locations and orientation tuning under tightly controlled conditions of temporally asymmetric visual stimulation of cat visual cortex (Yao and Dan 2001; Fu et al., 2002). Regardless of the ultimate functions of the mechanisms that underlie the backward shift, these data demonstrate that the effect may be a general phenomenon in the brain of the behaving animal, and suggest that the head direction cell system incorporates robust synaptic plasticity in its normal functioning, allowing trial-by-trial changes in the effective connectivity of the network. This plasticity, and the slow kinetics of the NMDA receptors presumably associated with it, may be necessary for the maintenance of persistent neural activity and for promoting stability in the attractor networks thought to underlie the head direction cell signal (Wang, 1999; Song and Wang, 2005).
Experiment Procedures
Subjects and Surgery
For detailed description of surgery, training and recording procedures, see Yoganarasimha et. al. (2006). In brief, six male Long-Evans rats, 5 months old and weighing approximately 600 g at arrival, were housed individually on a 12:12 h reversed light-dark cycle. During behavioral training and recordings, they were maintained at 80-90% of their free-feeding weights and the recordings were performed during the dark portion of the light-dark cycle. Animal care and all surgical procedures were performed according to National Institutes of Health (NIH) and University of Texas Health Science Center at Houston Institutional Animal Care and Use Committee (IACUC) guidelines.
Under surgical anesthesia, a custom-built recording drive (hyperdrive), comprising 18 independently movable tetrodes (an anterior bundle with 11 tetrodes, aimed at the anterior dorsal nucleus of the thalamus, and a posterior bundle with 7 tetrodes, positioned 1.6 mm posterior and 0.3 mm lateral to the center of the anterior bundle, aimed at the CA1 layer of the hippocampus), was implanted over the right hemisphere. Each bundle also contained a reference electrode for differential recording.
Training and Recording
After 7 days of postsurgical recovery, the rats were trained to run clockwise (CW) for food reward on a circular track (56 cm inner diameter, 76 cm outer diameter), consisting of four different textured surfaces that served as proximal cues, each covering one quarter of the track. The food reward (approximately two rewards per lap) was delivered at variable locations on the track each lap, such that there was no defined goal location and the rat did not stop between laps. The circular track was placed in the center of the behavior room, surrounded by a black curtain reaching from ceiling to floor, with the distal cues either hanging on the curtain or standing on the floor at the perimeter of the curtain (Figure 1). The room was illuminated with a 25W bulb on the ceiling, centered over the track, and a white-noise generator was placed beneath the table on which the circular track stood to mask external sounds. All rats were trained daily for 30 min over a period of 8-10 days and the relationship between the proximal and distal cues was kept constant throughout the training session (i.e., the standard cue configuration shown in Figure 1). Meanwhile, the tetrodes were advanced to the CA1 layer of the hippocampus and to the ADN of the thalamus while the rat occupied a small holding dish in a room outside the behavioral room. The CA1 layer was identified by the presence of sharp waves and ripples in the local field potential (Buzsaki, 1986) and the sudden appearance of extracellular action potentials as the tetrodes entered the pyramidal cell layer. Head direction cells were identified as the tetrodes were advanced into the thalamus by turning the rat passively on a turntable while listening for the characteristic brisk, directional tuning of these cells. All cells that had directional tuning on the turntable also had directional tuning on the track in the behavioral room.
During recording days, baseline data were collected before and after the behavioral sessions for about 20-30 min, while the rat sat quietly or slept on the turntable next to the computer outside the behavior room. In between the two baseline sessions, five behavioral sessions of 15 laps each were run, with three standard sessions interleaved with two mismatch sessions. The cue configuration in the standard sessions was the same as that of the training sessions, while in mismatch sessions, the proximal and distal cues were rotated equally in opposite directions (proximal-CCW; distal-CW) to produce a mismatch amount of either 45°, 90°, 135°, or 180° between them. The amount of cue mismatch was selected in pseudorandom manner, so as to enable 4 sets of each mismatch amount over 8 days for all rats (except for rat 114, which had only one set of each mismatch session over two recording days).
All recordings were performed using the Cheetah Data Acquisition System (Neuralynx, Tucson, AZ). The position and direction of the rat’s head were calculated by recording the LEDs on the headstage through a color CCD camera (Model 1300, Cohu, Inc., San Diego, CA) mounted on the ceiling and captured by a video frame grabber (DT3120, Data Translation, Inc., Marlboro, MA) at 30 Hz. At each frame, the center of mass of all blue and red pixels (circular array of 5 red and 5 blue LED’s on the rat’s head) was calculated as the position of the rat, and the angle between the center of mass of all blue and red pixels and the center of mass of all the green pixels (2 green LED’s on the boom arm; 15 cm from the center of red and blue LED’s) was calculated as the head direction.
Histology
On completion of behavioral experiments, marker lesions were made on a subset of tetrodes and the rat was perfused transca microtome and stained with cresyl violet. Electrode tracks were identified and assigned to the area of recording, based on histological results and electrophysiological depth profiles that were collected during experiments.
Data Analysis
Off-line unit isolation and selection criteria.
Single units were isolated offline, using a custom interactive program running on a PC. Primarily, the relative amplitudes of neural signals recorded simultaneously on four wires of a tetrode at four slightly different locations were used for the single-unit isolation, although additional waveform parameters, such as spike width and height, were also used for isolation. Based on the size of the waveforms in relation to background firing and on the closeness and degree of potential overlap between neighboring clusters, the isolation quality of clusters were rated on a scale of 1 (very good isolation) to 4 (marginal isolation). All those cells rated as “marginal isolation” were excluded from analysis (Figure S7). Further, in the case of CA1 place cells, only those cells that met the following place-field criteria were used for further analysis: (1) the spatial information score was ≥ 1.0 bit; (2) the cell fired ≥ 50 spikes, a minimum number to ensure reliability of the spatial information score; (3) the statistical significance of the information score was p < 0.01 (Skaggs et al., 1993; Skaggs et al., 1996); and (4) the cell fired at least 2 spikes in at least 8 out of the first 10 laps of the session (this criterion ensured that the COM shift could be meaningfully measured and compared between cells),.
Creation of Place Field and Head Direction Tuning Curves.
Head direction tuning curves were generated by dividing the number of spikes fired when the rat faced a particular direction (in bins of 1°) by the total amount of time the rat spent facing that direction on the circular track. (Because of the circular nature of the track and the regular behavior of the rats, head direction was highly correlated with position in this task; see Figure S8. Although we used head direction data points from all positions on the track, the majority of firing of a particular head direction cell occurred at one location on the track.) For CA1 place cells, the circular track was linearized (in bins of 1°) to generate one-dimensional firing rate arrays by dividing the track into equal sized position bins and, for each bin, dividing the number of spikes fired by the amount of time the rat occupied that bin. For place cells, spikes that occurred when the rat’s head was positioned off the track were excluded, as these off-track positions were not sampled consistently across sessions.
There were three types of tuning curves (including HDTCs and place fields) used in this study: session-based tuning curves, lap-based tuning curves, and spike-epoch-based tuning curves. Session-based tuning curves (or session tuning curves) were generated from all the spikes fired in a session. Different criteria were used to determine the boundaries for the session HDTC and the session place fields because of the different firing patterns of head direction cells and place cells. Following Mehta et al. (1997), the boundaries for the session place field were defined by the bins that fell below 10% of the peak firing rate for 20 contiguous bins. For the session HDTC, the criteria were 5% of the peak rate and 1 bin, as these values more accurately delimited the boundaries of the more continuous tuning curves of head direction cells, compared to place cells.
Lap-based tuning curves (or lap tuning curves) were defined after the boundaries for the session tuning curves had been determined. For both the HDTCs and the place fields, the lap tuning curves were based on the firing within the boundaries defined by the session tuning curve. Because head direction cells’ preferred directions can sometimes drift by large amounts relative to the landmarks in an environment, especially to correct an error in the initial setting of the preferred direction at the beginning of a session (Knierim et al., 1995; Zugaro et al., 2003; Yoganarasimha et al., 2006; Knierim, 2006), it was necessary to exclude such cases from the analysis in order to avoid biasing the results. Accordingly, all first-lap COMs (normalized by the session mean) were plotted in a histogram and cells with a first-lap COM that was greater than 18° (i.e., twice the standard deviation) were excluded from data analysis. This exclusion also helped ensure the data were not biased by an artificial truncation of the tails of the tuning curves of drifting cells (i.e., a boundary set by the session-based tuning curve may fall within the middle of the first lap-based tuning curve if the cell drifted during the first lap; see Figure S3A). Because the skewness measure is also highly sensitive to spikes at the tails of the distribution, analyses were also performed in which the boundaries of the tuning curves were extended by 25° in each direction (Figure S3B).
Another approach to avoid truncated lap-based tuning curves was to use spike-epoch-based tuning curves. An epoch was defined as an episode of spikes fired during a single, complete passage (sweep) of the rat’s head direction through the HDTC. Technically, the epochs were identified by applying a firing rate threshold of 50% of the session average firing rate (corresponding to approximately 5-10% of the peak firing rate, to be consistent with the lap-based analysis) to find episodes of spikes that met the following criteria: the movement of the rat’s head spanned at least 20° in direction, the rat traveled at least 20° in distance along the track, the cell had a peak firing rate ≥ 30 Hz during the epo ch, and the spike train consisted of at least 40 spikes. We used two ways of defining the boundaries of epochs. One method used directly the time stamps when the firing rate crossed the threshold and the other extended these time stamps by 1 second in both directions. The latter approach was intended to ensure that the “tails” of the epoch-based tuning curves were included. In any case, epoch boundaries were not restricted by the session HDTC so the problem of potentially truncated HDTCs was avoided.
Lap COMs within a session were fit with a linear regression and the slope of the line and the significance level of the slope were used as the primary measure to quantify the shift amplitude. Although the COM shifts of the place fields or HDTCs often were not linear across the entire session, the linear regression was used because in most cases it provided a useful, direct measure of the backward-shift effect and was, if anything, a conservative measure of the phenomenon. The only exception in which it appeared that there was a nonlinear shift that did not result in a significant linear regression was the MIS-1 session of day 2 for place cells (Figure 3). Because there was no a priori rationale to fit some sessions with a linear regression and some with an exponential function, and because doing so would make direct comparisons difficult, it was decided to use only linear regressions to quantify the data. As a second measure, we used the COM difference between lap 1 and lap 15 to quantify the shift amount within a session and the unpaired t-test to measure the significance level of any difference. Visual inspection of the results indicates that none of the conclusions reached would differ depending on which measure was used.
Supplementary Material
Acknowledgements
We thank Inah Lee for help with data acquisition and software development and for valuable comments on the manuscript; Geeta Rao for help with data acquisition; and Jeffery S. Taube and Hugh T. Blair for providing information on LTP and head direction cells. This work was supported by NIH grants R01 NS39456 and K02 MH63297 and by NSF grant 0344213.
References
- August DA, Levy WB. Temporal sequence compression by an integrate-and-fire model of hippocampal area CA3. J. Comput. Neurosci. 1999;6:71–90. doi: 10.1023/a:1008861001091. [DOI] [PubMed] [Google Scholar]
- Bi GQ, Poo MM. Synaptic modifications in cultured hippocampal neurons: dependence on spike timing, synaptic strength, and postsynaptic cell type. J. Neurosci. 1998;18:10464–10472. doi: 10.1523/JNEUROSCI.18-24-10464.1998. [DOI] [PMC free article] [PubMed] [Google Scholar]
- Blair HT, Sharp PE. Anticipatory head direction signals in anterior thalamus: Evidence for a thalamocortical circuit that integrates angular head motion to compute head direction. J. Neurosci. 1995;15:6260–6270. doi: 10.1523/JNEUROSCI.15-09-06260.1995. [DOI] [PMC free article] [PubMed] [Google Scholar]
- Blair HT. Simulation of a thlamocortical circuit for computing directional heading in the rat. In: Touretzky DS, Mozer MC, Hasselmo ME, editors. Advances in Neural Information Processing Systems. MIT Press; Cambridge, MA: 1996. pp. 152–158. [Google Scholar]
- Blair HT, Cho J, Sharp PE. Role of the lateral mammillary nucleus in the rat head direction circuit: a combined single unit recording and lesion study. Neuron. 1998;21:1387–1397. doi: 10.1016/s0896-6273(00)80657-1. [DOI] [PubMed] [Google Scholar]
- Blair HT, Cho J, Sharp PE. The anterior thalamic head-direction signal is abolished by bilateral but not unilateral lesions of the lateral mammillary nucleus. J. Neurosci. 1999;19:6673–6683. doi: 10.1523/JNEUROSCI.19-15-06673.1999. [DOI] [PMC free article] [PubMed] [Google Scholar]
- Bliss TV, Lømo T. Long-lasting potentiation of synaptic transmission in the dentate area of the anaesthetized rabbit following stimulation of the perforant path. J. Physiol. 1973;232:331–356. doi: 10.1113/jphysiol.1973.sp010273. [DOI] [PMC free article] [PubMed] [Google Scholar]
- Blum KI, Abbott LF. A model of spatial map formation in the hippocampus of the rat. Neural Comput. 1996;8:85–93. doi: 10.1162/neco.1996.8.1.85. [DOI] [PubMed] [Google Scholar]
- Buzsaki G. Hippocampal sharp waves: Their origin and significance. Brain Res. 1986;398:242–252. doi: 10.1016/0006-8993(86)91483-6. [DOI] [PubMed] [Google Scholar]
- Dragoi G, Harris KD, Buzsaki G. Place representation within hippocampal networks is modified by long-term potentiation. Neuron. 2003;39:843–853. doi: 10.1016/s0896-6273(03)00465-3. [DOI] [PubMed] [Google Scholar]
- Ekstrom AD, Meltzer J, McNaughton BL, Barnes CA. NMDA receptor antagonism blocks experience-dependent expansion of hippocampal “place fields”. Neuron. 2001;31:631–638. doi: 10.1016/s0896-6273(01)00401-9. [DOI] [PubMed] [Google Scholar]
- Foster DJ, Wilson MA. Reverse replay of behavioural sequences in hippocampal place cells during the awake state. Nature. 2006;440:680–683. doi: 10.1038/nature04587. [DOI] [PubMed] [Google Scholar]
- Frank LM, Eden UT, Solo V, Wilson MA, Brown EN. Contrasting patterns of receptive field plasticity in the hippocampus and the entorhinal cortex: an adaptive filtering approach. J. Neurosci. 2002;22:3817–3830. doi: 10.1523/JNEUROSCI.22-09-03817.2002. [DOI] [PMC free article] [PubMed] [Google Scholar]
- Frohardt RJ, Bassett JP, Taube JS. Path integration and lesions within the head direction cell circuit: comparison between the roles of the anterodorsal thalamus and dorsal tegmental nucleus. Behav. Neurosci. 2006;120:135–149. doi: 10.1037/0735-7044.120.1.135. [DOI] [PubMed] [Google Scholar]
- Fu YX, Djupsund K, Gao H, Hayden B, Shen K, Dan Y. Temporal specificity in the cortical plasticity of visual space representation. Science. 2002;296:1999–2003. doi: 10.1126/science.1070521. [DOI] [PubMed] [Google Scholar]
- Goodridge JP, Taube JS. Interaction between the postsubiculum and anterior thalamus in the generation of head direction cell activity. J. Neurosci. 1997;17:9315–9330. doi: 10.1523/JNEUROSCI.17-23-09315.1997. [DOI] [PMC free article] [PubMed] [Google Scholar]
- Goodridge JP, Touretzky DS. Modeling attractor deformation in the rodent head-direction system. J. Neurophysiol. 2000;83:3402–3410. doi: 10.1152/jn.2000.83.6.3402. [DOI] [PubMed] [Google Scholar]
- Hebb DO. The Organization of Behavior: A Neuropsychological Theory. John Wiley & Sons; New York: 1949. [Google Scholar]
- Huxter J, Burgess N, O’Keefe J. Independent rate and temporal coding in hippocampal pyramidal cells. Nature. 2003;425:828–832. doi: 10.1038/nature02058. [DOI] [PMC free article] [PubMed] [Google Scholar]
- Khan AM, Stanley BG, Bozzetti L, Chin C, Stivers C, Curras-Collazo MC. N-methyl-D-aspartate receptor subunit NR2B is widely expressed throughout the rat diencephalon: an immunohistochemical study. J. Comp Neurol. 2000;428:428–449. [PubMed] [Google Scholar]
- Knierim JJ, Kudrimoti HS, McNaughton BL. Place cells, head direction cells, and the learning of landmark stability. J. Neurosci. 1995;15:1648–1659. doi: 10.1523/JNEUROSCI.15-03-01648.1995. [DOI] [PMC free article] [PubMed] [Google Scholar]
- Knierim JJ, Kudrimoti HS, McNaughton BL. Interactions between idiothetic cues and external landmarks in the control of place cells and head direction cells. J. Neurophysiol. 1998;80:425–446. doi: 10.1152/jn.1998.80.1.425. [DOI] [PubMed] [Google Scholar]
- Knierim JJ. LTP takes route in the hippocampus. Neuron. 2000;25:504–506. doi: 10.1016/s0896-6273(00)81053-3. [DOI] [PubMed] [Google Scholar]
- Knierim JJ. Dynamic interactions between local surface cues, distal landmarks, and intrinsic circuitry in hippocampal place cells. J. Neurosci. 2002;22:6254–6264. doi: 10.1523/JNEUROSCI.22-14-06254.2002. [DOI] [PMC free article] [PubMed] [Google Scholar]
- Knierim JJ. Coupling between head direction cells and place cells: influences of landmarks, self-motion, and intrinsic circuitry. In: Wiener SI, Taube JS, editors. Head Direction Cells and the Neural Mechanisms of Spatial Orientation. MIT Press; Cambridge, MA: 2005. pp. 163–185. [Google Scholar]
- Lee I, Yoganarasimha D, Rao G, Knierim JJ. Comparison of population coherence of place cells in hippocampal subfields CA1 and CA3. Nature. 2004a;430:456–459. doi: 10.1038/nature02739. [DOI] [PubMed] [Google Scholar]
- Lee I, Rao G, Knierim JJ. A double dissociation between hippocampal subfields: differential time course of CA3 and CA1 place cells for processing changed environments. Neuron. 2004b;42:803–815. doi: 10.1016/j.neuron.2004.05.010. [DOI] [PubMed] [Google Scholar]
- Lee I, Griffin AL, Zilli EA, Eichenbaum H, Hasselmo ME. Gradual translocation of spatial correlates of neuronal firing in the hippocampus toward prospective reward locations. Neuron. 2006;51:639–650. doi: 10.1016/j.neuron.2006.06.033. [DOI] [PubMed] [Google Scholar]
- Leutgeb S, Ragozzino KE, Mizumori SJ. Convergence of head direction and place information in the CA1 region of hippocampus. Neuroscience. 2000;100:11–19. doi: 10.1016/s0306-4522(00)00258-x. [DOI] [PubMed] [Google Scholar]
- Levy WB, Steward O. Temporal contiguity requirements for long-term associative potentiation/depression in the hippocampus. Neuroscience. 1983;8:791–797. doi: 10.1016/0306-4522(83)90010-6. [DOI] [PubMed] [Google Scholar]
- Levy WB. A sequence predicting CA3 is a flexible associator that learns and uses context to solve hippocampal-like tasks. Hippocampus. 1996;6:579–590. doi: 10.1002/(SICI)1098-1063(1996)6:6<579::AID-HIPO3>3.0.CO;2-C. [DOI] [PubMed] [Google Scholar]
- Lisman JE. Relating hippocampal circuitry to function: recall of memory sequences by reciprocal dentate-CA3 interactions. Neuron. 1999;22:233–242. doi: 10.1016/s0896-6273(00)81085-5. [DOI] [PubMed] [Google Scholar]
- Louie K, Wilson MA. Temporally structured replay of awake hippocampal ensemble activity during rapid eye movement sleep. Neuron. 2001;29:145–156. doi: 10.1016/s0896-6273(01)00186-6. [DOI] [PubMed] [Google Scholar]
- Ma T, Chen HH, Lim DK, Hume AS, Ho IK. Effects of subacute lead exposure on [3H]MK-801 binding in hippocampus and cerebral cortex in the adult rat. Brain Res. 1997;760:187–192. doi: 10.1016/s0006-8993(97)00279-5. [DOI] [PubMed] [Google Scholar]
- Markram H, Lubke J, Frotscher M, Sakmann B. Regulation of synaptic efficacy by coincidence of postsynaptic APs and EPSPs. Science. 1997;275:213–215. doi: 10.1126/science.275.5297.213. [DOI] [PubMed] [Google Scholar]
- McNaughton BL, Morris RGM. Hippocampal synaptic enhancement and information storage within a distributed memory system. Trends Neurosci. 1987;10:40–415. [Google Scholar]
- McNaughton BL, Chen LL, Markus EJ. “Dead reckoning,” landmark learning, and the sense of direction: A neurophysiological and computational hypothesis. J. Cognit. Neurosci. 1991;3:190–202. doi: 10.1162/jocn.1991.3.2.190. [DOI] [PubMed] [Google Scholar]
- McNaughton BL, Barnes CA, Gerrard JL, Gothard K, Jung MW, Knierim JJ, Kudrimoti H, Qin Y, Skaggs WE, Suster M, Weaver KL. Deciphering the hippocampal polyglot: the hippocampus as a path integration system. J. Exp. Biol. 1996;199:173–185. doi: 10.1242/jeb.199.1.173. [DOI] [PubMed] [Google Scholar]
- Mehta MR, Barnes CA, McNaughton BL. Experience-dependent, asymmetric expansion of hippocampal place fields. Proc. Natl. Acad. Sci. U. S. A. 1997;94:8918–8921. doi: 10.1073/pnas.94.16.8918. [DOI] [PMC free article] [PubMed] [Google Scholar]
- Mehta MR, Quirk MC, Wilson MA. Experience-dependent asymmetric shape of hippocampal receptive fields. Neuron. 2000;25:707–715. doi: 10.1016/s0896-6273(00)81072-7. [DOI] [PubMed] [Google Scholar]
- Mehta MR, Wilson MA. From hippocampus to V1: Effect of LTP on spatio-temporal dynamics of receptive fields. Neurocomputing. 2000;32:33–905. [Google Scholar]
- Mehta MR. Neuronal dynamics of predictive encoding. The Neuroscientist. 2001;7:490–495. doi: 10.1177/107385840100700605. [DOI] [PubMed] [Google Scholar]
- Muir GM, Taube JS. Head direction cell activity and behavior in a navigation task requiring a cognitive mapping strategy. Behav. Brain Res. 2004;153:249–253. doi: 10.1016/j.bbr.2003.12.007. [DOI] [PubMed] [Google Scholar]
- Muller RU, Stead M, Pach J. The hippocampus as a cognitive graph. J. Gen. Physiol. 1996a;107:663–694. doi: 10.1085/jgp.107.6.663. [DOI] [PMC free article] [PubMed] [Google Scholar]
- Muller RU, Ranck JB, Jr., Taube JS. Head direction cells: properties and functional significance. Curr. Opin. Neurobiol. 1996b;6:196–206. doi: 10.1016/s0959-4388(96)80073-0. [DOI] [PubMed] [Google Scholar]
- O’Keefe J, Burgess N. Dual phase and rate coding in hippocampal place cells: theoretical significance and relationship to entorhinal grid cells. Hippocampus. 2005;15:853–866. doi: 10.1002/hipo.20115. [DOI] [PMC free article] [PubMed] [Google Scholar]
- Ranck JB., Jr. Head direction cells in the deep cell layer of dorsal presubiculum in freely moving rats. In: Buzsaki G, Vanderwolf CH, editors. Electrical Activity of Archicortex. Akademiai Kiado; Budapest: 1985. pp. 217–220. [Google Scholar]
- Redish AD, Elga AN, Touretzky DS. A coupled attractor model of the rodent head direction system. Network. 1996;7:671–685. [Google Scholar]
- Sargolini F, Fyhn M, Hafting T, McNaughton BL, Witter MP, Moser MB, Moser EI. Conjunctive representation of position, direction, and velocity in entorhinal cortex. Science. 2006;312:758–762. doi: 10.1126/science.1125572. [DOI] [PubMed] [Google Scholar]
- Shapiro ML, Tanila H, Eichenbaum H. Cues that hippocampal place cells encode: dynamic and hierarchical representation of local and distal stimuli. Hippocampus. 1997;7:624–642. doi: 10.1002/(SICI)1098-1063(1997)7:6<624::AID-HIPO5>3.0.CO;2-E. [DOI] [PubMed] [Google Scholar]
- Sharp PE, Blair HT, Cho J. The anatomical and computational basis of the rat head-direction cell signal. Trends Neurosci. 2001;24:289–294. doi: 10.1016/s0166-2236(00)01797-5. [DOI] [PubMed] [Google Scholar]
- Shen J, Barnes CA, McNaughton BL, Skaggs WE, Weaver KL. The effect of aging on experience-dependent plasticity of hippocampal place cells. J. Neurosci. 1997;17:6769–6782. doi: 10.1523/JNEUROSCI.17-17-06769.1997. [DOI] [PMC free article] [PubMed] [Google Scholar]
- Skaggs WE, Knierim JJ, Kudrimoti HS, McNaughton BL. A model of the neural basis of the rat’s sense of direction. Adv. Neural Inf. Process Syst. 1995;7:173–180. [PubMed] [Google Scholar]
- Skaggs WE, McNaughton BL, Wilson MA, Barnes CA. Theta phase precession in hippocampal neuronal populations and the compression of temporal sequences. Hippocampus. 1996;6:149–172. doi: 10.1002/(SICI)1098-1063(1996)6:2<149::AID-HIPO6>3.0.CO;2-K. [DOI] [PubMed] [Google Scholar]
- Skaggs WE, McNaughton BL. Replay of neuronal firing sequences in rat hippocampus during sleep following spatial experience. Science. 1996;271:1870–1873. doi: 10.1126/science.271.5257.1870. [DOI] [PubMed] [Google Scholar]
- Song P, Wang XJ. Angular path integration by moving “hill of activity”: a spiking neuron model without recurrent excitation of the head-direction system. J. Neurosci. 2005;25:1002–1014. doi: 10.1523/JNEUROSCI.4172-04.2005. [DOI] [PMC free article] [PubMed] [Google Scholar]
- Stackman RW, Taube JS. Firing properties of rat lateral mammillary single units: head direction, head pitch, and angular head velocity. J. Neurosci. 1998;18:9020–9037. doi: 10.1523/JNEUROSCI.18-21-09020.1998. [DOI] [PMC free article] [PubMed] [Google Scholar]
- Taube JS, Muller RU, Ranck JB., Jr. Head-direction cells recorded from the postsubiculum in freely moving rats. II. Effects of environmental manipulations. J. Neurosci. 1990;10:436–447. doi: 10.1523/JNEUROSCI.10-02-00436.1990. [DOI] [PMC free article] [PubMed] [Google Scholar]
- Taube JS. Head direction cells and the neurophysiological basis for a sense of direction. Prog. Neurobiol. 1998;55:225–256. doi: 10.1016/s0301-0082(98)00004-5. [DOI] [PubMed] [Google Scholar]
- Taube JS, Muller RU. Comparisons of head direction cell activity in the postsubiculum and anterior thalamus of freely moving rats. Hippocampus. 1998;8:87–108. doi: 10.1002/(SICI)1098-1063(1998)8:2<87::AID-HIPO1>3.0.CO;2-4. [DOI] [PubMed] [Google Scholar]
- Wang XJ. Synaptic basis of cortical persistent activity: the importance of NMDA receptors to working memory. J. Neurosci. 1999;19:9587–9603. doi: 10.1523/JNEUROSCI.19-21-09587.1999. [DOI] [PMC free article] [PubMed] [Google Scholar]
- Yao H, Dan Y. Stimulus timing-dependent plasticity in cortical processing of orientation. Neuron. 2001;32:315–323. doi: 10.1016/s0896-6273(01)00460-3. [DOI] [PubMed] [Google Scholar]
- Yoganarasimha D, Knierim JJ. Coupling between place cells and head direction cells during relative translations and rotations of distal landmarks. Exp. Brain Res. 2005;160:344–359. doi: 10.1007/s00221-004-2016-9. [DOI] [PubMed] [Google Scholar]
- Yoganarasimha D, Yu X, Knierim JJ. Head direction cell representations maintain internal coherence during conflicting proximal and distal cue rotations: comparison with hippocampal place cells. J. Neurosci. 2006;26:622–631. doi: 10.1523/JNEUROSCI.3885-05.2006. [DOI] [PMC free article] [PubMed] [Google Scholar]
- Yu X, Yoganarasimha D, Knierim JJ. Experience-dependent asymmetric changes in head direction tuning curves. Society for Neuroscience Abstracts. 2005;31:68–16. [Google Scholar]
- Yu X, Knierim JJ, Lee I, Shouval HZ. Simulating place fields dynamics using spike timing-dependent plasticity. Neurocomputing. 2006;69:1253–1259. [Google Scholar]
- Zhang K. Representation of spatial orientation by the intrinsic dynamics of the head-direction cell ensemble: a theory. J. Neurosci. 1996;16:2112–2126. doi: 10.1523/JNEUROSCI.16-06-02112.1996. [DOI] [PMC free article] [PubMed] [Google Scholar]
Associated Data
This section collects any data citations, data availability statements, or supplementary materials included in this article.