

Abstract
Despite the growing consensus on the importance of testing gene-gene interactions in genetic studies of complex diseases, the effect of gene-gene interactions has often been defined as a deviance from genetic additive effects, which is essentially treated as a residual term in genetic analysis and leads to low power in detecting the presence of interacting effects. To what extent the definition of gene-gene interaction at population level reflects the genes' biochemical or physiological interaction remains a mystery. In this article, we introduce a novel definition and a new measure of gene-gene interaction between two unlinked loci (or genes). We developed a general theory for studying linkage disequilibrium (LD) patterns in disease population under two-locus disease models. The properties of using the LD measure in a disease population as a function of the measure of gene-gene interaction between two unlinked loci were also investigated. We examined how interaction between two loci creates LD in a disease population and showed that the mathematical formulation of the new definition for gene-gene interaction between two loci was similar to that of the LD between two loci. This finding motived us to develop an LD-based statistic to detect gene-gene interaction between two unlinked loci. The null distribution and type I error rates of the LD-based statistic for testing gene-gene interaction were validated using extensive simulation studies. We found that the new test statistic was more powerful than the traditional logistic regression under three two-locus disease models and demonstrated that the power of the test statistic depends on the measure of gene-gene interaction. We also investigated the impact of using tagging SNPs for testing interaction on the power to detect interaction between two unlinked loci. Finally, to evaluate the performance of our new method, we applied the LD-based statistic to two published data sets. Our results showed that the P values of the LD-based statistic were smaller than those obtained by other approaches, including logistic regression models.
Complex diseases are typically caused by multiple factors, including multiple genes, primarily through nonlinear gene-gene interactions and gene-environment interactions. Gene-gene interaction is an important but complex concept.1 Despite growing recognition of the importance of gene interactions in genetic studies of complex diseases, classical genetic analysis either ignores gene interactions or defines the effect of gene interactions as a deviance from genetic additive effects, which is essentially treated as a residual term in genetic analysis.2 Fisher3 mathematically defined the effect of gene interactions as a statistical deviance from the additive effects of single genes, which is often referred to as “statistical interaction” between genes. This was further developed by Cockerham4 and Kempthorne5 into the modern representation that treats statistical gene interactions as interaction terms in a regression model or a generalized linear model on allelic effects.2,6–11 Modeling a trait as an additive combination of its single-locus main effects and interaction terms is likely to limit the power to detect interaction.
In the past several years, combinatorial partitioning12 and various data-mining methods1,13–21 have been explored to detect gene-gene interaction. The limitations of these methods include (1) the lack of clear biological interpretation of gene-gene interaction, (2) the requirement of intensive computation, and (3) the fact that the power to detect gene-gene interaction may depend on the data structure.
To overcome these limitations, we propose to define interaction between two unlinked loci (or genes) for a qualitative trait as the deviance of the penetrance for a haplotype at two loci from the product of the marginal penetrance of the individual alleles that span the haplotype. This definition of gene-gene interaction between two unlinked loci measures the dependence of the penetrance at one marker locus on the genotypes at another locus, which is not derived from the additive model. Interaction between two unlinked loci will result in deviation of the penetrance of the two-locus haplotype from independence of the marginal penetrance of the alleles at an individual locus, which in turn will create linkage disequilibrium (LD) even if two loci are unlinked. The level of LD created depends on the magnitude of interaction between two unlinked loci. Therefore, it is possible to develop statistics for detection of interaction between two unlinked loci by use of deviations from LD. Such statistics for interaction detection between two unlinked loci have advantages, as follows. First, since interaction between two unlinked loci can be characterized by LD between two interacting loci, the LD-based statistics for detection of interaction between two unlinked loci will have a clear biological interpretation. Second, they will not treat interaction as a residual term in the model and can implicitly consider nonlinear interaction between two unlinked loci. Hence, LD-based statistics for detection of interaction between two unlinked loci will have higher power than that of the traditional Fisher's method. Third, computation of LD-based statistics is much faster than logistic regression models; thus, they are particularly suitable for genomewide association studies.
To date, formal statistics for testing gene interactions by use of LD among loci are not yet developed, although several empirical studies to assess the role of gene interaction by use of LD have been conducted.22–25 These studies assessed deviations from equilibrium in the affected population to indicate interaction between two unlinked loci. These empirical studies for testing interaction between two unlinked loci have limitations. Most of the LD-based empirical studies are descriptive. They separately tested deviation from equilibrium in cases and controls but did not provide a unified statistic to test gene interaction by assessing difference in LD between cases and controls. Furthermore, they did not examine the null distributions, type I error rates, and power of the test statistics. As a consequence, in the presence of complex LD patterns in populations, these LD-based empirical studies for identifying gene interactions may have high false-positive rates.
The main purpose of this article is to develop statistics with high power for detection of interaction between two unlinked loci. To accomplish this, we first develop general theory to study LD patterns under two-locus disease models. We then develop a novel definition of gene interaction and a measure of interaction between two unlinked disease loci under the framework of LD analysis. The pattern of LD between two unlinked loci created by gene-gene interaction provides a foundation for developing statistics for detection of interaction. This motives us to develop the LD-based statistics for testing interactions between two unlinked loci. We also investigate type I error rates of the LD-based statistics. Furthermore, we explore the possibility of using two unlinked tagging SNPs (tSNPs) for detecting interaction between two disease loci that are in LD with the chosen tSNPs. To investigate the impact of using tSNPs on interaction detection, we evaluate the power of directly using interacting disease loci and of using tSNPs that are in high LD with the interacting disease loci to detect interaction. To evaluate the performance of the new statistic, we also applied it to two real examples. We conclude with a discussion of the advantages and potential limitations of the proposed statistic.
Methods
LD Generated by Gene-Gene Interactions
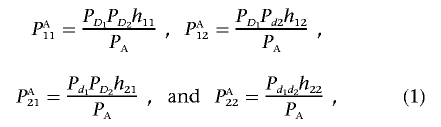
To investigate the LD pattern generated by gene-gene interaction, we assume that two disease-susceptibility loci are in Hardy-Weinberg equilibrium (HWE) and are unlinked. Let D1 and d1 be the two alleles at the first disease locus, with frequencies PD1 and Pd1, respectively. Let D2 and d2 be the two alleles at the second disease locus, with frequencies PD2 and Pd2, respectively. Alleles D1 and d1 can be indexed by 1 and 2, respectively. At the first disease locus, let D1D1 be genotype 11, D1d1 be genotype 12, and d1d1 be genotype 22. The genotypes at the second disease locus are similarly defined. Two-locus genotypes are simply denoted by ijkl for individuals carrying the haplotypes ik and jl arranged from left to right. Let fijkl be the penetrance of the individuals with haplotypes ik and jl arranged from left to right. Let P11, P12, P21, and P22 be the frequencies of haplotypes HD1D2, HD1d2, Hd1D2, and Hd1d2 in the general population, respectively. Let PA11, PA12, PA21, and PA22 be their corresponding haplotype frequencies in the disease population. Let PAD1, PAd1, PAD2, and PAd2 be the frequencies of the alleles D1, d1, D2, and d2 in the disease population, respectively.
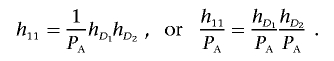
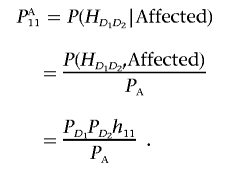
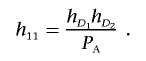
For ease of discussion, we introduce a concept of haplotype penetrance. Consider a haplotype with allele i at the first disease locus and allele k at the second disease locus. Then, the penetrance of haplotype Hik is defined as
Let δ=P11-PD1PD2 be the LD measure in the general population. In appendix A, we show that haplotype frequencies in disease population can be expressed as
 |
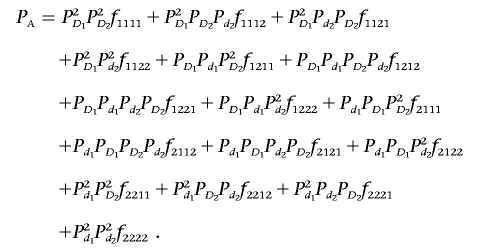
where PA denotes disease prevalence and is given by
 |
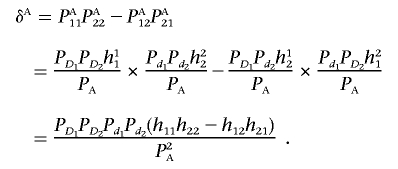
Now, we calculate the LD measure in the disease population under a general two-locus disease model. The measure of LD in the disease population is defined as δA=PA11PA22-PA12PA21. We can show (appendix A) that it can be given by
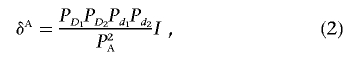 |
where I=h11h22-h12h21, which is defined as a measure of interaction between two unlinked loci and quantifies the magnitude of interaction. Absence of interaction between two unlinked loci is then defined as
Under this definition, in the absence of interaction, two unlinked loci in the disease population will be in linkage equilibrium.
From equation (2), we can see that, if h11h22≠h12h21, even if two loci are in linkage equilibrium in the general population, two loci will be in LD in the disease population. LD in the disease population is created by the interaction between two unlinked loci. This provides a basis for testing interaction between two unlinked loci, as shown in the “Test Statistic” section.
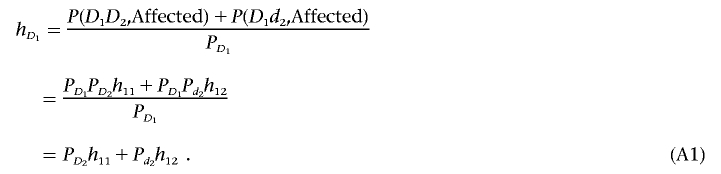
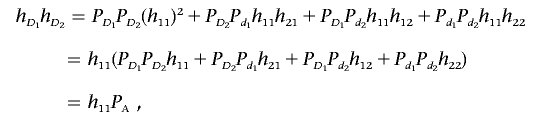
Define hD1=P(Affected|D1) and hD2=P(Affected|D2). In appendix A, we show that equation (3) implies that
 |
Similar to linkage equilibrium, where the frequency of a haplotype is equal to the product of the frequencies of the component alleles of the haplotype, absence of interaction between two unlinked loci implies that the proportion of individuals carrying a haplotype in the disease population is equal to the product of the proportions of individuals carrying the component alleles of the haplotype in the disease population, if we assume that the disease is caused by only two investigated disease loci. In other words, interaction between two disease-susceptibility loci occurs when contribution of one locus to the disease depends on another locus.
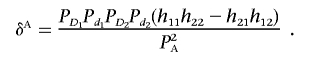
Suppose that the first locus postulated above is a disease-susceptibility locus and that the second is a marker locus that does not predispose carriers to a disease phenotype. Let fij be the penetrance of the genotype ij at the disease-susceptibility locus. Then, we have h11=PD1f11+Pd1f12, h22+PD1f21+Pd1f22, h12=PD1f11+Pd1f12, and h21=PD1f21+Pd1f22, which implies that
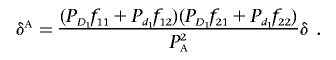 |
That is, the measure of LD between a disease locus and a marker locus in the disease population (δA) can be expressed in terms of the measure of LD in the general population and a multiplicative factor. If the disease locus and the marker locus are unlinked, then the disease and marker loci will be in linkage equilibrium. This demonstrates that, in the absence of interaction between the unlinked marker and the disease loci, LD in the disease population cannot be created.
To further understand the measure of interaction between two unlinked loci, we examined the interactions between two unlinked loci under six two-locus disease models. Results are listed in table 1, in which the values represent the penetrances of the given genotypes.26–28 The measure of interaction between two unlinked loci depends not only on penetrance but also on the frequencies of the disease alleles.
Table 1. .
Interaction between Two Unlinked Disease Loci under Six Two-Locus Disease Models
| Second Locus |
||||
| Model and First Locus |
D2D2 | D2d2 | d2d2 | Interaction Measure |
| Dom ∪ Dom: | -Pd1Pd2f2 | |||
| D1D1 | f | f | f | |
| D1d1 | f | f | f | |
| d1d1 | f | f | 0 | |
| Rec ∪ Rec: | -PD1PD2f2 | |||
| D1D1 | f | f | f | |
| D1d1 | f | 0 | 0 | |
| d1d1 | f | 0 | 0 | |
| Threshold: | -P2D1P2D2f2 | |||
| D1D1 | f | f | 0 | |
| D1d1 | f | 0 | 0 | |
| d1d1 | 0 | 0 | 0 | |
| Dom ∪ Rec: | -Pd1PD2f2 | |||
| D1D1 | f | f | f | |
| D1d1 | f | f | f | |
| d1d1 | f | 0 | 0 | |
| Epistasis: | -PD1P2D2f2 | |||
| D1D1 | f | f | 0 | |
| D1d1 | f | 0 | 0 | |
| d1d1 | f | 0 | 0 | |
| Modifying: | -P2D1PD2f2 | |||
| D1D1 | f | f | f | |
| D1d1 | f | 0 | 0 | |
| d1d1 | 0 | 0 | 0 | |
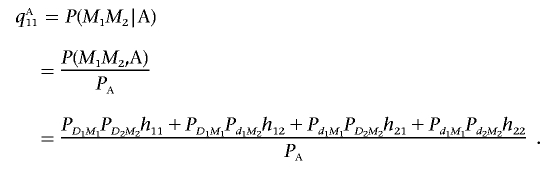
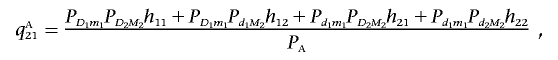
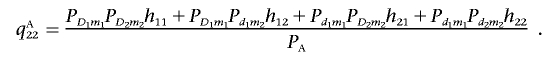
Indirect Interaction between Two Unlinked Marker Loci
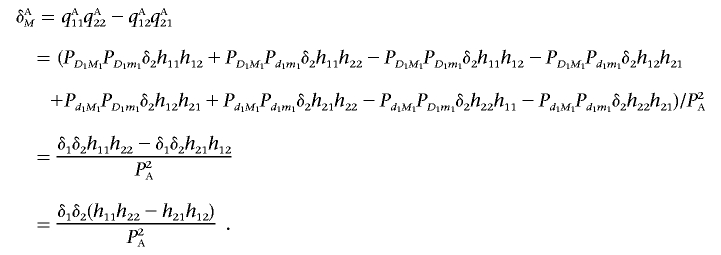
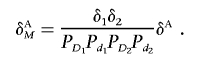
In the previous section, we studied interaction between two unlinked disease loci. Now, we consider two marker loci, each of which is in LD with either of two interacting loci. Although there is no physiological interaction between the two marker loci, if each marker locus is in LD with one of the two unlinked interacting loci, we still can observe LD between two unlinked marker loci in the disease population. Assume that marker M1 is in LD with disease locus D1 and that marker M2 is in LD with disease locus D2. Furthermore, we assume that two disease loci, D1 and D2, are unlinked. Let δAM be the LD measure between two marker loci in the disease population. Let δi be the LD measure between marker Mi and disease locus Di (i=1,2) in the general population. Then, we can show (appendix B) that
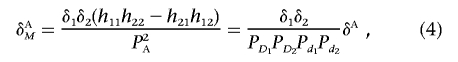 |
where δA is the measure of LD between two unlinked disease loci in the disease population. It is clear that, when the marker loci are the disease loci themselves, δAM is reduced to δA. Equation (4) can also be written in terms of the measure of interaction between two unlinked loci:
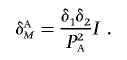 |
Since δi⩽PDiPdi, the absolute value of the LD measure between two unlinked marker loci in the disease population—for example, |δAM|—will be less than or equal to the absolute value of the LD measure between two unlinked disease loci in the disease population.
Equation (4) shows that the LD between unlinked marker loci in the disease population is proportional to the product of LD between each marker locus and its linked disease locus, δ1δ2. Since the criteria for tSNP selection are based on only one pairwise LD between the marker and disease loci, the LD between tSNPs and interacting loci may not be large enough to ensure that indirect interaction between two unlinked marker loci will be detected. Thus, if the interacting disease loci are not selected as tSNPs, many loci with interactions will be missed. This will have a profound implication on tSNP selection.
Test Statistic
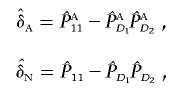
In the previous section, we showed that interaction between unlinked loci will create LD. Intuitively, we can test interaction by comparing the difference in the LD levels between two unlinked loci between cases and controls. Precisely, if we denote the estimators of the LD measures in cases and controls by  and
and  , respectively, then the test statistic can be defined as
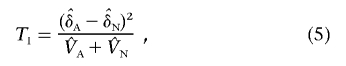 |
where
 |
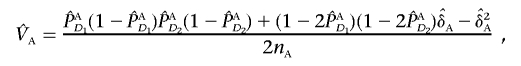 |
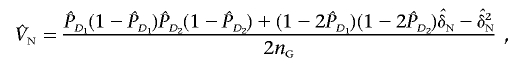 |
and nA and nG denote the number of sampled individuals in cases and controls, respectively. PA11, PAD1, PAD2, PN11, PND1, and PND2 are defined as before.  ,
,  ,
,  ,
,  ,
,  , and
, and  are their estimators, the variance of the LD measure was the large-sample variance,29 and
  and
and  are the estimators of the variances VA and VN, respectively. This statistic will be referred to as the “LD-based statistic” throughout the article. We can show that test statistic TI is asymptotically distributed as a central χ2(1) distribution under the null hypothesis of no interaction between two unlinked loci (appendix C).
In theory, when there is no interaction between two unlinked loci, the LD between them should be zero. Thus, we can use case-only design to study interaction between two loci. In this case, equation (5) will be reduced to
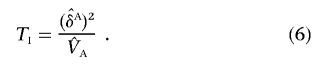 |
However, in practice, background LD between two unlinked loci may exist in the population because of many unknown factors. Therefore, using equation (6) to test for interaction will increase type I error rates. The test statistic defined in equation (5) is more robust than that in equation (6). In appendix C, we showed that, for an admixed population, if differences in allele frequencies between two subpopulations at each of the two loci in cases and controls are the same, test statistic TI in equation (5) is still a valid test for interaction between two unlinked loci.
Results
Patterns of Pairwise LD under Two-Locus Disease Models
Knowledge about differences in LD patterns between disease and general populations is crucial for association studies of complex diseases. To illustrate how the differences in LD patterns between disease and general populations are influenced by disease models, we examined the LD patterns between unlinked loci by assuming several two-locus disease models. We first studied the LD between two unlinked loci under three two-locus disease models: the union of dominant and dominant (Dom ∪ Dom), the union of recessive and recessive (Rec ∪ Rec), and threshold models (table 1). Figure 1 shows the LD between two unlinked loci, which is generated by the joint actions of two disease loci, as a function of the allele frequency at the first locus, under the assumption that the allele frequency at the second locus PD2=0.1 and penetrance parameter f=1. Figure 1 shows that, although two unlinked loci in the general population is in linkage equilibrium, the LD between two unlinked loci in the disease population does exist. The LD in disease population depends on the disease models and the allele frequencies at two loci.
Figure 1. .

LD between two unlinked loci in a disease population under three two-locus disease models as a function of allele frequency at the first locus, under the assumption that the allele frequency at the second locus equals 0.1.
Pairwise Interaction Measure
The proposed measure of interaction between two unlinked loci quantifies the magnitude of interaction between two unlinked loci. To further explore the properties of the interaction measure between two unlinked loci, we investigated the impact of the two-locus disease models on the measure of interaction. Figure 2 plots the measure of interaction between two unlinked loci under six two-locus disease models (table 1) as a function of penetrance parameter f, under the assumption that the allele frequencies at the two loci are 0.3 and 0.8 (fig. 2A) or 0.2 and 0.4 (fig. 2B). The figures shows that the measure of interaction is a monotonic function of the penetrance parameter. The measure of interaction depends on both the disease models and the allele frequencies at the two loci. However, the relationship between the measure of interaction and disease models is complex. For example, when the allele frequencies at two loci are 0.2 and 0.4, the measure of interaction for the Dom ∪ Dom model is much larger than that for Rec ∪ Rec model, whereas when the allele frequencies at two loci are 0.3 and 0.8, the measure of interaction for the Dom ∪ Dom model is smaller than that for the Rec ∪ Rec model. This may partially explain why gene-gene interaction detected in one population cannot be replicated in another population, because allele frequencies are different between populations.
Figure 2. .

Measure of interaction between two unlinked loci as a function of the penetrance parameter under six two-locus disease models, under the assumption that allele frequencies at the first and second loci equal either 0.3 and 0.8, respectively (A), or 0.2 and 0.4, respectively (B).
Null Distribution of Test Statistics
In the previous sections, we have shown that, when sample size is large enough to apply large-sample theory, distribution of the statistic TI for testing interaction between two unlinked loci under the null hypothesis of no interaction is asymptotically a central χ2(1) distribution. To examine the validity of this statement, we performed a series of simulation studies. The computer program SNaP30 was used to generate two-locus genotype data of the sample individuals. A total of 10,000 individuals who were equally divided into cases and controls were generated in the general population. From each group of the cases and controls, 100–500 individuals were randomly sampled; 10,000 simulations were repeated.
Figure 3A and 3B plots the histograms of the test statistic TI for testing gene-gene interaction between two unlinked loci with sample sizes nA=nG=150 and nA=nG=250, respectively. It can be seen that the distributions of the test statistic TI are similar to the theoretical central χ2(1) distribution. Table 2 shows that the estimated type I error rates of the statistic TI for testing interaction were not appreciably different from the nominal levels α=0.05, α=0.01, and α=0.001.
Figure 3. .

Null distribution of the test statistic TI by use of 150 individuals (A) or 250 individuals (B) from both the cases and the controls in a homogeneous population.
Table 2. .
Type I Error Rates of the Test Statistic TI in Testing Interaction between Two Unlinked Loci in a Homogeneous Population
| Type I Error Rate for Nominal Level |
|||
| Sample Size |
α=.05 | α=.01 | α=.001 |
| 100 | .0501 | .0108 | .0010 |
| 150 | .0478 | .0099 | .0008 |
| 200 | .0502 | .0094 | .0012 |
| 250 | .0477 | .0082 | .0007 |
| 300 | .0482 | .0091 | .0010 |
| 350 | .0469 | .0100 | .0011 |
| 400 | .0472 | .0091 | .0009 |
| 450 | .0467 | .0088 | .0014 |
| 500 | .0466 | .0096 | .0010 |
To examine the impact of population substructure on the null distribution of the test statistic TI, we performed a series of simulations. We assumed that allele frequencies at the first locus were 0.7 and 0.3 in population 1 and 0.3 and 0.7 in population 2. The allele frequencies at the second loci were assumed to be 0.2 and 0.8 in population 1 and 0.8 and 0.2 in population 2. From each population, 10,000 individuals were sampled, and these individuals were mixed to form an admixed population, which was then equally divided into cases and controls. Three hundred individuals were randomly sampled from each group of the cases and controls, and 10,000 simulations were repeated. Figure 4 shows the histograms of test statistic TI. It can be seen that the distribution of TI is similar to the theoretical central χ2 distributions, which shows that population admixture has a mild impact on the null distribution of test statistic TI.
Figure 4. .

Null distribution of the test statistic TI by use of 300 individuals from both the cases and the controls in an admixed population.
Power Evaluation
To further evaluate the performance of the proposed statistic in testing gene-gene interaction, we compared the power of the LD-based statistic with that of the logistic model. We considered three types of genotype coding (genetic covariate variables). For a recessive model, homozygous wild-type, heterozygous, and homozygous mutant genotypes were coded as 0, 0, and 1, respectively. For a dominant model, these three genotypes were coded as 0, 1, and 1. For an additive model, they were coded as 0, 1, and 2. We considered two loci, denoted as G and H, respectively. Power for the logistic regression model in testing gene-gene interaction was calculated using the software QUANTO.31 Figure 5A, 5B, and 5C presents the power comparisons between logistic regression model and LD-based statistic under the three genetic interaction models: recessive × recessive, dominant × dominant, and additive × additive. We can see that the power of both logistic regression and the new LD-based statistic in detecting gene-gene interaction was a monotonic function of the interaction odds ratio, a widely used measure in quantifying the strength of interaction between two loci. This implies that the proposed new interaction measure and test statistic are closely related to the traditional interaction measure. Figure 5A, 5B, and 5C also shows that the power of the test statistic TI is much higher than that of the logistic regression model.
Figure 5. .

Power of the test statistic TI and logistic regression analysis as a function of interaction odds ratio (RGH) under three different models. A, Recessive × recessive model, under the assumption that the risk allele frequencies at both loci G and H are 0.2, number of individuals in both cases and controls are 500, population risk is 0.001, significance level is 0.05, and odds ratios RG=5 and RH=5. B, Dominant × dominant model, under the assumption that the risk allele frequencies at both loci G and H are 0.1, number of individuals in both cases and controls are 500, population risk is 0.001, significance level is 0.05, and odds ratios RG=2 and RH=2. C, Additive × additive model, under the assumption that the risk allele frequencies at both loci G and H are 0.1, number of individuals in both cases and controls are 100, population risk is 0.001, significance level is 0.05, and odds ratios RG=2 and RH=2.
Pairwise LD is widely used in tSNP selection32—that is, the chosen tSNPs show greater LD (measured by r2) than those nearby SNPs that were not selected for a preset threshold. This approach ensures enough power in detecting disease locus. We now investigate whether the selected threshold can ensure enough power to detect interaction between two unlinked loci. Figure 6A, 6B, and 6C shows the power of the statistic TI for detecting interaction between two unlinked disease loci (using two tSNPs) as a function of the interaction measure under three two-locus disease models: Dom ∪ Dom, Dom ∪ Rec, and Rec ∪ Rec (table 1). For the simplicity of presentation, we assume that each of the two unlinked marker loci has an equal correlation coefficient with one of the two unlinked interacting disease loci. We fix the allele frequency at the second locus and change the allele frequency at the first locus to produce the changing measure of interaction between two loci. Several remarkable features emerge from figure 6A, 6B, and 6C. First, in many cases, power increases as the measure of interaction increases. Second, using neighboring tSNPs has much lower power than does using the two interacting disease loci themselves directly. Third, the magnitude of r2 has large impact on the power of interaction detection.
Figure 6. .

Power of the test statistic TI as a function of the interaction measure between two unlinked loci under a two-locus disease model. A, Dom ∪ Dom, under the assumption that the number of individuals in both cases and controls are 500, penetrance parameter f=1, allele frequency at the second locus is 0.1, and significance level is 0.05. B, Dom ∪ Rec, under the assumption that the number of individuals in both cases and controls are 250, penetrance parameter f=1, allele frequency at the second locus is 0.1, and significance level is 0.05. C, Rec ∪ Rec, under the assumption that the number of individuals in both cases and controls are 500, penetrance parameter f=1, allele frequency at the second locus is 0.5, and significance level is 0.05.
In figure 6A, 6B, and 6C, we studied the power as a function of measure of interaction. However, in practice, a measure of interaction cannot be directly observed. To provide more practically useful information for tSNPs selection and association studies, we plot figure 7A, 7B, and 7C, showing the power of statistic TI for interaction detection of two unlinked loci as a function of the allele frequency at the first locus under three two-locus disease models: Dom ∪ Dom, Dom ∪ Rec, and Rec ∪ Rec (table 1). Like figure 6A, 6B, and 6C, figure 7A, 7B, and 7C demonstrated that using tSNPs to detect interaction between two disease loci has much lower power than does using disease loci themselves. Figure 7A, 7B, and 7C also showed that allele frequencies have large impact on the power of interaction detection, although the patterns of the impact are different under different two-locus disease models.
Figure 7. .

Power of the test statistic TI as a function of allele frequency at the first locus under a two-locus disease model. A, Dom ∪ Dom, under the assumptions that the number of individuals in both cases and controls are 500, penetrance parameter f=1, allele frequency at the second locus is 0.1, and significance level is 0.05. B, Dom ∪ Rec, under the assumptions that the number of individuals in both cases and controls are 500, penetrance parameter f=1, allele frequency at the second locus is 0.1, and significance level is 0.05. C, Rec ∪ Rec, under the assumptions that the number of individuals in both cases and controls are 500, penetrance parameter f=1, allele frequency at the second locus is 0.1, and significance level is 0.05.
Application to Real Data Examples
The proposed LD-based statistic was also applied to two real data sets. The first data set is a case-control study. It includes 398 white patients with breast cancer and 372 matched controls from the Ontario Familial Breast Cancer Registry.33 A total of 19 SNPs from 18 key genes from the pathways of DNA repair, cell cycle, carcinogen/estrogen metabolism, and immune system were typed. All SNPs were in HWE. Under a codominant model, multivariate logistic analysis found significant gene-gene interactions between four pairs of genes: XPD and IL10, GSTP1 and COMT, COMT and CCND1, and BARD1 and XPD.33 We used the statistic TI to test interactions between these four pairs of genes. The results are summarized in table 3. Table 3 also includes the crude P values obtained by Onay et al.33 When calculating the crude P values, Onay et al.33 included all the main effects as well as the only interested interaction term in their multivariate logistic regression model. Using our LD-based statistic, we also found these four pairs of significant interactions, however, with much smaller P values. Moreover, two pairs of significant interactions, XPD (Lys751Gln) with IL10 (G−1082A) and GSTP1 (Ile241Val) with COMT (Met108/158Val), remained significant after adjustment for multiple testing by use of Bonferroni correction. But all four pairs of significant interaction identified by logistic regression became nonsignificant after adjustment for multiple comparisons by use of the same Bonferroni correction procedure. It was noticed in Onay et al.33 that these four identified interactions can be justified by experiments and their biological relationships.33–37
Table 3. .
Comparison of P Values for Testing Gene-Gene Interactions (Example 1)
|
P Value Obtained by |
||
| Interaction Pair | Logistic Regressiona | LD-Based Statistic |
| XPD (Lys751Gln) and IL10 (G−1082A) | .035 | .00027 |
| BARD1 (Pro24Ser) and XPD (Lys751Gln) | .024 | .00684 |
| COMT (Met108/158Val) and CCND1 (Pro241Pro) | .010 | .00395 |
| GSTP1 (Ile105Val) and COMT (Met108/158Val) | .036 | .0000115 |
P values reported by Onay et al.33
The second data set was a birth cohort study that recorded the incidence of hospital admission with malaria and severe malaria from Kilifi District Hospital on the coast of Kenya in Africa.38 A total of 2,104 children from the study was genotyped for both hemoglobin (Hb) and α+-thalassemia genes to test their interaction. The Hb gene has two alleles, A and S. The mutant S causes sickle cell disease. The normal and mutant alleles in the gene α+-thalassemia are denoted by α and −. We applied the proposed statistic TI to this data to test interaction between the Hb and α+-thalassemia genes. The results are summarized in table 4. For comparison, table 4 also lists P values obtained by Poisson regression analysis performed by Williams et al.38 We can see that the P values of the test statistic TI were smaller than those of the Poisson regression analysis. Each of the structural variant HbS and α+-thalassemia is protective against severe Plasmodium falciparum malaria. However, if they were inherited together, protection against malaria was lost. The negative epistasis between these two genes can be explained by their biochemical functions.38 The malaria-protective effect of HbAs comes from allele Hbs, which might increase binding of hemichromes to the erythrocyte membrane, leading to opsonization and accelerating the removal of infected erythrocytes by phagocytosis. However, coexistence of α+-thalassemia with Hbs reduces the concentration of Hbs, which in turn reduces the protective effect of Hbs against malaria.
Table 4. .
Comparison of P Values for Testing Gene-Gene Interaction between the Hb and α+-Thalassemia Genes (Example 2)
| Malaria Admission |
P Value |
Severe Malaria |
P Value |
|||||
| Hemoglobin and α+-Thalassemia Alleles | No. of Cases | No. of Controls | Wald Testa | LD-Based Test | No. of Cases | No. of Controls | Wald Testa | LD-Based Test |
| HbAA: | ||||||||
| αα/αα | 168 | 458 | 67 | 559 | ||||
| −α/αα | 187 | 680 | 53 | 814 | ||||
| −α/−α | 56 | 246 | 17 | 285 | ||||
| HbAs: | ||||||||
| αα/αα | 6 | 107 | 0 | 113 | ||||
| −α/αα | 9 | 141 | 2 | 148 | ||||
| −α/−α | 10 | 36 | .026 | .000014 | 5 | 41 | .0012 | .00056 |
P values reported by Williams et al.38
Discussion
Understanding how genomic information underlies the development of complex diseases is one of the greatest challenges in the 21st century. In the past several decades, genetic studies of human disease have focused on a “locus-by-locus” paradigm.39 However, biological information is processed in complex networks. The disease emerges as the result of interactions between genes and between a gene and environments. Studying one individual gene or polymorphism at a time to explore the cause of the disease and ignoring the interaction between loci (genes) are unlikely to deeply unravel the mechanism of disease. With the imminent completion of the International HapMap Project, development of statistical methods for detecting gene-gene interaction is of great importance. The purpose of this article is to present a new statistic for identifying interaction between two unlinked loci.
Association studies rely heavily on the LD pattern between pairs of loci. Knowledge about the difference in LD between the disease and general populations is essential for understanding the interaction between two loci and their association with the disease. However, little is known about how the multiple-locus disease models influence the pattern of LD in the disease population and how the interaction between two functional SNPs generates the LD in a disease population. Therefore, before presenting the new statistic for detection of the interaction between two unlinked loci, we first developed the general theory to study LD patterns in a disease population under two-locus disease models. We introduced a new concept of haplotype penetrance and developed a measure of interaction between two unlinked loci. Surprisingly, the formula for calculating the interaction measure was very similar to that for calculating the LD measure. The proposed measure of interaction characterizes the contribution of interaction between two loci to the cause of disease. We also investigated how two-locus disease models and population parameters affect the measure of interaction between two unlinked loci. Intuitively, interaction indicates the joint action of two genes in the development of disease. This implies that some haplotypes spanned by the interacting loci occur more often in the disease population than expected. In other words, the interaction between two unlinked loci generates LD in the disease population and the LD level generated by gene-gene interaction depends on the magnitude of the interaction between two unlinked loci. We have rigorously proved that the measure of LD between two unlinked loci generated by their interaction was proportional to the measure of the interaction, which provided us the motivation to propose a statistic for testing interaction between two unlinked loci by comparing the difference in LD between the disease and general populations. Here, we should point out that, after finishing this manuscript, we noticed that a similar statistic was proposed to test association between a single gene and disease.40 Zaykin et al.41 called it the “LD contrast test.” However, this LD contrast test was originally designed to test the association of SNPs by assuming a single disease model. It has not been extended to testing gene-gene interaction.
To use the proposed LD-based statistic to test gene-gene interaction between two unlinked loci, we first examined its distribution under the null hypothesis of no interaction. Through extensive simulation studies (under the assumption of large-sample theory), we showed that the null distribution of the proposed LD-based statistic in both homogeneous and admixed populations was close to a central χ2(1) distribution. We also calculated type I error rates of the LD-based statistic by simulation. Our results showed that type I error rates were close to the nominal significance levels. We also investigated the power of the new statistic in detecting gene-gene interaction by analytic methods. It shows that its power was a function of the interaction measure, which implies that this new statistic, indeed, can be used to test interaction between two unlinked loci. However, power of the proposed statistic is a complex function. For example, except for the measure of interaction, it also depends on allele frequencies. Moreover, when the measure of interaction is beyond some range, power is no longer an increasing function of the interaction measure (data not shown). Power comparison with logistic regression analysis demonstrated that this LD-based test statistic has much higher power in detecting interaction than does the logistic regression method.
The widely used strategies for tSNP selection are based on a single-disease-gene model. The criteria for tSNP selection is based on the LD levels between the tSNP and disease-susceptibility locus, which ensures a certain power to detect association of a single disease locus with the disease. Our theoretical analysis and power studies demonstrated that such selected tSNPs are highly unlikely to ensure that the interactions between unlinked two loci will be detected.
To further evaluate its performance for detection of interaction between two loci, the proposed LD-based statistic was applied to two published data sets. Our results showed that, in general, P values of the test statistic TI were much smaller than those of other approaches, including logistic regression analysis.
Like all population-based methods for association studies, the proposed LD-based statistic for testing gene-gene interaction between two unlinked loci also suffers from the attribution-of-causality confound in situations of pleiotropy or overlapping clinical conditions. The detected interaction for a particular disease could actually relate to other diseases that may share common etiological effects with the disease of interest and are only indirectly associated with the disease of interest. Similar to population structure, epistatic selection will also create LD between two unlinked loci. If epistatic selection between two unlinked loci is irrelevant to the disease of interest, the level of LD created by epistatic selection in both cases and controls will be similar, and, in this case, the impact of epistatic selection on the false-positive rate is limited. However, when epistatic selection underlies the phenotypes that are indirectly associated with the disease of interest, it will cause confounding.
Similar to most models for LD, the proposed test statistic and measure of interaction between two unlinked loci require the assumption of HWE. Deviation from HWE will affect the false-positive rates. The measure of interaction in the presence of Hardy-Weinberg disequilibrium (HWD) is a complicated function of penetrance, allele frequencies, and the measure of HWD. A detailed analysis of the impact of HWD on the test for interaction is needed.
In the past years, more and more detailed and comprehensive evidence showed that genetic and molecular interactions govern cell behaviors, including cell division, differentiation, and death, and are primary factors for the development of diseases. In many cases, single-locus analysis fails to unravel the mechanism of disease. A locus-by-locus paradigm for genetic studies of complex diseases should be shifted to a new paradigm incorporating gene-gene interaction into genetic studies of complex diseases.
The results in this article are preliminary. Interaction between two linked loci or high-order interactions among multiple loci have not been studied. Gene-gene interaction is an important but complex concept. There are several ways to define gene-gene interaction. How the definition of gene-gene interaction on a population level reflects the genes' biochemical or physiological interaction is still a mystery. We hope that this work provides further motivation to conduct theoretical research in deciphering genetic and physiological meaning of gene-gene interactions and to develop more statistical methods for testing gene-gene interaction. In the coming years, the integration of gene-gene interaction into genomewide association analysis will be a major task in genetic studies of complex diseases.
Acknowledgments
We thank three anonymous reviewers for helpful comments on the manuscript, which led to much improvement of the article. M.X. is supported by National Institutes of Health (NIH)–National Institute of Arthritis and Musculoskeletal and Skin Diseases grant P01 AR052915-01A1, NIH grants HL74735 and ES09912, and Shanghai Commission of Science and Technology grant 04dz14003. J.Z. is supported by NIH grant ES09912.
Appendix A
By definition, we have
 |
Similarly, we can obtain the remaining formulas in equation (1) in the text.
By definition, the measure of LD in the disease population is given by
 |
By definition, we have
 |
Similarly, we obtain
Multiplying equation (A1) by equation (A2) yields
 |
which implies that
 |
Appendix B
Assume that marker locus M1 has two alleles, M1 and m1, and the marker locus M2 has two alleles, M2 and m2. Let the frequencies of the haplotypes D1M1, D1m1, d1M1, and d1m1 be PD1M1, PD1m1, Pd1M1, and Pd1m1, respectively. The frequencies of the haplotypes D2M2, D2m2, d2M2, and d2m2 can be similarly defined. Let the frequencies of the haplotypes M1M2, M1m2, m1M2, and m1m2 in the disease population be qA11, qA12, qA21, and qA22, respectively. Then, we have
 |
Similarly, we have
 |
 |
and
 |
Thus, after some algebra, we can obtain the LD between two marker loci in the disease population:
 |
Recall that the LD between two unlinked disease loci in the disease population is given by
 |
Therefore, the LD between two unlinked marker loci in the disease population can be rewritten as
 |
Appendix C
It is well known that the estimators of the haplotype frequencies  ,
,  , and
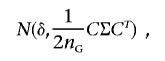
, and  are asymptotically distributed as a multivariate normal distribution N[P,(1/2nG)Σ], where P=[P11,P12,P21]T and Σ=diag(P11,P12,P21)-PPT. Let PA=[PA11,PA12,PA21]T. Similarly,
  is asymptotically distributed as N[PA,(1/2nA)ΣA], where
Since  is a function of the haplotype frequencies
  ,
,  , and
, and  , the estimated measure of LD,
  , is asymptotically distributed as shown by Serfling42:
 |
where
 |
However, we can show that
 |
First, we note that ∂h/∂PD1D2=1-PD1-PD2, ∂h/∂PD1d2=-PD2, and ∂h/∂Pd1D2=-PD1. Let V=CΣCT. After some algebra, we have
Since (1-PD1-PD2)PD1D2-PD2PD1d2-PD1Pd1D2=δ-PD1PD2, we have
 |
Note that
Substituting equation (C3) into equation (C2) yields
Collecting the coefficient of δ in the above equation (C4), we obtain
Substituting equation (C5) into equation (C4), we have
which proves equation (C1). Similarly,  is asymptotically distributed as N[δA,(1/2nA)VA]. Under the null hypothesis of no interaction between two unlinked loci, we have δA=δ=0. Therefore, the statistic TI is asymptotically distributed as a central χ2(1) distribution under the null hypothesis.
Now, we show that, under some assumption, the statistic TI is still a valid test in the admixed population. Consider an admixed population that is mixed from two subpopulations with proportions α and (1-α). It is known that the measure of LD in the admixed population is given by
where P(k)Di and δ(k) are the frequency of the allele Di and the measure of LD between two loci in the kth subpopulation (k=1,2), respectively. If we assume that
where PA(k)Di is the frequency of the allele Di in the kth disease subpopulation, then we have
Therefore, under the assumption (C6), the statistic TI is also asymptotically distributed as a central χ2(1) distribution under the null hypothesis of no interaction between two unlinked loci in the admixed population.
References
- 1.Cook NR, Zee RY, Ridker PM (2004) Tree and spline based association analysis of gene-gene interaction models for ischemic stroke. Stat Med 23:1439–1453 10.1002/sim.1749 [DOI] [PubMed] [Google Scholar]
- 2.Hansen TF, Wagner GP (2001) Modeling genetic architecture: a multilinear theory of gene interaction. Theor Popul Biol 59:61–86 10.1006/tpbi.2000.1508 [DOI] [PubMed] [Google Scholar]
- 3.Fisher RA (1918) The correlation between relatives on the supposition of Mendelian inheritance. Trans R Soc Edinb 3:399–433 [Google Scholar]
- 4.Cockerham CC (1954) An extension of the concept of partitioning hereditary variance for analysis of covariances among relatives when epistasis is present. Genetics 39:859–882 [DOI] [PMC free article] [PubMed] [Google Scholar]
- 5.Kempthorne O (1954) The correlation between relatives in a random mating population. Proc R Soc Lond B 143:103–113 [PubMed] [Google Scholar]
- 6.Wagner GP, Laubichler MD, Bagheri-Chaichian H (1998) Genetic measurement of theory of epistatic effects. Genetica 102–103:569–580 [PubMed] [Google Scholar]
- 7.Hosmer DW, Lemeshow S (2000) Applied logistic regression. John Wiley & Sons, New York [Google Scholar]
- 8.Cheverud JM, Routman EJ (1995) Epistasis and its contribution to genetic variance components. Genetics 139:1455–1461 [DOI] [PMC free article] [PubMed] [Google Scholar]
- 9.Kooperberg C, Ruczinski I (2005) Identifying interacting SNPs using Monte Carlo logic regression. Genet Epidemiol 28:157–170 10.1002/gepi.20042 [DOI] [PubMed] [Google Scholar]
- 10.Kooperberg C, Ruczinski I, LeBlanc ML, Hsu L (2001) Sequence analysis using logic regression. Genet Epidemiol Suppl 1 21:S626–S631 [DOI] [PubMed] [Google Scholar]
- 11.Ruczinski I, Kooperberg C, LeBlanc M (2003) Logic regression. J Comput Graph Stat 12:475–511 10.1198/1061860032238 [DOI] [Google Scholar]
- 12.Nelson MR, Kardia SL, Ferrell RE, Sing CF (2001) A combinatorial partitioning method to identify multilocus genotypic partitions that predict quantitative trait variation. Genome Res 11:458–470 10.1101/gr.172901 [DOI] [PMC free article] [PubMed] [Google Scholar]
- 13.Ritchie MD, Hahn LW, Roodi N, Bailey LR, Dupont WD, Parl FF, Moore JH (2001) Multifactor-dimensionality reduction reveals high-order interactions among estrogen-metabolism genes in sporadic breast cancer. Am J Hum Genet 69:138–147 [DOI] [PMC free article] [PubMed] [Google Scholar]
- 14.Moore JH, Hahn LW (2002) A cellular automata approach to detecting interactions among single-nucleotide polymorphisms in complex multifactorial diseases. Pac Symp Biocomput 53–64 [PubMed] [Google Scholar]
- 15.Bastone L, Reilly M, Rader DJ, Foulkes AS (2004) MDR and PRP: a comparison of methods for high-order genotype-phenotype associations. Hum Hered 58:82–92 10.1159/000083029 [DOI] [PubMed] [Google Scholar]
- 16.Williams SM, Ritchie MD, Phillips JA 3rd, Dawson E, Prince M, Dzhura E, Willis A, Semenya A, Summar M, White BC, Addy JH, Kpodonu J, Wong LJ, Felder RA, Jose PA, Moore JH (2004) Multilocus analysis of hypertension: a hierarchical approach. Hum Hered 57:28–38 10.1159/000077387 [DOI] [PubMed] [Google Scholar]
- 17.Soares ML, Coelho T, Sousa A, Batalov S, Conceicao I, Sales-Luis ML, Ritchie MD, Williams SM, Nievergelt CM, Schork NJ, Saraiva MJ, Buxbaum JN (2005) Susceptibility and modifier genes in Portuguese transthyretin V30M amyloid polyneuropathy: complexity in a single-gene disease. Hum Mol Genet 14:543–553 10.1093/hmg/ddi051 [DOI] [PubMed] [Google Scholar]
- 18.Foulkes AS, De Gruttola V, Hertogs K (2004) Combining genotype groups and recursive partitioning: an application to human immunodeficiency virus type 1 genetics data. Appl Stat 53:311–323 [Google Scholar]
- 19.Cho YM, Ritchie MD, Moore JH, Park JY, Lee KU, Shin HD, Lee HK, Park KS (2004) Multifactor-dimensionality reduction shows a two-locus interaction associated with type 2 diabetes mellitus. Diabetologia 47:549–554 10.1007/s00125-003-1321-3 [DOI] [PubMed] [Google Scholar]
- 20.Coffey CS, Hebert PR, Ritchie MD, Krumholz HM, Gaziano JM, Ridker PM, Brown NJ, Vaughan DE, Moore JH (2004) An application of conditional logistic regression and multifactor dimensionality reduction for detecting gene-gene interactions on risk of myocardial infarction: the importance of model validation. BMC Bioinformatics 5:49 10.1186/1471-2105-5-49 [DOI] [PMC free article] [PubMed] [Google Scholar]
- 21.Tsai CT, Lai LP, Lin JL, Chiang FT, Hwang JJ, Ritchie MD, Moore JH, Hsu KL, Tseng CD, Liau CS, Tseng YZ (2004) Renin-angiotensin system gene polymorphisms and atrial fibrillation. Circulation 109:1640–1646 10.1161/01.CIR.0000124487.36586.26 [DOI] [PubMed] [Google Scholar]
- 22.Moore JH, Williams SM (2002) New strategies for identifying gene-gene interactions in hypertension. Ann Med 34:88–95 10.1080/07853890252953473 [DOI] [PubMed] [Google Scholar]
- 23.Williams SM, Addy JH, Phillips JA 3rd, Dai M, Kpodonu J, Afful J, Jackson H, Joseph K, Eason F, Murray MM, Epperson P, Aduonum A, Wong LJ, Jose PA, Felder RA (2000) Combinations of variations in multiple genes are associated with hypertension. Hypertension 36:2–6 [DOI] [PubMed] [Google Scholar]
- 24.Zhu X, Bouzekri N, Southam L, Cooper RS, Adeyemo A, McKenzie CA, Luke A, Chen G, Elston RC, Ward R (2001) Linkage and association analysis of angiotensin I–converting enzyme (ACE)–gene polymorphisms with ACE concentration and blood pressure. Am J Hum Genet 68:1139–1148 [DOI] [PMC free article] [PubMed] [Google Scholar]
- 25.Takahashi N, Murakami H, Kodama K, Kasagi F, Yamada M, Nishishita T, Inagami T (2000) Association of a polymorphism at the 5′-region of the angiotensin II type 1 receptor with hypertension. Ann Hum Genet 64:197–205 10.1046/j.1469-1809.2000.6430197.x [DOI] [PubMed] [Google Scholar]
- 26.Xiong M, Zhao J, Boerwinkle E (2002) Generalized T2 test for genome association studies. Am J Hum Genet 70:1257–1268 [DOI] [PMC free article] [PubMed] [Google Scholar]
- 27.Neuman RJ, Rice JP (1992) Two-locus models of disease. Genet Epidemiol 9:347–365 10.1002/gepi.1370090506 [DOI] [PubMed] [Google Scholar]
- 28.Schork NJ, Boehnke M, Terwilliger JD, Ott J (1993) Two-trait-locus linkage analysis: a powerful strategy for mapping complex genetic traits. Am J Hum Genet 53:1127–1136 [PMC free article] [PubMed] [Google Scholar]
- 29.Weir BS (1990) Genetic data analysis. Sinauer Associates, Sunderland, MA [Google Scholar]
- 30.Nothnagel M (2002) Simulation of LD block-structured SNP haplotype data and its use for the analysis of case-control data by supervised learning methods. Am J Hum Genet Suppl 71:A2363 [Google Scholar]
- 31.Gauderman WJ (2002) Sample size requirements for association studies of gene-gene interaction. Am J Epidemiol 155:478–484 10.1093/aje/155.5.478 [DOI] [PubMed] [Google Scholar]
- 32.Byng MC, Whittaker JC, Cuthbert AP, Mathew CG, Lewis CM (2003) SNP subset selection for genetic association studies. Ann Hum Genet 67:543–556 10.1046/j.1529-8817.2003.00055.x [DOI] [PubMed] [Google Scholar]
- 33.Onay VU, Briollais L, Knight JA, Shi E, Wang Y, Wells S, Li H, Rajendram I, Andrulis IL, Ozcelik H (2006) SNP-SNP interactions in breast cancer susceptibility. BMC Cancer 6:114 10.1186/1471-2407-6-114 [DOI] [PMC free article] [PubMed] [Google Scholar]
- 34.Wang XW, Vermeulen W, Coursen JD, Gibson M, Lupold SE, Forrester K, Xu G, Elmore L, Yeh H, Hoeijmakers JH, Harris CC (1996) The XPB and XPD DNA helicases are components of the p53-mediated apoptosis pathway. Genes Dev 10:1219–1232 [DOI] [PubMed] [Google Scholar]
- 35.Fabbro M, Savage K, Hobson K, Deans AJ, Powell SN, McArthur GA, Khanna KK (2004) BRCA1-BARD1 complexes are required for p53Ser-15 phosphorylation and a G1/S arrest following ionizing radiation-induced DNA damage. J Biol Chem 279:31251–31258 10.1074/jbc.M405372200 [DOI] [PubMed] [Google Scholar]
- 36.Lu F, Gladden AB, Diehl JA (2003) An alternatively spliced cyclin D1 isoform, cyclin D1b, is a nuclear oncogene. Cancer Res 63:7056–7061 [PubMed] [Google Scholar]
- 37.Mitrunen K, Hirvonen A (2003) Molecular epidemiology of sporadic breast cancer: the role of polymorphic genes involved in oestrogen biosynthesis and metabolism. Mutat Res 544:9–41 10.1016/S1383-5742(03)00016-4 [DOI] [PubMed] [Google Scholar]
- 38.Williams TN, Mwangi TW, Wambua S, Peto TE, Weatherall DJ, Gupta S, Recker M, Penman BS, Uyoga S, Macharia A, Mwacharo JK, Snow RW, Marsh K (2005) Negative epistasis between the malaria-protective effects of α+-thalassemia and the sickle cell trait. Nat Genet 37:1253–1257 10.1038/ng1660 [DOI] [PMC free article] [PubMed] [Google Scholar]
- 39.Marchini J, Donnelly P, Cardon LR (2005) Genome-wide strategies for detecting multiple loci that influence complex diseases. Nat Genet 37:413–417 10.1038/ng1537 [DOI] [PubMed] [Google Scholar]
- 40.Nielsen DM, Ehm MG, Zaykin DV, Weir BS (2004) Effect of two- and three-locus linkage disequilibrium on the power to detect marker/phenotype associations. Genetics 168:1029–1040 10.1534/genetics.103.022335 [DOI] [PMC free article] [PubMed] [Google Scholar]
- 41.Zaykin DV, Meng Z, Ehm MG (2006) Contrasting linkage-disequilibrium patterns between cases and controls as a novel association-mapping method. Am J Hum Genet 78:737–746 [DOI] [PMC free article] [PubMed] [Google Scholar]
- 42.Serfling RJ (1980) Approximation theorems of mathematical statistics. John Wiley & Sons, New York [Google Scholar]