

Abstract
Selection, recombination, and the demographic history of a species can all have profound effects on genomewide patterns of variability. To assess the impact of these forces in the genome of Drosophila miranda, we examine polymorphism and divergence patterns at 62 loci scattered across the genome. In accordance with recent findings in D. melanogaster, we find that noncoding DNA generally evolves more slowly than synonymous sites, that the distribution of polymorphism frequencies in noncoding DNA is significantly skewed toward rare variants relative to synonymous sites, and that long introns evolve significantly slower than short introns or synonymous sites. These observations suggest that most noncoding DNA is functionally constrained and evolving under purifying selection. However, in contrast to findings in the D. melanogaster species group, we find little evidence of adaptive evolution acting on either coding or noncoding sequences in D. miranda. Levels of linkage disequilibrium (LD) in D. miranda are comparable to those observed in D. melanogaster, but vary considerably among chromosomes. These patterns suggest a significantly lower rate of recombination on autosomes, possibly due to the presence of polymorphic autosomal inversions and/or differences in chromosome sizes. All chromosomes show significant departures from the standard neutral model, including too much heterogeneity in synonymous site polymorphism relative to divergence among loci and a general excess of rare synonymous polymorphisms. These departures from neutral equilibrium expectations are discussed in the context of nonequilibrium models of demography and selection.
THE emergence of large-scale multilocus polymorphism data in several species, including Arabidopsis, maize, Drosophila, and humans, is allowing us to test evolutionary hypotheses on an unprecedented scale (e.g., International HapMap Consortium 2003; Andolfatto 2005; Bustamante et al. 2005; Hinds et al. 2005; Nordborg et al. 2005; Ometto et al. 2005; Wright et al. 2005). Most of the Drosophila data are from Drosophila melanogaster, the subject of the first survey of sequence-level variability (Kreitman 1983) and for which we have a wealth of prior information, including an annotated genome sequence (Adams et al. 2000). The ever-increasing wealth of polymorphism and divergence data from Drosophila over the past decade is overturning neutralist views (Kimura 1983) that adaptive evolution is infrequent at the molecular level and that most noncoding DNA evolves essentially neutrally. In particular, multilocus studies have revealed surprisingly high levels of selective constraint in noncoding regions of the Drosophila genome (Bergman and Kreitman 2001; Halligan et al. 2004; Kawahara et al. 2004; Andolfatto 2005; Haddrill et al. 2005a; Halligan and Keightley 2006) and, intriguingly, evidence that a considerable fraction of the divergence between species at both nonsynonymous sites and noncoding DNA was driven to fixation by positive selection (Jenkins et al. 1995; Fay et al. 2002; Smith and Eyre-Walker 2002; Sawyer et al. 2003; Bierne and Eyre-Walker 2004; Kohn et al. 2004; Andolfatto 2005).
Several other polymorphism patterns in the D. melanogaster and D. simulans genomes also suggest genomewide departures from the neutral model, including more linkage disequilibrium (LD) than predicted by comparisons of physical and genetic maps (Andolfatto and Przeworski 2000) and evidence for differences in levels of LD and levels of variability among chromosomes (Begun and Whitley 2000; Andolfatto 2001; Wall et al. 2002; Andolfatto and Wall 2003). In addition, large data sets in D. melanogaster suggest far more than expected heterogeneity in relative levels of polymorphism and divergence across the genome both in recently founded (Glinka et al. 2003; Orengo and Aguade 2004) and in older (Haddrill et al. 2005b) populations. While these patterns have been interpreted in the context of selection models (Hudson et al. 1987; Begun and Whitley 2000; Andolfatto 2001; Orengo and Aguade 2004; Ometto et al. 2005), purely demographic hypotheses have proven difficult to reject as alternative explanations (Wall et al. 2002; Haddrill et al. 2005b; Thornton and Andolfatto 2006).
One approach to making further progress in distinguishing demographic and selective effects on genome variability is either to focus on populations that are likely to have had a more stable demographic history (e.g., Andolfatto and Wall 2003) or to use a comparative approach by investigating genomewide variability patterns in more species. The recent completion of the D. pseudoobscura genome (Richards et al. 2005) makes the species group to which it belongs an attractive model for such studies. Unlike D. melanogaster and D. simulans, species in the D. pseudoobscura group are not human commensals and have likely had a more stable demography. Thus, multilocus data from D. pseudoobscura and its close relatives will complement studies being carried out in the D. melanogaster group and hopefully provide both independent verification and new insights into the underlying causes of many of the interesting departures from neutrality observed in the melanogaster species group.
D. miranda, a close relative of D. pseudoobscura, has already proven a useful model to study incipient sex chromosome evolution (Bachtrog 2005). Here, we analyze sequence polymorphism data from 62 loci in D. miranda (∼78 kb in total) sequenced from 12 lines of D. miranda. The goals of this study are several. First, we investigate whether patterns of evolutionary constraint and adaptive divergence at nonsynonymous and noncoding DNA sites relative to synonymous sites in D. miranda–D. pseudoobscura comparisons resemble those found in comparisons of species in the D. melanogaster group. Second, we estimate levels of linkage disequilibrium from nucleotide polymorphism data at loci surveyed on different chromosomes, to make inferences about patterns of recombination in this species. Third, we use multilocus polymorphism data to test whether D. miranda fits the assumptions of a randomly mating population at neutral equilibrium (hereafter, the standard neutral model, SNM). Previous studies based on fewer loci have suggested that, if excluding individual outliers, patterns of variability in D. miranda generally fit the assumption of the SNM (Yi and Charlesworth 2000; Bachtrog and Charlesworth 2002; Bachtrog 2003a, 2004; Yi et al. 2003; Bartolomé et al. 2005). We show that this conclusion does not hold in a larger D. miranda data set, particularly when accounting for the effect of intragenic recombination. We perform exploratory simulations to assess the fit of some models of selection and demography as putative causes for this departure from the SNM.
MATERIALS AND METHODS
Fly stocks:
The following D. miranda lines were used for the sequence analyses, with their geographic origin given in parentheses: 0101.3, 0101.4, 0101.5, and 0101.7 (Port Coquitlam, British Columbia, Canada); 0101.9, MA28, and MA32 (Mather, CA); MSH22 and MSH38 (Mount St. Helena, CA); and SP138, SP235, and SP295 (Spray, OR). Flies were cultured on banana medium at 18°.
DNA sequencing:
Polymorphism data for 35 of the 62 loci studied were published previously (see appendix a for references). We collected new sequence data for an additional 27 loci from the neo-X and the X chromosome of D. miranda. Genomic DNA was extracted from a single male fly of each line using the Puregene DNA extraction kit. PCR products were amplified as ∼500- to 2000-bp fragments from genomic DNA, using primer pairs designed from sequenced λ-clones isolated from a D. miranda genomic library (Bachtrog and Charlesworth 2002) or from the D. pseudoobscura genome sequence (Richards et al. 2005). PCR products were used as sequencing templates after treatment with a shrimp alkaline phosphatase/exonuclease I mixture to remove primers and unincorporated nucleotides. Gene-specific internal primers and the original amplification primers were used for sequencing with the BigDye 3.0 cycle sequencing kit (Applied Biosystems, Foster City, CA) following the manufacturer's protocol and sequences were run on an ABI 3730 automated sequencer. We obtained polymorphism data for 29,232 bp of neo-X-linked sequence (from 26 genes) and 928 bp from one gene on the X chromosome in 12 lines of D. miranda (see appendix b). All primers and amplification conditions are available upon request to D. Bachtrog. Sequence trace files were proofread and aligned using Sequencher (Gene Codes, Ann Arbor, MI).
APPENDIX A.
Overview of each gene region used in this study
| Locus | Chromosomal location | No. of sites | No. of codons | Synonymous sites | Nonsynonymous sites | Noncoding sites | Reference |
|---|---|---|---|---|---|---|---|
| Arc32 | Neo-X | 1,011 | 252 | 180.0 | 576.0 | 255 | This study |
| az2 | Neo-X | 1,207 | 383 | 252.4 | 896.6 | 56 | This study |
| CG13575 | Neo-X | 1,184 | 352 | 258.3 | 797.7 | 128 | This study |
| CG15658 | Neo-X | 1,145 | 275 | 201.2 | 623.8 | 304 | This study |
| CG16799 | Neo-X | 4,328 | 165 | 110.5 | 384.5 | 2,301 | Bachtrog (2003) |
| CG16935 | Neo-X | 1,221 | 339 | 243.6 | 773.4 | 200 | This study |
| CG30035 | Neo-X | 1,093 | 333 | 258.5 | 740.5 | 91 | This study |
| CG30152 | Neo-X | 2,900 | 166 | 117.3 | 380.7 | 2,290 | Bachtrog (2003) |
| CG30259 | Neo-X | 1,175 | 326 | 236.1 | 741.9 | 197 | This study |
| CG3700 | Neo-X | 1,175 | 347 | 244.2 | 796.8 | 134 | This study |
| CG3831 | Neo-X | 1,145 | 364 | 277.2 | 814.8 | 51 | This study |
| CG5721 | Neo-X | 1,201 | 393 | 280.2 | 898.8 | 20 | This study |
| CG6758 | Neo-X | 1,206 | 380 | 280.3 | 847.7 | 61 | This study |
| CG8778 | Neo-X | 1,213 | 298 | 225.6 | 668.4 | 319 | This study |
| CG9001 | Neo-X | 1,124 | 374 | 265.8 | 856.2 | 0 | This study |
| CG9313 | Neo-X | 1,220 | 364 | 239.6 | 852.4 | 126 | This study |
| clt | Neo-X | 1,166 | 367 | 249.1 | 851.9 | 61 | This study |
| CycB | Neo-X | 1,879 | 459 | 326.1 | 1,023.9 | 493 | Bachtrog and Charlesworth (2002) |
| Cyp4e1 | Neo-X | 1,205 | 362 | 246.9 | 839.1 | 117 | This study |
| Cyp6t3 | Neo-X | 681 | 226 | 163.2 | 484.8 | 0 | This study |
| dpn | Neo-X | 1,015 | 37 | 21.5 | 89.5 | 855 | This study |
| eng | Neo-X | 398 | 9 | 3.0 | 15.0 | 349 | Bachtrog and Charlesworth (2002) |
| eve | Neo-X | 1,237 | 215 | 166.4 | 466.6 | 560 | Bachtrog and Charlesworth (2002) |
| Exu1 | Neo-X | 2,631 | 497 | 348.9 | 1,133.1 | 1,002 | Bachtrog (2003) |
| fragment 1 | Neo-X | 1,543 | 0 | 0.0 | 0.0 | 1,462 | Bachtrog (2003) |
| Lcp1 | Neo-X | 760 | 129 | 91.3 | 295.7 | 373 | Yi and Charlesworth (2000) |
| Lcp2 | Neo-X | 604 | 126 | 89.6 | 288.4 | 222 | This study |
| Lcp3 | Neo-X | 541 | 112 | 82.1 | 253.9 | 199 | Yi and Charlesworth (2000) |
| Lcp4 | Neo-X | 534 | 113 | 82.1 | 253.9 | 192 | This study |
| mle | Neo-X | 1,936 | 465 | 262.7 | 811.3 | 535 | This study |
| PpD | Neo-X | 1,095 | 329 | 242.7 | 744.3 | 108 | This study |
| robo | Neo-X | 1,766 | 422 | 299.9 | 966.1 | 499 | Bachtrog and Charlesworth (2002) |
| RpI128 | Neo-X | 1,252 | 417 | 295.3 | 955.7 | 0 | This study |
| T3dh | Neo-X | 1,196 | 357 | 271.2 | 799.8 | 122 | This study |
| tud | Neo-X | 955 | 318 | 230.1 | 717.9 | 0 | This study |
| Ugt58Fa | Neo-X | 1,268 | 393 | 288.1 | 890.9 | 87 | This study |
| Est5B/5C | Chr XR | 539 | 0 | 0.0 | 0.0 | 534 | Yi et al. (2003) |
| AnnX | Chr XL | 844 | 204 | 142.0 | 470.0 | 222 | Bartolomeet al. (2005) |
| CG7744 | Chr XL | 928 | 270 | 200.2 | 609.8 | 118 | This study |
| Cyp1 | Chr XL | 584 | 0 | 0.0 | 0.0 | 583 | Yi et al. (2003) |
| elav | Chr XL | 543 | 181 | 137.5 | 405.5 | 0 | Yi et al. (2003) |
| Gapdh2 | Chr XL | 768 | 256 | 190.5 | 577.5 | 0 | Yi et al. (2003) |
| per | Chr XL | 1,424 | 217 | 155.1 | 495.9 | 518 | Yi et al. (2003) |
| per-ori | Chr XL | 1,480 | 385 | 281.5 | 873.5 | 317 | Yi et al. (2003) |
| runt | Chr XL | 641 | 114 | 88.8 | 253.2 | 270 | Yi et al. (2003) |
| scute | Chr XL | 995 | 222 | 158.0 | 508.0 | 307 | Yi et al. (2003) |
| sesB | Chr XL | 874 | 237 | 169.4 | 541.6 | 154 | Yi et al. (2003) |
| sisA | Chr XL | 1,965 | 206 | 153.0 | 465.0 | 1,180 | Yi et al. (2003) |
| swallow | Chr XL | 1,109 | 323 | 227.7 | 741.4 | 139 | Yi et al. (2003) |
| ade3 | Chr 4 | 2,162 | 459 | 347.9 | 1,029.1 | 524 | Bartolomé et al. (2005) |
| Adh/Adhrel | Chr 4 | 2,122 | 286 | 216.2 | 641.8 | 1,184 | Yi et al. (2003) |
| amd | Chr 4 | 1,370 | 304 | 217.4 | 694.6 | 434 | Bartolomé et al. (2005) |
| Ddc | Chr 4 | 912 | 304 | 216.3 | 695.7 | 0 | Bartolomé et al. (2005) |
| Eno | Chr 4 | 1,188 | 373 | 268.0 | 851.0 | 69 | Bartolomé et al. (2005) |
| Lam | Chr 4 | 1,585 | 499 | 339.2 | 1,157.8 | 88 | Bartolomé et al. (2005) |
| Uro | Chr 4 | 914 | 284 | 196.9 | 655.1 | 56 | Bartolomé et al. (2005) |
| bcd | Chr 2 | 1,116 | 349 | 250.0 | 785.0 | 68 | Bartolomé et al. (2005) |
| Bruce | Chr 2 | 925 | 219 | 151.4 | 502.6 | 259 | Bartolomé et al. (2005) |
| Gld | Chr 2 | 1,350 | 450 | 329.5 | 1,020.5 | 0 | Bartolomé et al. (2005) |
| hyd | Chr 2 | 1,159 | 301 | 203.5 | 699.5 | 234 | Bartolomé et al. (2005) |
| rosy | Chr 2 | 2,357 | 765 | 570.0 | 1,725.0 | 62 | Bartolomé et al. (2005) |
| sry-alpha | Chr 2 | 495 | 165 | 120.4 | 374.6 | 0 | Yi et al. (2003) |
| Total | Neo-X | 47,210 | 10,464 | 7,431.0 | 23,532.0 | 13,769 | |
| Total | X | 12,694 | 2,615 | 1,903.8 | 5,941.2 | 4,342 | |
| Total | Autosomes | 17,655 | 4,758 | 3,426.9 | 10,832.1 | 2,978 | |
| Total | All chromosomes | 77,559 | 17,837 | 12,761.7136 | 40,305.3 | 21,089 |
APPENDIX B.
Summary statistics for each gene region used in this study
| Synonymous sites
|
Nonsynonymous sites
|
Noncoding sites
|
|||||||||||||
|---|---|---|---|---|---|---|---|---|---|---|---|---|---|---|---|
| Locus | S | π (%) | θ (%) | Taj D | Ks (JC) | S | π (%) | θ (%) | Taj D | Ks (JC) | S | π (%) | θ (%) | Taj D | Ks (JC) |
| Arc32 | 3 | 0.43 | 0.55 | −0.73 | 4.63 | 0 | 0.00 | 0.00 | 0.00 | 1 | 0.16 | 0.13 | 0.53 | 3.51 | |
| az2 | 0 | 0.00 | 0.00 | — | 3.65 | 1 | 0.06 | 0.04 | 1.50 | 0.39 | 0 | 0.00 | 0.00 | — | 0.00 |
| CG13575 | 5 | 0.47 | 0.64 | −0.99 | 5.14 | 2 | 0.04 | 0.08 | −1.44 | 1.03 | 0 | 0.00 | 0.00 | — | 3.19 |
| CG15658 | 1 | 0.08 | 0.17 | −1.14 | 1.55 | 0 | 0.00 | 0.00 | — | 0.00 | 3 | 0.16 | 0.33 | −1.63 | 1.75 |
| CG16799 | 6 | 1.37 | 1.80 | −0.91 | 4.99 | 3 | 0.30 | 0.26 | 0.48 | 1.82 | 33 | 0.33 | 0.48 | −1.36 | 2.64 |
| CG16935 | 3 | 0.42 | 0.41 | 0.07 | 6.91 | 2 | 0.13 | 0.09 | 1.55 | 1.01 | 3 | 0.32 | 0.50 | −1.18 | 1.18 |
| CG30035 | 11 | 1.02 | 1.41 | −1.15 | 2.49 | 0 | 0.00 | 0.00 | — | 0.14 | 3 | 0.70 | 1.09 | −1.18 | 3.76 |
| CG30152 | 0 | 0.00 | 0.00 | — | 1.73 | 0 | 0.00 | 0.00 | — | 0.00 | 18 | 0.17 | 0.26 | −1.60 | 3.44 |
| CG30259 | 12 | 1.93 | 1.68 | 0.62 | 6.87 | 9 | 0.34 | 0.40 | −0.59 | 0.85 | 6 | 0.98 | 1.01 | −0.12 | 4.85 |
| CG3700 | 0 | 0.00 | 0.00 | — | 5.52 | 0 | 0.00 | 0.00 | — | 0.50 | 0 | 0.00 | 0.00 | — | 9.54 |
| CG3831 | 2 | 0.12 | 0.24 | −1.45 | 5.68 | 0 | 0.00 | 0.00 | — | 0.25 | 0 | 0.00 | 0.00 | — | 6.13 |
| CG5721 | 5 | 0.54 | 0.59 | −0.31 | 2.54 | 1 | 0.06 | 0.04 | 1.51 | 0.28 | 0 | 0.00 | 0.00 | — | 0.00 |
| CG6758 | 1 | 0.06 | 0.12 | −1.15 | 3.69 | 0 | 0.00 | 0.00 | — | 0.47 | 0 | 0.00 | 0.00 | — | 1.66 |
| CG8778 | 0 | 0.00 | 0.00 | — | 2.71 | 1 | 0.03 | 0.05 | −1.14 | 0.46 | 1 | 0.13 | 0.10 | 0.54 | 2.31 |
| CG9001 | 8 | 0.85 | 1.00 | −0.59 | 4.56 | 1 | 0.02 | 0.04 | −1.17 | 1.78 | — | — | — | — | — |
| CG9313 | 1 | 0.13 | 0.14 | −0.20 | 3.05 | 0 | 0.00 | 0.00 | — | 0.47 | 2 | 0.37 | 0.53 | −0.85 | 4.29 |
| clt | 1 | 0.12 | 0.13 | −0.19 | 8.12 | 5 | 0.20 | 0.19 | 0.16 | 1.20 | 0 | 0.00 | 0.00 | — | 5.09 |
| CycB | 4 | 0.34 | 0.41 | −0.54 | 7.63 | 0 | 0.00 | 0.00 | — | 2.58 | 1 | 0.10 | 0.07 | 1.05 | 2.34 |
| Cyp4e1 | 3 | 0.26 | 0.40 | −1.18 | 7.30 | 5 | 0.17 | 0.20 | −0.45 | 1.04 | 3 | 0.43 | 0.85 | −1.63 | 5.47 |
| Cyp6t3 | 1 | 0.10 | 0.20 | −1.14 | 3.82 | 1 | 0.03 | 0.07 | −1.15 | 0.43 | — | — | — | — | |
| dpn | 0 | 0.00 | 0.00 | — | 0.00 | 0 | 0.00 | 0.00 | — | 0.00 | 15 | 0.36 | 0.58 | −1.63 | 2.32 |
| eng | — | — | — | — | — | — | — | — | — | — | 9 | 0.79 | 0.85 | −0.30 | 3.60 |
| eve | 9 | 1.50 | 1.79 | −0.66 | 4.49 | 1 | 0.09 | 0.07 | 0.55 | 0.05 | 14 | 0.86 | 0.83 | 0.18 | 1.98 |
| Exu1 | 1 | 0.05 | 0.10 | −1.14 | 6.93 | 0 | 0.00 | 0.00 | — | 3.15 | 7 | 0.12 | 0.23 | −1.95 | 3.64 |
| fragment 1 | — | — | — | — | — | — | — | — | — | — | 24 | 0.44 | 0.54 | −0.83 | 2.10 |
| Lcp1 | 2 | 0.52 | 0.73 | −0.85 | 1.38 | 2 | 0.11 | 0.22 | −1.45 | 0.40 | 0 | 0.00 | 0.00 | — | 2.45 |
| Lcp2 | 4 | 0.74 | 1.48 | −1.75 | 3.62 | 1 | 0.06 | 0.12 | −1.14 | 1.43 | 2 | 0.32 | 0.30 | 0.22 | 2.95 |
| Lcp3 | 1 | 0.50 | 0.40 | 0.54 | 4.71 | 0 | 0.00 | 0.00 | — | 0.79 | 2 | 0.17 | 0.33 | −1.45 | 3.17 |
| Lcp4 | 3 | 0.94 | 1.21 | −0.73 | 6.79 | 0 | 0.00 | 0.00 | — | 0.83 | 3 | 0.60 | 0.52 | 0.52 | 4.20 |
| mle | 3 | 0.33 | 0.38 | −0.43 | 2.61 | 2 | 0.06 | 0.08 | −0.85 | 0.28 | 0 | 0.00 | 0.00 | — | 3.64 |
| PpD | 0 | 0.00 | 0.00 | — | 5.56 | 0 | 0.00 | 0.00 | — | 1.08 | 0 | 0.00 | 0.00 | — | 4.78 |
| robo | 14 | 1.74 | 1.55 | 0.53 | 5.47 | 3 | 0.09 | 0.10 | −0.44 | 0.08 | 3 | 0.20 | 0.20 | −0.03 | 0.62 |
| RpI128 | 4 | 0.41 | 0.45 | −0.30 | 8.48 | 1 | 0.03 | 0.04 | −0.18 | 0.12 | — | — | — | — | — |
| T3dh | 1 | 0.06 | 0.12 | −1.15 | 4.59 | 1 | 0.02 | 0.04 | −1.13 | 0.39 | 1 | 0.40 | 0.27 | 1.06 | 7.16 |
| tud | 2 | 0.15 | 0.29 | −1.45 | 1.83 | 0 | 0.00 | 0.00 | — | 0.84 | — | — | — | — | — |
| Ugt58Fa | 3 | 0.27 | 0.35 | −0.73 | 2.02 | 6 | 0.16 | 0.22 | −1.11 | 0.54 | 1 | 0.35 | 0.38 | −0.20 | 3.73 |
| Average neo-X | 3.41 | 0.46 | 0.56 | −0.69 | 4.45 | 1.44 | 0.06 | 0.07 | −0.38 | 0.73 | 4.42 | 0.31 | 0.37 | −0.51 | 3.36 |
| AnnX | 0 | 0.00 | 0.00 | — | 8.96 | 1 | 0.04 | 0.07 | −1.16 | 0.02 | 0 | 0.00 | 0.00 | — | 3.22 |
| CG7744 | 1 | 0.08 | 0.17 | −1.14 | 3.62 | 2 | 0.06 | 0.11 | −1.44 | 2.19 | 2 | 0.40 | 0.56 | −0.85 | 5.19 |
| Cyp1 | — | — | — | — | — | — | — | — | — | — | 11 | 0.49 | 0.63 | −0.92 | 2.10 |
| elav | 0 | 0.00 | 0.00 | — | 5.27 | 0 | 0.00 | 0.00 | — | 0.00 | — | — | — | — | — |
| Est5B/5C | — | — | — | — | — | — | — | — | — | — | 13 | 0.54 | 0.81 | −1.42 | 2.77 |
| Gapdh2 | 0 | 0.00 | 0.00 | — | 3.22 | 0 | 0.00 | 0.00 | — | 0.00 | — | — | — | — | — |
| per | 2 | 0.30 | 0.43 | −0.85 | 1.47 | 1 | 0.03 | 0.07 | −1.13 | 0.02 | 9 | 0.49 | 0.58 | −0.63 | 7.19 |
| per-ori | 5 | 0.57 | 0.59 | −0.11 | 4.89 | 9 | 0.36 | 0.34 | 0.19 | 1.50 | 4 | 0.47 | 0.42 | 0.42 | 3.72 |
| runt | 4 | 1.26 | 1.49 | −0.54 | 1.13 | 1 | 0.07 | 0.13 | −1.14 | 0.03 | 16 | 1.81 | 1.96 | −0.34 | 3.12 |
| scute | 2 | 0.36 | 0.42 | −0.38 | 1.49 | 2 | 0.11 | 0.13 | −0.39 | 0.26 | 3 | 0.21 | 0.32 | −1.18 | 2.43 |
| sesB | 1 | 0.10 | 0.20 | −1.14 | 2.45 | 0 | 0.00 | 0.00 | — | 0.37 | 3 | 0.57 | 0.65 | −0.38 | 5.38 |
| sisA | 3 | 0.83 | 0.65 | 0.92 | 3.91 | 6 | 0.40 | 0.43 | −0.21 | 1.16 | 26 | 0.61 | 0.73 | −0.72 | 2.36 |
| swallow | 1 | 0.18 | 0.15 | 0.55 | 4.64 | 2 | 0.05 | 0.09 | −1.45 | 1.11 | 0 | 0.00 | 0.00 | — | 2.19 |
| Average X | 1.73 | 0.34 | 0.37 | −0.34 | 3.73 | 2.18 | 0.10 | 0.12 | −0.84 | 0.61 | 7.91 | 0.51 | 0.60 | −0.67 | 3.61 |
| ade3 | 1 | 0.09 | 0.10 | −0.20 | 5.26 | 0 | 0.00 | 0.00 | — | 0.83 | 7 | 0.39 | 0.44 | −0.46 | 8.53 |
| Adh/Adhrel | 3 | 0.41 | 0.46 | −0.38 | 3.55 | 0 | 0.00 | 0.00 | — | 0.94 | 7 | 0.27 | 0.20 | 1.54 | 3.70 |
| amd | 4 | 0.61 | 0.61 | −0.02 | 2.30 | 1 | 0.02 | 0.05 | −1.14 | 0.30 | 3 | 0.12 | 0.23 | −1.63 | 3.12 |
| bcd | 10 | 0.95 | 0.00 | −1.29 | 4.92 | 3 | 0.07 | 0.00 | −1.61 | 0.27 | 2 | 1.28 | 1.00 | 0.85 | 1.49 |
| Bruce | 1 | 0.11 | 0.22 | −1.14 | 6.98 | 1 | 0.03 | 0.07 | −1.15 | 0.22 | 3 | 0.25 | 0.38 | −1.18 | 6.59 |
| Ddc | 2 | 0.32 | 0.31 | 0.15 | 6.01 | 4 | 0.21 | 0.19 | 0.34 | 0.29 | — | — | — | — | — |
| Eno | 5 | 0.40 | 0.62 | −1.29 | 3.27 | 1 | 0.02 | 0.04 | −1.12 | 0.01 | 0 | 0.00 | 0.00 | — | 1.46 |
| Gld | 6 | 0.75 | 0.60 | 0.90 | 4.16 | 1 | 0.02 | 0.03 | −1.16 | 0.01 | — | — | — | — | — |
| hyd | 0 | 0.00 | 0.00 | — | 2.50 | 2 | 0.05 | 0.10 | −1.43 | 0.60 | 3 | 0.23 | 0.44 | −1.60 | 2.69 |
| Lam | 4 | 0.42 | 0.39 | 0.22 | 3.03 | 2 | 0.05 | 0.06 | −0.27 | 0.64 | 0 | 0.00 | 0.00 | — | 0.00 |
| rosy | 29 | 1.72 | 1.69 | 0.09 | 6.03 | 13 | 0.24 | 0.25 | −0.16 | 0.52 | 2 | 1.12 | 1.07 | 0.15 | 3.86 |
| sry-alpha | 7 | 0.49 | 0.00 | −0.04749 | 3.62 | 5 | 0.35 | 0.00 | −0.78 | 1.48 | — | — | — | — | — |
| Uro | 3 | 0.58 | 0.51 | 0.47 | 6.96 | 0 | 0.00 | 0.00 | — | 0.31 | 1 | 0.30 | 0.59 | −1.14 | 1.96 |
| Average autosome | 5.77 | 0.53 | 0.42 | −0.45 | 4.51 | 2.54 | 0.08 | 0.06 | −0.85 | 0.49 | 2.80 | 0.40 | 0.44 | −0.43 | 3.34 |
| Average total | 3.59 | 0.45 | 0.49 | −0.51 | 4.32 | 1.81 | 0.07 | 0.08 | −0.59 | 0.65 | 5.09 | 0.34 | 0.40 | −0.55 | 3.40 |
Taj D, Tajima's D; JC, Jukes–Cantor.
DNA polymorphism and evolutionary analysis:
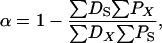
The estimated number of synonymous sites, nonsynonymous sites, average pairwise diversity (π), and average pairwise divergence (Dxy), as well as counts of the number of polymorphic (P) and divergent (D) sites were performed with Perl scripts written by D. Bachtrog and P. Andolfatto. Multiply hit sites were included in the analysis but insertion–deletion polymorphisms and polymorphic sites overlapping alignment gaps were excluded. We estimate the proportion of divergence driven by positive selection as
 |
where
 |
Di and Pi are the number of divergent and polymorphic variants at locus i, respectively, n is the number of loci, and X and S subscripts denote the putatively selected and neutral (i.e., synonymous) classes of mutations, respectively (see also Rand and Kann 1996; Fay et al. 2002; Smith and Eyre-Walker 2002; Andolfatto 2005). Confidence limits were estimated using a nonparametric bootstrap procedure (Andolfatto 2005). For consistency, we estimated α for nonsynonymous sites the same way and for comparison, we also applied the approach of Bierne and Eyre-Walker (2004) where possible. Estimates and confidence limits based on this procedure were not notably different from estimates based on pooling sites across loci (results not shown).
Linkage disequilibrium:
To characterize levels of linkage disequilibrium, we estimate the parameter ρ = 4Ner, where Ne is the effective population size and r is the recombination rate per generation, by an approximate Bayesian method (Haddrill et al. 2005b; K. Thornton, unpublished data). Posterior distributions of ρ and θ were jointly estimated on the basis of summary statistics of the data (sample size, alignment length, number of segregating sites, number of haplotypes, and the minimum number of recombination events in the sample) and rejection sampling. We estimated ρ and θ on the basis of all sites or silent sites only and, for autosomes, neo-X and X-linked loci independently. Only loci that had a minimum of six segregating sites (S) were included in the analysis, because estimates of ρ using a similar procedure were shown to be highly biased when S is small (Andolfatto and Wall 2003). Thus, a total of 7 X-linked loci (6 loci from XL and 1 locus from XR), 10 autosomal loci (6 loci from chromosome 4 and 4 loci from chromosome 2), and 17 neo-X loci were included in this analysis. The LD analysis was also performed including only loci that had ≥10 polymorphic sites, which gave very similar results (results not shown). Estimates of ρ may also be biased if there is a skew in the allele frequency spectrum of mutations (Andolfatto and Wall 2003). Since all chromosomes show a similar skew in the allele frequency spectrum (see below), this potential bias would be similar for each chromosome. Each estimate of ρ and θ is based on 1000 draws from the posterior distribution.
Statistical tests of neutrality:
Following Haddrill et al. (2005b), we used several multilocus statistical tests to detect nonequilibrium demography and/or selection in our data set. We use the Hudson–Kreitman–Aguadé (HKA) test to quantify heterogeneity in levels of polymorphism relative to divergence among loci (Hudson et al. 1987). We also use the means and variances of two measures of the distribution of polymorphism frequencies [Tajima's D (Tajima 1989a) and Fay and Wu's H (Fay and Wu 2000)]. The ancestral state of polymorphisms was inferred using a single D. pseudoobscura sequence and standard parsimony criteria. We performed these tests using all sites, only “silent” sites (noncoding plus synonymous), and only synonymous sites. Given the evidence for purifying selection acting on nonsynonymous and noncoding polymorphisms (see results), we report results based on synonymous sites only.
All tests were carried out using the neutral coalescent simulation program ms of Hudson (2002) and various auxiliary programs written in C and Perl by P. Andolfatto. In our simulations, we account for sample size, alignment length, and θ for each locus. The parameter θ is estimated from the observed data using the HKA framework on the basis of the number of segregating sites and divergence to a single D. pseudoobscura sequence (Hudson et al. 1987). We incorporate recombination into our simulations by using a point estimate based on the mode of the posterior distribution of ρ/θ estimated for each chromosome. P-values for test statistics are based on 10,000 simulated replicates.
Fit to demographic and hitchhiking models:
We assessed the fit of the neo-X data to two simple demographic models (population growth and a bottleneck) and a recurrent selective sweep model. Population growth and bottlenecks were modeled with the program ms (see http://home.uchicago.edu/∼rhudson1/source/mksamples.html for a guide to implementing such models) and the specific parameters used are listed in the table legends. Under the growth model, N/No = ert, where N is the current population size, No is the ancestral population size, r is the growth rate, and t is the time at which growth began. Population bottlenecks (BN) were modeled as an ancestral population, No, that crashes to size Nb at time t for d generations and recovers to size No. Recurrent hitchhiking (RHH) was modeled using code from Przeworski (2002) and was used for all statistics except the HKA χ2. To investigate the HKA χ2-statistic under the RHH model, we implemented an approximation based on the BN model using the program ms. Here we modeled selective sweeps as locus-specific bottlenecks where the time to the last bottleneck at each locus (t) was chosen from a uniform distribution with mean λ and the severity of the bottleneck (Nb/No) at each locus was chosen from an exponential with mean s. The only statistics used from these simulations were the number of segregating sites (S) and average pairwise divergence (Dxy). We confirmed that the distribution of S for these simulations did not differ from that produced under the RHH model of Przeworski (2002) for a given diversity reduction (results not shown). In each case, simulation parameters were scaled to mimic the observed data (i.e., levels of variability, π, and average pairwise divergence, Dxy) as closely as possible.
RESULTS AND DISCUSSION
Levels of variability in D. miranda:
DNA polymorphism data for a total of 62 loci from autosomes, the neo-X, and the X chromosome were obtained (appendix b), comprising 78 kb sequenced in 12 lines of D. miranda. Average synonymous site diversity πsyn is 0.41% per site for X- and neo-X-linked loci and 0.53% per site for autosomal loci, consistent with the neutral expectation that the X chromosome has three-quarters the variability of autosomes. Thus, there is no evidence of strong sexual selection in D. miranda, which would inflate the X/autosome polymorphism ratio (Charlesworth 2001). Levels of diversity on the X and neo-X are almost sixfold lower than average synonymous site diversity on the X chromosome of D. melanogaster (πsyn = 2.7%, Andolfatto 2005). This difference in synonymous site variability could indicate a lower effective population size of D. miranda relative to D. melanogaster. There is extensive heterogeneity in levels of synonymous site polymorphism and divergence levels among loci (appendix b). In addition, most loci show a marked skew at synonymous polymorphism frequencies toward rare alleles (as measured by Tajima's D-statistic, appendix b). These features of the data are discussed in the context of possible demographic and selection models below.
Positive and negative selection at coding and noncoding DNA:
Overall, synonymous sites evolve faster between D. miranda and D. pseudoobscura than nonsynonymous sites and intergenic regions (Table 1); average divergence at fourfold degenerate synonymous sites Ks is 3.6%, significantly higher than divergence at nonsynonymous (Ka = 0.65%) and intergenic (KIG = 2.6%) sites of the genome (P < 0.05, Wilcoxon's two-sample test). Pooling loci on the X and the neo-X, we infer levels of constraint to be ∼30% for intergenic DNA (Table 1). Note that, due to the relatively rough functional annotation of the D. pseudoobscura genome, we do not distinguish between untranslated-transcribed regions (UTRs) and truly intergenic regions. Results from D. melanogaster suggest that constraint is stronger in UTRs than in intergenic regions (Andolfatto 2005). Since most of our “intergenic” regions are relatively close to coding exons, and the average length of the region we surveyed was ∼400 bp, they may be composed of a substantial fraction of UTRs.
TABLE 1.
Patterns of polymorphism in D. miranda and divergence to D. pseudoobscura
| n | No. of sites | Div | Poly | π (%) | KJC (%) | D | H | |
|---|---|---|---|---|---|---|---|---|
| Neo-X loci (N = 36) | ||||||||
| Synonymous sites | 12.0 | 7,428.0 | 308 | 114 | 0.45 | 3.76 | −0.68 | −0.20 |
| Replacement sites | 12.0 | 23,517.0 | 175 | 48 | 0.06 | 0.73 | −0.34 | 0.29 |
| Intron DNA | 12.0 | 3,887 | 127 | 48 | 0.38 | 4.02 | −0.46 | 0.12 |
| Intergenic DNA | 12.0 | 9,878 | 236 | 107 | 0.18 | 2.59 | −0.86 | 0.07 |
| X-linked loci (N = 13) | ||||||||
| Synonymous sites | 12.0 | 1,903.8 | 68 | 19 | 0.34 | 3.08 | −0.34 | 0.31 |
| Replacement sites | 12.0 | 5,941.2 | 39 | 24 | 0.10 | 0.61 | −0.84 | 0.53 |
| Intron DNA | 12.0 | 2,321 | 80 | 45 | 0.53 | 4.01 | −0.45 | 0.27 |
| Intergenic DNA | 12.0 | 2,021 | 38 | 42 | 0.45 | 2.52 | −1.10 | −1.12 |
| Autosomal loci (N = 13) | ||||||||
| Synonymous sites | 11.8 | 3,426.9 | 131 | 70 | 0.53 | 3.65 | −0.21 | −0.17 |
| Replacement sites | 11.8 | 10,832.1 | 43 | 33 | 0.08 | 0.49 | −0.86 | 0.19 |
| Intron DNA | 11.8 | 2,130 | 88 | 22 | 0.37 | 3.27 | −0.77 | −0.10 |
| Intergenic DNA | 12.0 | 848 | 30 | 6 | 0.36 | 3.98 | 2.06 | −0.06 |
| All loci (N = 62) | ||||||||
| Synonymous sites | 12.0 | 12,758.7 | 507 | 203 | 0.45 | 3.60 | −0.51 | −0.11 |
| Replacement sites | 12.0 | 40,290.3 | 257 | 105 | 0.07 | 0.65 | −0.59 | 0.31 |
| Intron DNA | 12.0 | 8,338 | 295 | 115 | 0.41 | 3.85 | −0.54 | 0.09 |
| Intergenic DNA | 12.0 | 12,747 | 304 | 155 | 0.22 | 2.64 | −0.72 | −0.18 |
N, the number of loci surveyed; n, the average number of alleles sequenced per locus; Div and Poly, the number of divergent and polymorphic sites, respectively; π, the average pairwise divergence between alleles; KJC, the average pairwise divergence to D. pseudoobscura using a Jukes–Cantor correction for multiple hits (KJC for synonymous sites is based on fourfold degenerate sites only); D, the mean Tajima's (1989a) D; H, the average Fay and Wu's (2000) H across loci.
In contrast, average divergence observed at introns is similar to that at synonymous sites (Table 1). Note, however, that most of the introns analyzed here are very short (median intron length is 64 bp), and only 13 of the 85 introns investigated are >100 bp. In D. melanogaster, short introns evolve at rates that are similar to those of synonymous sites, which suggests that they experience little or no selective constraint (Halligan et al. 2004; Haddrill et al. 2005a; Halligan and Keightley 2006). However, longer introns in D. melanogaster evolve significantly slower than synonymous sites, suggesting that they are subject to stronger selective constraint (Haddrill et al. 2005a; Halligan and Keightley 2006). To investigate the relationship between intron length and nucleotide divergence, we compiled data from 106 neo-X-linked genes in D. miranda (Bachtrog 2003b, 2005; Bachtrog and Charlesworth 2002; our unpublished data) and compared them to their D. pseudoobscura homolog. This data set contains 165 introns, 21 of which are >100 bp. Figure 1 shows the relationship between nucleotide divergence and intron length. As observed in D. melanogaster (Haddrill et al. 2005a; Halligan and Keightley 2006), synonymous sites evolve at a rate similar to that for short introns (<100 bp). However, long introns (>100 bp) evolve significantly slower than both synonymous sites and short introns (see Figure 1). The 5′- and 3′-flanking regions of genes show similar levels of divergence as long introns, suggesting similar levels of constraint (Figure 1). However, since D. miranda and D. pseudoobscura likely differ by sixfold in population size (Yi et al. 2003), much of the constraint observed may be specific to the D. pseudoobscura lineage. We can rule out this explanation as the sole cause for the divergence pattern because polymorphism at flanking regions in D. miranda is also significantly reduced compared to that at synonymous sites (Wilcoxon's two-sample test, P < 0.01).
Figure 1.—

Mean divergences for synonymous sites, small and large introns, and flanking regions between D. miranda and D. pseudoobscura for 106 neo-X-linked genes. Error bars indicate two standard errors. Synonymous site divergence is significantly greater than large (Wilcoxon's two-sample test, P < 0.0001) but not small intron divergences (Wilcoxon's two-sample test, P = 0.31). Large introns evolve significantly slower than short introns (Wilcoxon's two-sample test, P = 0.0038).
Reduced polymorphism and divergence at long introns and intergenic regions relative to synonymous sites could simply reflect differences in mutation rate. One way to distinguish mutation rate differences from selective constraint is to consider the polymorphic site frequency spectrum (SFS) of noncoding DNA relative to synonymous sites (following Andolfatto 2005). Negative selection on sites is expected to result in a skew toward rare polymorphisms relative to neutral sites. In the D. miranda polymorphism data, we detect significantly more low-frequency (f =  ) than intermediate- and high-frequency (
 ) variants at intergenic DNA compared to synonymous sites (P < 0.01, Fisher's exact test, see Figure 2). The effect of selection on synonymous sites on the SFS has been documented in D. simulans and D. pseudoobscura (Akashi and Schaeffer 1997). However, the SFS in D. miranda (and D. melanogaster—see Andolfatto 2005) suggests stronger selection acting on noncoding DNA sites than on synonymous sites. Consistent with divergence patterns (above), no significant difference is detected at the SFS (P = 0.09, Fisher's exact test, see Figure 2) or at levels of polymorphism (Wilcoxon's two-sample test, P > 0.1) between synonymous sites and the mainly short introns studied here. However, since most intronic DNA resides in long (and thus constrained) introns in the Drosophila genome, this result is consistent with current selection acting on a substantial fraction of noncoding DNA in D. miranda.
Figure 2.—

Frequency distribution of different types of polymorphisms. Low refers to a sample frequency f of  , intermediate refers to a sample frequency of
  –
– , and high refers to a sample frequency of
  .
.
Overall, these results corroborate a recent study in D. melanogaster that found that noncoding DNA evolves significantly slower and harbors less polymorphism than nonsynonymous sites and that polymorphic variants at these sites segregate at lower frequencies than synonymous polymorphisms (Andolfatto 2005). Thus, noncoding DNA in Drosophila, including intergenic regions and most intronic DNA, is evolving under stronger functional constraint than synonymous sites. Curiously, the skew in the frequency distribution toward rare variants is not as pronounced for nonsynonymous polymorphisms in D. miranda, particularly on the neo-X chromosome, despite the stronger signature of selective constraint at these sites in levels of polymorphism and divergence (see Table 1).
Interestingly, the D. melanogaster study also suggested that noncoding DNA is undergoing frequent adaptive evolution (Andolfatto 2005). A test to distinguish neutrality from negative and positive selection in the genome is to compare levels of polymorphism within and divergence between species for a putatively selected class of sites to a neutral standard (McDonald and Kreitman 1991). This test was originally designed to detect selection in protein-coding regions, but can be modified to detect selection in noncoding regions as well (Ludwig and Kreitman 1995; Kohn et al. 2004; Andolfatto 2005). If reduced levels of polymorphism and divergence in noncoding and nonsynonymous sites can be explained by a lower mutation rate, the ratio of polymorphism to divergence should be similar to that for synonymous sites. Positive selection will increase divergence relative to polymorphism at selected sites, whereas negative selection may produce the opposite pattern. We note that nonequilibrium mutation models might also result in heterogeneity between polymorphic and diverged mutations (Eyre-Walker 1997; Kern and Begun 2005; Akashi et al. 2006). Future work will be needed to theoretically quantify the magnitude of such effects and to establish patterns of mutational bias in the pseudoobscura group.
The application of the McDonald–Kreitman approach to polymorphism data from D. melanogaster has suggested that a substantial fraction of noncoding and nonsynonymous divergence was driven to fixation by positive selection (i.e., 20–60%; Fay et al. 2002; Smith and Eyre-Walker 2002; Kohn et al. 2004; Andolfatto 2005), if compared to synonymous sites as a neutral standard. Applying this same framework to our polymorphism data from D. miranda, we find no evidence for an excess of divergence for noncoding or nonsynonymous sites (Figure 3). Instead, nonsynonymous and noncoding sites show a slight excess of polymorphism over divergence, which is consistent with purifying selection operating on segregating variation at these sites.
Figure 3.—

Estimates of the fraction of mutations driven to fixation by positive selection. Error bars indicate 90% confidence limits determined by a standard nonparametric bootstrapping procedure.
However, the joint effects of positive and negative selection can mask the signature of adaptive evolution in the genome (Charlesworth 1996; Templeton 1996; Fay et al. 2001; Andolfatto 2005). The decrease in statistical power due to negatively selected polymorphisms (that will not contribute to divergence) can be partly overcome by considering only those mutations that are not rare in a sample (so long as the neutral and putatively selected classes are treated equally). In particular, since noncoding DNA shows an excess of rare-frequency variants relative to synonymous DNA, it is likely that some fraction of polymorphism at noncoding DNA is under negative selection. When we apply this approach to our data, there is a slight excess of divergence at nonsynonymous and noncoding DNA relative to synonymous sites (Table 1). The fraction of amino acid mutations driven to fixation by positive selection (α) is estimated to be ∼8%, and 10% for noncoding DNA, although neither estimate is significantly different from zero. Most of the signature of adaptive evolution we detect at nonsynonymous sites is attributable to two loci that show a significant McDonald–Kreitman test individually (CycB and exu1; see Bachtrog and Charlesworth 2002; Bachtrog 2003a); if we exclude these two loci, the remaining genes show no evidence for adaptive protein evolution (α ∼ 0).
While these trends are in the same direction as those found in the D. melanogaster species group (Sawyer et al. 2003; Bierne and Eyre-Walker 2004; Andolfatto 2005), estimates of α are substantially smaller in D. miranda and are not significantly different from zero. Thus, while both noncoding and nonsynonymous DNA show evidence of functional constraint in D. miranda (as in D. melanogaster), neither class shows significant evidence for positive selection.
There are several possible explanations for the differences between D. miranda and D. melanogaster in inferred levels of adaptive divergence. First, the difference between species could be due to differences in the types of genes studied in D. melanogaster and D. miranda. This seems unlikely for several reasons. First, the studies of Bierne and Eyre-Walker (2004) and Andolfatto (2005) yielded similar estimates of adaptive divergence in D. melanogaster despite using a nonoverlapping sample of genes. Like the Andolfatto (2005) study, most of the genes studied here were chosen randomly with regard to protein function. In addition, Bierne and Eyre-Walker (2004) found no evidence for significant heterogeneity in estimates of α among loci, suggesting that the fraction of adaptive divergence is not rampantly different among genes. Given these factors, it seems unlikely that the difference in α is due to gene-specific effects.
A second explanation is based on possible differences in the effective population sizes of the two species. Levels of synonymous site diversity are sixfold lower in D. miranda than in D. melanogaster. Thus the lower fraction of adaptive divergence at both nonsynonymous and noncoding sites in D. miranda could be the result of a smaller effective population size compared to D. melanogaster. If most beneficial mutations fixed in the D. melanogaster species group are of small effect (i.e., Nes ∼ ≤5), these same mutations might actually be effectively neutral in D. miranda. Average Ka/Ks (D. miranda–D. pseudoobscura) among loci is almost identical for the 57 protein-coding genes investigated here in D. miranda and the 35 protein-coding regions analyzed by Andolfatto (2005) in D. melanogaster–D. simulans (Ka/Ks = 0.16 in both species comparisons). Thus, D. miranda does not have a lower rate of amino acid evolution, as might be expected if there is less protein adaptation. However, a smaller Ne in D. miranda would also result in an increase in the rate of fixations of slightly deleterious amino acid mutations (Ohta 1998). Relaxed selection on amino acid variants in D. miranda relative to D. melanogaster is consistent with the lack of a negative skew in the SFS of the former. We cannot, therefore, rule out that these two opposing forces of protein evolution cancel each other out to some extent, causing a similar net rate of protein evolution in D. miranda and D. melanogaster.
One difficulty with a population size argument is that the inferred current Ne of D. miranda may not reflect its historical Ne. Levels of silent-site diversity in D. pseudoobscura suggest it has an even larger effective population size than D. melanogaster (Yi et al. 2003). Thus, the Ne of D. miranda might have been larger than its current size for some time after speciation. Even if it was not, and little adaptive divergence occurred in D. miranda, we expect that substantial adaptive divergence along the D. pseudoobscura lineage should partly mitigate the effects of reduced Ne in D. miranda. Also, the estimate of α for adaptive protein evolution is similar for D. melanogaster and D. simulans (Bierne and Eyre-Walker 2004), despite these two species having putatively different Ne (Akashi 1996; Andolfatto 2001). This suggests that rates of adaptive evolution might not be particularly sensitive to small fluctuations in the effective population size.
Population size arguments typically rely on the assumption that levels of silent-site (i.e., almost neutral) diversity accurately reflect differences in Ne. However, as Gillespie (1997, 1999, 2001) pointed out, if positive selection is frequent, there is little expected correspondence between the effective population size of a species and levels of neutral diversity. Thus, it is possible that the population size difference between D. miranda and D. melanogaster is dramatically underestimated when based on relative levels of synonymous diversity, if genetic hitchhiking is virtually absent in the former and common in the latter. Given uncertainties in relative population sizes and the distribution of selection coefficients, we cannot exclude a lower population size in D. miranda as the primary cause of the lower fraction of adaptive divergence inferred in this species.
A third explanation for the difference between estimates of α in the two species is that nonequilibrium demography in D. melanogaster (Haddrill et al. 2005b) and/or D. miranda (discussed below) may explain the different estimates of α in the two species groups if this demography is producing spurious signatures of adaptation in the former or is masking the signature of adaptation in the latter (Fay and Wu 2001; Eyre-Walker 2002). While segregating deleterious mutations lead to an underestimate of α in a population of stable size (Charlesworth 1996; Templeton 1996; Fay et al. 2002; Andolfatto 2005), they can lead to an overestimate of α if population sizes have expanded, since slightly deleterious mutations that fixed in the past when the population was smaller no longer segregate as polymorphisms (Fay and Wu 2001; Eyre-Walker 2002). On the other hand, a population size contraction would lead to the opposite pattern and thus obscure evidence for adaptive evolution.
Both D. melanogaster (Haddrill et al. 2005b) and D. miranda (discussed below) show evidence for nonequilibrium demography. Rather than expanding, several lines of evidence suggest that D. melanogaster has undergone a recent reduction in its effective size since it last shared a common ancestor with D. simulans (Akashi 1995, 1996). Thus, it may be hard to find a demographic model that could account for the observed positive value of α, especially since estimates of α are similar in D. simulans and D. melanogaster, despite these two species having different demographic histories. A population size reduction in D. miranda that obscures the signature of adaptive evolution may therefore be more likely since it has highly reduced silent-site diversity relative to its sibling species D. pseudoobscura, suggesting a much smaller Ne (Yi et al. 2003). As shown below, many aspects of patterns of polymorphisms in D. miranda are consistent with a severe population size reduction in its recent history.
Clearly, it is puzzling that two different species groups of Drosophila give such different estimates on the importance of adaptive evolution to coding and noncoding DNA divergence. Emerging evidence for complicated demographies in many Drosophila species (Machado et al. 2002; Wall et al. 2002; Haddrill et al. 2005b; Kopp and Barmina 2005; Bachtrog et al. 2006; Baudry et al. 2006) suggests that using comparative approaches to address the question of how common adaptive evolution is may need to involve comparisons of many species. In addition to nonequilibrium demography, nonequilibrium mutation models might also result in discrepancies in estimates of α among species (Eyre-Walker 1997; Kern and Begun 2005; Akashi et al. 2006), although their quantitative effects on estimates of adaptive evolution have yet been little investigated.
Patterns of linkage disequilibrium in D. miranda:
Levels of LD are inversely related to estimates of ρ (the population recombination rate) and it is useful to scale ρ by θ (the population mutation rate) when comparing species, populations, or chromosomes with different effective population sizes (Hudson 1987; Andolfatto and Przeworski 2000; Haddrill et al. 2005b). We thus quantified levels of LD on autosomes, the neo-X, and the X-chromosome as joint estimates of ρ/θ across loci for each of these chromosomes. Posterior distributions for ρ/θ by chromosome are shown in Figure 4, and modes and 95% confidence intervals are listed in Table 2. Estimates of ρ/θ range from ∼4 to 26 among chromosomes and are on the same order as estimates in D. melanogaster (Thornton and Andolfatto 2006).
Figure 4.—

Approximate Bayesian posterior distributions of ρ/θ, for autosomal and neo-X- and X-linked loci. The modes and 95% C.I.'s are listed in Table 2.
TABLE 2.
Mode and 95% confidence intervals for estimates of ρ /θ by chromosome
| θ (%)
|
ρ (%)
|
ρ/θ
|
||||
|---|---|---|---|---|---|---|
| Chromosome | Mode | 95% C.I. | Mode | 95% C.I. | Mode | 95% C.I. |
| Autosomes | 0.25 | 0.19–0.33 | 0.98 | 0.55–2.0 | 3.8 | 2.0–8.3 |
| Neo-X | 0.34 | 0.29–0.40 | 3.2 | 2.1–5.2 | 9.1 | 6.0–16 |
| X | 0.51 | 0.41–0.63 | 13 | 8.0–40 | 26 | 16–77 |
ρ and θ estimates are based on all coding and noncoding sites. Each estimate is based on 1000 draws of the posterior distributions of ρ, θ, and ρ/θ.
Interestingly, we find significant heterogeneity in patterns of linkage disequilibrium among chromosomes. In particular, autosomal loci have significantly more LD (i.e., smaller estimates of ρ/θ) than X-linked or neo-X-linked loci (see Figure 4), suggesting that autosomes have less effective recombination than do X- or neo-X-linked loci. Possible explanations for this difference include population history (Wall et al. 2002), the presence of common polymorphic autosomal inversions (Andolfatto and Wall 2003), or differences in recombination rates. Population history is an unlikely explanation since we expect that the X chromosome and the neo-X would be affected similarly. In fact, the confidence intervals on estimates of ρ/θ barely overlap for these chromosomes despite having similar levels of diversity (Table 2).
Inversion polymorphisms may explain some of the differences observed among chromosomes. Inversion heterozygosity suppresses meiotic recombination between standard and inverted chromosomes, but can enhance recombination levels in other chromosomal regions (Andolfatto et al. 2001). A recent study in D. miranda detected no chromosomal inversions on the left arm of the X chromosome (XL, on which six of the seven X-linked loci used for inferring LD are located), but did detect two polymorphic inversions on chromosome 2 (an autosome); the neo-X chromosome was found to contain one polymorphic inversion (Yi et al. 2003). A similar excess of levels of LD at autosomal relative to X-linked loci was also detected in a Zimbabwe population of D. melanogaster (Andolfatto and Wall 2003). Inversions are both much more common and at higher frequencies on the autosomes than on the X chromosome of D. melanogaster and might thus increase levels of LD at autosomal loci.
Another possible contributing factor may be the effect of chromosome size on recombination rates. In particular, chromosomal arm XL in D. miranda appears to be only about half as long as the other four large chromosomal arms in polytene chromosome preparations (Das et al. 1982). If there is a reasonably good correspondence between size of the polytene chromosomes and sequence physical map, chromosome XL may contain only about half as much DNA as do the other chromosomal arms. In fact, some genes that are located on Muller's element A in D. melanogaster (which corresponds to XL in the pseudoobscura group) map to element D (chromosome XR) in D. pseudoobscura (Segarra et al. 1995). Segarra et al. (1995) concluded that this is probably the result of a pericentric inversion. If this inversion was asymmetric, it could have caused more DNA to be translocated to XR from XL than from XR to XL. This is consistent with the in situ hybridization results of Segarra et al. (1995), who found that genes move only from element A to D, but not the reverse, and could explain the smaller size of chromosomal arm XL in D. miranda. If each chromosomal arm has on average one crossing over event per meiosis, as suggested on the basis of cytological data in Drosophila (Ashburner 1989), this would imply that genes on chromosome XL undergo twice as much recombination per unit length than genes on other chromosomal arms. In fact, the genetic map length is very similar for the two arms of the X chromosome in D. pseudoobscura (Kovacevic and Schaeffer 2000), supporting the hypothesis of more recombination per physical length on the shorter chromosomal arm XL. Thus, both polymorphic inversions and chromosome size might contribute to this observed difference in levels of linkage disequilibrium among chromosomes.
Nonneutral and/or nonequilibrium dynamics in D. miranda:
To test for nonequilibrium demography and/or selection in D. miranda, we applied three multilocus tests of the SNM to all loci for each chromosome. We restricted this analysis to synonymous sites only, since nonsynonymous and noncoding polymorphisms are under negative selection in D. miranda (see above). This analysis reveals several interesting findings (Table 3). First, there is significant heterogeneity in levels of polymorphisms and divergence at each chromosome, as indicated by the large observed HKA χ2 across loci. This pattern is seen on all chromosomes even when restricting the data to synonymous sites only and when excluding three loci on the neo-X chromosome that were previously identified as likely targets of recent selective sweeps (Bachtrog and Charlesworth 2002; Bachtrog 2003a). This finding contrasts with previous studies (based on fewer loci) that have suggested (excluding one to two outliers) no significant HKA χ2 across loci in D. miranda (Bachtrog and Charlesworth 2002; Bachtrog 2003a; Yi et al. 2003; Bartolomé et al. 2005). Second, the mean Tajima's D at synonymous sites among loci on the autosomes and the neo-X chromosome is too negative to be compatible with the SNM (Table 3). Again, this is in contrast to previous studies that found no significant evidence of an overall departure of silent variants from neutral expectations of the frequency spectrum (Bachtrog and Charlesworth 2002; Bachtrog 2003a; Yi et al. 2003; Bartolomé et al. 2005). Finally, neo-X-linked genes have too little variance in Tajima's D across loci compared to the SNM (Table 3). These departures from expectations of the SNM in D. miranda suggest the influence of nonequilibrium demography and/or selection.
TABLE 3.
Tests of the standard neutral model by chromosome for synonymous sites only
| Chromosomal location | π | HKA χ2 | D | Var(D) | H | Var(H) |
|---|---|---|---|---|---|---|
| Neo-X (N = 33) | ||||||
| Observed | 0.98 | 58.5 | −0.68 | 0.37 | −0.20 | 0.90 |
| SNM | 1.14 | 20.9 | −0.01 | 0.74 | −0.03 | 0.87 |
| (<10−4) | (<10−4) | (0.998) | (0.15) | (0.40) | ||
| X (N = 11) | ||||||
| Observed | 0.53 | 20.0 | −0.34 | 0.58 | 0.31 | 0.04 |
| SNM | 0.58 | 7.1 | 0.00 | 0.83 | −0.02 | 0.48 |
| (0.001) | (0.15) | (0.78) | (0.93) | (0.96) | ||
| Autosomes (N = 13) | ||||||
| Observed | 1.71 | 13.4 | −0.45 | 0.75 | −0.17 | 1.09 |
| SNM | 1.79 | 7.6 | 0.00 | 0.72 | −0.03 | 1.41 |
| (0.04) | (0.03) | (0.44) | (0.33) | (0.53) |
N, the number of loci surveyed; π, the average pairwise diversity per locus. Multilocus means and variances are given for Tajima's (1989a) D and Fay and Wu's (2000) H for the observed data. Means of these over 10,000 replicates under the standard neutral model (SNM) are given for simulated data. Recombination rates in simulations are based on the mode of the posterior distribution of ρ/θ for each chromosome (see Figure 4). Probabilities of Xsimulated ≤ Xobserved, where X is a given statistic, are given in parentheses.
To investigate the power of nonequilibrium demography and/or selection models to explain various aspects of our data, we performed exploratory simulations. Simple demographic models, including population expansion, population bottlenecks, and a recurrent hitchhiking model were fit to synonymous polymorphism data from the neo-X chromosome (Table 4). Simulation parameters were chosen to closely match the observed diversity on the neo-X chromosome (see materials and methods for details). Our simulations assume that synonymous sites are neutral (which is probably a reasonable assumption given patterns of codon usage in D. miranda; Bachtrog 2003b; Bartolomé et al. 2005), and we explore only a limited number of possible demographic and selection models. Thus, keeping their limitations and assumptions in mind, these exploratory simulations are intended as illustrations of what type of population genetics models could in principle account for the observed data.
TABLE 4.
An evaluation of alternative models fit to synonymous polymorphisms of the neo-X of D. miranda
| Model | π | HKA χ2 | D | Var(D) | H | Var(H) |
|---|---|---|---|---|---|---|
| Observed | 0.98 | 58.5 | −0.68 | 0.37 | −0.20 | 0.90 |
| SNM | 1.14 | 20.9 | −0.01 | 0.74 | −0.03 | 0.87 |
| (<10−4)a | (<10−4)a | (0.998)a | (0.15) | (0.40) | ||
| Growth | 0.97 | 21.0 | −0.45 | 0.67 | 0.18 | 0.60 |
| (<10−4)a | (0.06) | (0.98)a | (0.01)a | (0.12) | ||
| RHH1 (θo = 2.3) | 0.99 | 27.4 | −0.44 | 0.68 | 0.09 | 0.99 |
| (<10−3)a | (0.05) | (0.97)a | (0.08) | (0.47) | ||
| RHH2 (θo = 5.75) | 1.08 | 32.8 | −0.76 | 0.56 | 0.14 | 1.31 |
| (<10−3)a | (0.70) | (0.87) | (0.08) | (0.71) | ||
| BN1 (θo = 2.3) | 0.96 | 26.8 | −0.44 | 0.81 | −0.09 | 1.13 |
| (<10−4)a | (0.07) | (0.994)a | (0.28) | (0.57) | ||
| BN2 (θo = 5.75) | 0.98 | 48.0 | −0.61 | 1.20 | −0.50 | 3.00 |
| (0.12) | (0.38) | (0.994)a | (0.80) | (0.88) |
See Table 3 legend for definitions. A multiple-hits correction was implemented for Fay and Wu's H-test (see Haddrill et al. 2005b). Growth model: Fivefold growth with growth rate = 10 starting 0.161Ne generations ago. Recurrent hitchhiking model (RHH): The model implemented is that of Przeworski (2002). The strength of selection, s, was set to 1% for both models and the rate of sweeps per site per 4Ne generations (λ) was adjusted such that neutral variability was reduced approximately twofold (RHH1, λ = 0.00002) and approximately fivefold (RHH2, λ = 0.0000475). The behavior of the HKA χ2-statistic under the recurrent hitchhiking model was investigated using a locus-specific bottleneck approximation (see materials and methods). Sweep times were drawn from a uniform distribution with means of 2Ne generations ago (RHH1) and 0.8Ne generations ago (RHH2). The severities of selective sweeps were drawn from an exponential with means of 0.08 (RHH1) and 0.0025 (RHH2). Bottleneck model (BN): A population of size No instantaneously crashes to size Nb = fNo at time T for d generations. Two bottlenecks were modeled that reduce neutral variability by approximately twofold (BN1) and approximately fivefold (BN2), respectively. For BN1, parameters were θ = 2.3, f = 0.008, T = 0.4Ne generations ago, and d = 0.02Ne generations. For BN2, parameters were θ = 5.75, f = 0.001, T = 0.08Ne generations ago, and d = 0.004Ne generations. For all models ρ/θ was set to 18, the maximum a posteriori estimate for the neo-X. In each case, an outgroup sequence was simulated to match the observed divergence to D. pseudoobscura. All programs and command lines used are available on request to P. Andolfatto.
Rejection of the model being simulated at the 5% level.
As indicated by a negative mean Tajima's D, all chromosomes show a marked excess of low-frequency variants across loci (see Table 3). This signature is often interpreted as evidence for population expansion (e.g., Machado et al. 2002; Glinka et al. 2003; Das et al. 2004; Llopart et al. 2005). However, a negative mean Tajima's D is expected under a variety of population genetic models (see Tajima 1989b; Braverman et al. 1995; Charlesworth et al. 1995; Gillespie 1997; Tachida 2000; Haddrill et al. 2005b). Our simulations show that while a population expansion could account for the negative mean Tajima's D observed on the neo-X chromosome (and perhaps the reduced variance of Tajima's D among loci), several other features of the data are clearly incompatible with a simple growth model (Table 4). In particular, growth models are unable to produce the observed heterogeneity in levels of polymorphism and divergence among loci (Pluzhnikov et al. 2002; Haddrill et al. 2005b). In addition, the mean Fay and Wu's H-statistic in a growing population is generally expected to be positive, instead of the negative value observed (Table 4). These results suggest that a simple population expansion model is unlikely to account for the patterns of polymorphism observed on the neo-X chromosome.
Little is known a priori about the demographic history of D. miranda; however, reduced variation and a reduction in the efficacy of selection for codon usage in this species relative to its closest relative (Bachtrog 2003b), D. pseudoobscura, raise the possibility that this species has suffered a drastic reduction in population size relative to its ancestral population (see Bachtrog 2003b; Yi et al. 2003). As an illustration, we show simulation results for two bottleneck models that decrease variation by about twofold and fivefold, respectively, relative to the ancestral population size. While the less severe bottleneck does a poor job of accounting for the observed data, the more severe population bottleneck can account for most aspects of the neo-X data, including the heterogeneity in levels of polymorphisms and divergence among loci and the negative mean Tajima's D and mean Fay and Wu's H (Table 4). However, recent population bottlenecks generally increase the variance of Tajima's D among loci (Table 4, and see Haddrill et al. 2005b), and we failed to find bottleneck parameters that could account for the decreased variance in D relative to the SNM, as observed in the data.
Given previous evidence for positive selection on the neo-X chromosome (Bachtrog and Charlesworth 2002; Bachtrog 2003a), we examined the fit of the data to a commonly used positive selection model (see materials and methods). We found that this model is compatible with several aspects of the data only if selective sweeps are very frequent (Table 4). However, we found it difficult to account for the observed heterogeneity in levels of polymorphism and divergence among loci (Table 4) with a recurrent hitchhiking model. Invoking even more hitchhiking might allow us to account for this aspect of the data; however, it would also result in an even more positive Fay and Wu's H, instead of the negative one observed (Table 4).
Our limited exploration of some selective and demographic models failed to identify a single model that can simultaneously account for all the aspects of the neo-X data. This may indicate that both demographic processes and selection simultaneously influence patterns of molecular evolution of the neo-X chromosome or that our models are misspecified in other ways (e.g., by ignoring purifying selection or population structure). Comparisons among chromosomes reveal that the neo-X chromosome has the most negative Tajima's D, and it is the only chromosome where the variance in Tajima's D is decreased across loci relative to the SNM (Table 3). This could indicate that while nonequilibrium demography is affecting the entire genome of D. miranda, the neo-X chromosome in particular is subject to more frequent adaptive evolution compared to the rest of the genome.
In fact, there are strong a priori reasons for believing that the neo-X chromosome may have been subject to more hitchhiking in the recent past than other chromosomes. The neo-sex chromosomes of D. miranda were an ordinary pair of autosomes until only ∼1 million years ago (Bachtrog and Charlesworth 2002), but are now actively evolving into morphologically and functionally diverged sex chromosomes (Bachtrog 2005). Genes on the neo-Y are male limited, whereas neo-X genes spend two-thirds of their time in females. This raises the possibility that genes undergo adaptive specialization for male and female functions on the neo-sex chromosomes (i.e., genes on the neo-X might become feminized; Rice 1984). In fact, genes showing female-biased expression are more abundant (and genes showing male-biased expression are relatively infrequent) on the X chromosome of D. melanogaster (Parisi et al. 2003). Two genes that are expressed in both testes and ovaries have undergone adaptive protein evolution on the neo-X of D. miranda (Bachtrog and Charlesworth 2002; Bachtrog 2003a), and many other genes might currently evolve sex-related functions on the neo-X. In addition, large parts of the neo-X chromosome of D. miranda are already partially dosage compensated (Bone and Kuroda 1996; Marin et al. 1996). This must have involved the adaptive fixation of some unknown number of de novo binding sites on the neo-X for the dosage compensation machinery (Bone and Kuroda 1996; Marin et al. 1996). If dosage compensation evolves on a small genomic scale, as suggested by recent experiments in D. melanogaster (Fagegaltier and Baker 2004), many such selective sweeps to acquire these binding sites might have happened in the recent evolutionary history of the neo-X chromosome of D. miranda.
It has been noted that X–autosome comparisons for inferring selection are complicated by uncertainties about the demographic history of a species (Charlesworth 2001; Wall et al. 2002). However, life-history differences between males and females, sexual selection, and changes in population size and structure should all influence the X and the neo-X chromosomes similarly. For this reason, it may be informative to parameterize a demographic model on the basis of a large number of X-linked loci for the purpose of identifying outliers, and thus candidates for recent selective sweeps, on the neo-X chromosome. This approach might be particularly amenable to the approaches proposed by Nielsen et al. (2005), which appear to be highly robust to complicated demography. Increasing the number of loci surveyed on the true X will be necessary for such an approach to be feasible.
Acknowledgments
We are grateful to Brian Charlesworth and David Begun for comments on the manuscript. D.B. was partly supported by a postdoctoral fellowship from the Austrian Academy of Sciences. P.A. was supported by an A. P. Sloan fellowship in molecular and computational biology. This work was funded by a National Institutes of Health grant (GM076007) to D.B.
References
- Adams, M. D., S. E. Celniker, R. A. Holt, C. A. Evans, J. D. Gocayne et al., 2000. The genome sequence of Drosophila melanogaster. Science 287: 2185–2195. [DOI] [PubMed] [Google Scholar]
- Akashi, H., 1995. Inferring weak selection from patterns of polymorphism and divergence at “silent” sites in Drosophila DNA. Genetics 139: 1067–1076. [DOI] [PMC free article] [PubMed] [Google Scholar]
- Akashi, H., 1996. Molecular evolution between Drosophila melanogaster and D. simulans: reduced codon bias, faster rates of amino acid substitution, and larger proteins in D. melanogaster. Genetics 144: 1297–1307. [DOI] [PMC free article] [PubMed] [Google Scholar]
- Akashi, H., and S. W. Schaeffer, 1997. Natural selection and the frequency distributions of “silent” DNA polymorphism in Drosophila. Genetics 146: 295–307. [DOI] [PMC free article] [PubMed] [Google Scholar]
- Akashi, H., W. Ko, S. Piao, A. John, P. Goel et al., 2006. Molecular evolution in the Drosophila melanogaster species subgroup: frequent parameter fluctuations on the timescale of molecular divergence. Genetics 172: 1711–1726. [DOI] [PMC free article] [PubMed] [Google Scholar]
- Andolfatto, P, 2001. Contrasting patterns of X-linked and autosomal nucleotide variation in Drosophila melanogaster and Drosophila simulans. Mol. Biol. Evol. 18: 279–290. [DOI] [PubMed] [Google Scholar]
- Andolfatto, P., 2005. Adaptive evolution of non-coding DNA in Drosophila. Nature 437: 1149–1152. [DOI] [PubMed] [Google Scholar]
- Andolfatto, P., and M. Przeworski, 2000. A genome-wide departure from the standard neutral model in natural populations of Drosophila. Genetics 156: 257–268. [DOI] [PMC free article] [PubMed] [Google Scholar]
- Andolfatto, P., and J. Wall, 2003. Linkage disequilibrium patterns across a recombination gradient in African Drosophila melanogaster. Genetics 165: 1289–1305. [DOI] [PMC free article] [PubMed] [Google Scholar]
- Andolfatto, P., F. Depaulis and A. Navarro, 2001. Inversion polymorphisms and nucleotide variability in Drosophila. Genet. Res. 77: 1–8. [DOI] [PubMed] [Google Scholar]
- Ashburner, M., 1989. Drosophila: A Laboratory Handbook. Cold Spring Harbor Laboratory Press, Cold Spring Harbor, NY.
- Bachtrog, D., 2003. a Adaptation shapes patterns of genome evolution in sexual and asexual genomes in Drosophila. Nat. Genet. 34: 215–219. [DOI] [PubMed] [Google Scholar]
- Bachtrog, D., 2003. b Protein evolution and codon usage bias on the neo-sex chromosomes of Drosophila miranda. Genetics 165: 1221–1232. [DOI] [PMC free article] [PubMed] [Google Scholar]
- Bachtrog, D., 2004. Evidence that positive selection drives Y-chromosome degeneration in Drosophila miranda. Nat. Genet. 36: 518–522. [DOI] [PubMed] [Google Scholar]
- Bachtrog, D., 2005. Sex chromosome evolution: molecular aspects of Y chromosome degeneration in Drosophila. Genome Res. 15: 1393–1401. [DOI] [PMC free article] [PubMed] [Google Scholar]
- Bachtrog, D., and B. Charlesworth, 2002. Reduced adaptation of a non-recombining neo-Y chromosome. Nature 416: 323–326. [DOI] [PubMed] [Google Scholar]
- Bachtrog, D., K. Thornton, A. Clark and P. Andolfatto, 2006. Extensive introgression of mitochondrial DNA relative to nuclear gene flow in the Drosophila yakuba species group. Evol. Int. J. Org. Evol. 60: 292–302. [PubMed] [Google Scholar]
- Bartolomé, C., X. Maside, S. Yi, A. Grant and B. Charlesworth, 2005. Patterns of selection on synonymous and nonsynonymous variants in Drosophila miranda. Genetics 169: 1495–1507. [DOI] [PMC free article] [PubMed] [Google Scholar]
- Baudry, E., N. Derome, M. Huet and M. Veuille, 2006. Contrasted polymorphism patterns in a large sample of populations from the evolutionary genetics model Drosophila simulans. Genetics 173: 759–767. [DOI] [PMC free article] [PubMed] [Google Scholar]
- Begun, D. J., and P. Whitley, 2000. Reduced X-linked nucleotide polymorphism in Drosophila simulans. Proc. Natl. Acad. Sci. USA 97: 5960–5965. [DOI] [PMC free article] [PubMed] [Google Scholar]
- Bergman, C. M., and M. Kreitman, 2001. Analysis of conserved noncoding DNA in Drosophila reveals similar constraints in intergenic and intronic sequences. Genome Res. 11: 1335–1345. [DOI] [PubMed] [Google Scholar]
- Bierne, N., and A. Eyre-Walker, 2004. The genomic rate of adaptive amino acid substitution in Drosophila. Mol. Biol. Evol. 21: 1350–1360. [DOI] [PubMed] [Google Scholar]
- Bone, J. R., and M. I. Kuroda, 1996. Dosage compensation regulatory proteins and the evolution of sex chromosomes in Drosophila. Genetics 144: 705–713. [DOI] [PMC free article] [PubMed] [Google Scholar]
- Braverman, J. M., R. R. Hudson, N. L. Kaplan, C. H. Langley and W. Stephan, 1995. The hitchhiking effect on the site frequency spectrum of DNA polymorphisms. Genetics 140: 783–796. [DOI] [PMC free article] [PubMed] [Google Scholar]
- Bustamante, C. D., A. Fledel-Alon, S. Williamson, R. Nielsen, M. T. Hubisz et al., 2005. Natural selection on protein-coding genes in the human genome. Nature 437: 1153–1157. [DOI] [PubMed] [Google Scholar]
- Charlesworth, B., 1996. Background selection and patterns of genetic diversity in Drosophila melanogaster. Genet. Res. 68: 131–149. [DOI] [PubMed] [Google Scholar]
- Charlesworth, B., 2001. The effect of life-history and mode of inheritance on neutral genetic variability. Genet. Res. 77: 153–166. [DOI] [PubMed] [Google Scholar]
- Charlesworth, D., B. Charlesworth and M. T. Morgan, 1995. The pattern of neutral molecular variation under the background selection model. Genetics 141: 1619–1632. [DOI] [PMC free article] [PubMed] [Google Scholar]
- Das, A., S. Mohanty and W. Stephan, 2004. Inferring the population structure and demography of Drosophila ananassae from multilocus data. Genetics 168: 1975–1985. [DOI] [PMC free article] [PubMed] [Google Scholar]
- Das, M., D. Mutsuddi, A. K. Duttagupta and A. S. Mukherjee, 1982. Segmental heterogeneity in replication and transcription of the X2 chromosome of Drosophila miranda and conservativeness in the evolution of dosage compensation. Chromosoma 87: 373–388. [Google Scholar]
- Eyre-Walker, A., 1997. Differentiating between selection and mutation bias. Genetics 147: 1983–1987. [DOI] [PMC free article] [PubMed] [Google Scholar]
- Eyre-Walker, A., 2002. Changing effective population size and the McDonald–Kreitman test. Genetics 162: 2017–2024. [DOI] [PMC free article] [PubMed] [Google Scholar]
- Fagegaltier, D., and B. Baker, 2004. X chromosome sites autonomously recruit the dosage compensation complex in Drosophila males. PLoS Biol. 2: e341. [DOI] [PMC free article] [PubMed] [Google Scholar]
- Fay, J. C., and C.-I Wu, 2000. Hitchhiking under positive Darwinian selection. Genetics 155: 1405–1413. [DOI] [PMC free article] [PubMed] [Google Scholar]
- Fay, J. C., and C.-I Wu, 2001. The neutral theory in the genomic era. Curr. Opin. Genet. Dev. 11: 642–646. [DOI] [PubMed] [Google Scholar]
- Fay, J. C., G. J. Wyckoff and C.-I Wu, 2001. Positive and negative selection on the human genome. Genetics 158: 1227–1234. [DOI] [PMC free article] [PubMed] [Google Scholar]
- Fay, J. C., G. J. Wyckoff and C.-I Wu, 2002. Testing the neutral theory of molecular evolution with genomic data from Drosophila. Nature 415: 1024–1026. [DOI] [PubMed] [Google Scholar]
- Glinka, S., L. Ometto, S. Mousset, W. Stephan and D. De Lorenzo, 2003. Demography and natural selection have shaped genetic variation in Drosophila melanogaster: a multi-locus approach. Genetics 165: 1269–1278. [DOI] [PMC free article] [PubMed] [Google Scholar]
- Gillespie, J. H., 1997. Junk ain't what junk does: neutral alleles in a selected context. Gene 205: 291–299. [DOI] [PubMed] [Google Scholar]
- Gillespie, J. H., 1999. The role of population size in molecular evolution. Theor. Popul. Biol. 55: 145–156. [DOI] [PubMed] [Google Scholar]
- Gillespie, J. H., 2001. Is the population size of a species relevant to its evolution? Evol. Int. J. Org. Evol. 55: 2161–2169. [DOI] [PubMed] [Google Scholar]
- Haddrill, P., B. Charlesworth, D. Halligan and P. Andolfatto, 2005. a Patterns of intron sequence evolution in Drosophila are dependent upon length and GC content. Genome Biol. 6: R67. [DOI] [PMC free article] [PubMed] [Google Scholar]
- Haddrill, P., K. Thornton, B. Charlesworth and P. Andolfatto, 2005. b Multilocus patterns of nucleotide variability and the demographic and selection history of Drosophila melanogaster populations. Genome Res. 15: 790–799. [DOI] [PMC free article] [PubMed] [Google Scholar]
- Halligan, D., and P. Keightley, 2006. Ubiquitous selective constraints in the Drosophila genome revealed by a genome-wide interspecies comparison. Genome Res. 16: 875–884. [DOI] [PMC free article] [PubMed] [Google Scholar]
- Halligan, D., A. Eyre-Walker, P. Andolfatto and P. Keightley, 2004. Patterns of evolutionary constraints in intronic and intergenic DNA of Drosophila. Genome Res. 14: 273–279. [DOI] [PMC free article] [PubMed] [Google Scholar]
- Hinds, D. A., L. L. Stuve, G. B. Nilsen, E. Halperin, E. Eskin et al., 2005. Whole-genome patterns of common DNA variation in three human populations. Science 307: 1072–1079. [DOI] [PubMed] [Google Scholar]
- Hudson, R., 1987. Estimating the recombination parameter of a finite population model without selection. Genet. Res. 50: 245–250. [DOI] [PubMed] [Google Scholar]
- Hudson, R., 2002. Generating samples under a Wright-Fisher neutral model of genetic variation. Bioinformatics 18: 337–338. [DOI] [PubMed] [Google Scholar]
- Hudson, R. R., M. Kreitman and M. Aguade, 1987. A test of neutral molecular evolution based on nucleotide data. Genetics 116: 153–159. [DOI] [PMC free article] [PubMed] [Google Scholar]
- International HapMap Consortium, 2003. The International HapMap Project. Nature 426: 789–796. [DOI] [PubMed] [Google Scholar]
- Jenkins, D., C. Ortori and J. Brookfield, 1995. A test for adaptive change in DNA sequences controlling transcription. Proc. Biol. Sci. 261: 203–207. [DOI] [PubMed] [Google Scholar]
- Kawahara, Y., T. Matsuo, M. Nozawa, T. Shin-I, Y. Kohara et al., 2004. Comparative sequence analysis of a gene-dense region among closely related species of Drosophila melanogaster. Genes Genet. Syst. 79: 351–359. [DOI] [PubMed] [Google Scholar]
- Kern, A., and D. Begun, 2005. Patterns of polymorphism and divergence from noncoding sequences of Drosophila melanogaster and D. simulans: evidence for nonequilibrium processes. Mol. Biol. Evol. 22: 51–62. [DOI] [PubMed] [Google Scholar]
- Kimura, M., 1983. The Neutral Theory of Molecular Evolution. Cambridge University Press, Cambridge, UK.
- Kohn, M., S. Fang and C. Wu, 2004. Inference of positive and negative selection on the 5′ regulatory regions of Drosophila genes. Mol. Biol. Evol. 21: 374–383. [DOI] [PubMed] [Google Scholar]
- Kopp, A., and O. Barmina, 2005. Evolutionary history of the Drosophila bipectinata species complex. Genet. Res. 85: 23–46. [DOI] [PubMed] [Google Scholar]
- Kovacevic, M., and S. W. Schaeffer, 2000. Molecular population genetics of X-linked genes in Drosophila pseudoobscura. Genetics 156: 155–172. [DOI] [PMC free article] [PubMed] [Google Scholar]
- Kreitman, M., 1983. Nucleotide polymorphism at the alcohol dehydrogenase locus of Drosophila melanogaster. Nature 304: 412–417. [DOI] [PubMed] [Google Scholar]
- Llopart, A., D. Lachaise and J. Coyne, 2005. Multilocus analysis of introgression between two sympatric sister species of Drosophila: Drosophila yakuba and D. santomea. Genetics 171: 197–210. [DOI] [PMC free article] [PubMed] [Google Scholar]
- Ludwig, M. Z., and M. Kreitman, 1995. Evolutionary dynamics of the enhancer region of even-skipped in Drosophila. Mol. Biol. Evol. 12: 1002–1011. [DOI] [PubMed] [Google Scholar]
- Machado, C., R. Kliman, J. Markert and J. Hey, 2002. Inferring the history of speciation from multilocus DNA sequence data: the case of Drosophila pseudoobscura and close relatives. Mol. Biol. Evol. 19: 472–488. [DOI] [PubMed] [Google Scholar]
- Marin, I., A. Franke, G. J. Bashaw and B. S. Baker, 1996. The dosage compensation system of Drosophila is co-opted by newly evolved X chromosomes. Nature 383: 160–163. [DOI] [PubMed] [Google Scholar]
- McDonald, J. H., and M. Kreitman, 1991. Adaptive protein evolution at the Adh locus in Drosophila. Nature 351: 652–654. [DOI] [PubMed] [Google Scholar]
- Nielsen, R., S. Williamson, Y. Kim, M. Hubisz, A. Clark et al., 2005. Genomic scans for selective sweeps using SNP data. Genome Res. 15: 1566–1575. [DOI] [PMC free article] [PubMed] [Google Scholar]
- Nordborg, M., T. Hu, Y. Ishino, J. Jhaveri, C. Toomajian et al., 2005. The pattern of polymorphism in Arabidopsis thaliana. PLoS Biol. 3: e196. [DOI] [PMC free article] [PubMed] [Google Scholar]
- Ohta, T., 1998. Evolution by nearly-neutral mutations. Genetica 102–103: 83–90. [PubMed] [Google Scholar]
- Ometto, L., S. Glinka, D. De Lorenzo and W. Stephan, 2005. Inferring the effects of demography and selection on Drosophila melanogaster populations from a chromosome-wide scan of DNA variation. Mol. Biol. Evol. 22: 2119–2130. [DOI] [PubMed] [Google Scholar]
- Orengo, D. J., and M. Aguade, 2004. Detecting the footprint of positive selection in a European population of Drosophila melanogaster: multilocus pattern of variation and distance to coding regions. Genetics 167: 1759–1766. [DOI] [PMC free article] [PubMed] [Google Scholar]
- Parisi, M., R. Nuttall, D. Naiman, G. Bouffard, J. Malley et al., 2003. Paucity of genes on the Drosophila X chromosome showing male-biased expression. Science 299: 697–700. [DOI] [PMC free article] [PubMed] [Google Scholar]
- Pluzhnikov, A., A. Di Rienzo and R. Hudson, 2002. Inferences about human demography based on multilocus analyses of noncoding sequences. Genetics 161: 1209–1218. [DOI] [PMC free article] [PubMed] [Google Scholar]
- Przeworski, M., 2002. The signature of positive selection at randomly chosen loci. Genetics 160: 1179–1189. [DOI] [PMC free article] [PubMed] [Google Scholar]
- Rand, D., and L. Kann, 1996. Excess amino acid polymorphism in mitochondrial DNA: contrasts among genes from Drosophila, mice, and humans. Mol. Biol. Evol. 13: 735–748. [DOI] [PubMed] [Google Scholar]
- Rice, W. R., 1984. Sex chromosomes and the evolution of sexual dimorphism. Evolution 38: 735–742. [DOI] [PubMed] [Google Scholar]
- Richards, S., Y. Liu, B. Bettencourt, P. Hradecky, S. Letovsky et al., 2005. Comparative genome sequencing of Drosophila pseudoobscura: chromosomal, gene, and cis-element evolution. Genome Res. 15: 1–18. [DOI] [PMC free article] [PubMed] [Google Scholar]
- Sawyer, S., R. Kulathinal, C. Bustamante and D. Hartl, 2003. Bayesian analysis suggests that most amino acid replacements in Drosophila are driven by positive selection. J. Mol. Evol. 57(Suppl. 1): S154–S164. [DOI] [PubMed] [Google Scholar]
- Segarra, C., E. Lozovskaya, G. Ribû, M. Aguadè and D. Hartl, 1995. P1 clones from Drosophila melanogaster as markers to study the chromosomal evolution of Muller's A element in two species of the obscura group of Drosophila. Chromosoma 104: 129–136. [DOI] [PubMed] [Google Scholar]
- Smith, N. G., and A. Eyre-Walker, 2002. Adaptive protein evolution in Drosophila. Nature 415: 1022–1024. [DOI] [PubMed] [Google Scholar]
- Tachida, H., 2000. DNA evolution under weak selection. Gene 261: 3–9. [DOI] [PubMed] [Google Scholar]
- Tajima, F., 1989. a Statistical method for testing the neutral mutation hypothesis by DNA polymorphism. Genetics 123: 585–595. [DOI] [PMC free article] [PubMed] [Google Scholar]
- Tajima, F., 1989. b The effect of change in population size on DNA polymorphism. Genetics 123: 597–601. [DOI] [PMC free article] [PubMed] [Google Scholar]
- Templeton, A., 1996. Contingency tests of neutrality using intra/interspecific gene trees: the rejection of neutrality for the evolution of the mitochondrial cytochrome oxidase II gene in the hominoid primates. Genetics 144: 1263–1270. [DOI] [PMC free article] [PubMed] [Google Scholar]
- Thornton, K., and P. Andolfatto, 2006. Approximate Bayesian inference reveals evidence for a recent, severe, bottleneck in a Netherlands population of Drosophila melanogaster. Genetics 172: 1607–1619. [DOI] [PMC free article] [PubMed] [Google Scholar]
- Wall, J., P. Andolfatto and M. Przeworski, 2002. Testing models of selection and demography in Drosophila simulans. Genetics 162: 203–216. [DOI] [PMC free article] [PubMed] [Google Scholar]
- Wright, S., I. Bi, S. Schroeder, M. Yamasaki, J. Doebley et al., 2005. The effects of artificial selection on the maize genome. Science 308: 1310–1314. [DOI] [PubMed] [Google Scholar]
- Yi, S., and B. Charlesworth, 2000. Contrasting patterns of molecular evolution of the genes on the new and old sex chromosomes of Drosophila miranda. Mol. Biol. Evol. 17: 703–717. [DOI] [PubMed] [Google Scholar]
- Yi, S., D. Bachtrog and B. Charlesworth, 2003. A survey of chromosomal and nucleotide sequence variation in Drosophila miranda. Genetics 164: 1369–1381. [DOI] [PMC free article] [PubMed] [Google Scholar]