Abstract
The surfaces and immobilization chemistries of DNA microarrays are the foundation for high quality gene expression data. Four surface modification chemistries, poly-l-lysine (PLL), 3-glycidoxypropyltrimethoxysilane (GPS), DAB-AM-poly(propyleminime hexadecaamine) dendrimer (DAB) and 3-aminopropyltrimethoxysilane (APS), were evaluated using cDNA and oligonucleotide sub-arrays. Two un-silanized glass surfaces, RCA-cleaned and immersed in Tris–EDTA buffer were also studied. DNA on amine-modified surfaces was fixed by UV (90 mJ/cm2), while DNA on GPS-modified surfaces was immobilized by covalent coupling. Arrays were blocked with either succinic anhydride (SA), bovine serum albumin (BSA) or left unblocked prior to hybridization with labeled PCR product. Quality factors evaluated were surface affinity for cDNA versus oligonucleotides, spot and background intensity, spotting concentration and blocking chemistry. Contact angle measurements and atomic force microscopy were preformed to characterize surface wettability and morphology. The GPS surface exhibited the lowest background intensity regardless of blocking method. Blocking the arrays did not affect raw spot intensity, but affected background intensity on amine surfaces, BSA blocking being the lowest. Oligonucleotides and cDNA on unblocked GPS-modified slides gave the best signal (spot-to-background intensity ratio). Under the conditions evaluated, the unblocked GPS surface along with amine covalent coupling was the most appropriate for both cDNA and oligonucleotide microarrays.
INTRODUCTION
The DNA microarray enables researchers to survey the entire transcriptome of virtually any cell population. This capability produces unprecedented quantities of raw data and enables the investigation of gene expression, functional genomics and genetic complexity with potentially many more applications (1–4). Although production capabilities and use of microarrays are becoming increasingly well established, significant differences exist with regard to fabrication techniques and end user protocols. Such differences make it difficult to compare results across platforms and present data management challenges for the integration of databases. Fabrication parameters that may vary include: surface chemistry of slides (5–9), type and length of printed DNA (2,9) and immobilization or fixing strategies for the spotted DNA. Various end user protocols include: pre-hybridization surface blocking (3), mRNA labeling protocols, hybridization protocols, post-hybridization wash stringency and data analysis techniques (4,10,11). An additional area of great concern is the implementation (placement and type) of appropriate controls aimed at quality assurance and quality control. The absence of approaches that are based on ‘best practices’ for design, fabrication, and end use of microarrays makes comparative data analysis between groups problematic. Although some work has been recently published that addresses several of these issues, (2–7,9–13) there is still little consensus about which design features and end user protocols are optimum for highest quality microarray data. In a recent attempt to develop microarray standards, the authors of the MIAME (minimum information about a microarray experiment) protocol have introduced guidelines for establishing standards concerning the information requirements for a more effective comparative analysis of microarray data between groups (10). The emphasis on these guidelines is however on documentation and not on engineering guidance. This paper aims at providing engineering guidance in the fabrication of cDNA and oligonucleotide microarrays.
The glass surfaces of DNA microarrays have been modified in various ways to immobilize DNA (oligonucleotides and/or cDNA) (5–9). Common surface modifications for printing and affixing DNA onto glass slides are: poly-l-lysine (PLL) (14), 3-aminopropyltrimethoxysilane (APS) (3,5,9), 3-glycidoxypropyltrimethoxysilane (GPS) (7,9) and aldehyde or carboxylic acid (5). DNA has also been directly printed onto unmodified glass (9). Amine-terminated cDNA and amine-terminated oligonucleotides may be covalently coupled to epoxide, isothiocyanate and aldehyde activated glass surfaces (7). Non-terminated DNA has also been spotted onto amine-functionalized surfaces such as PLL, APS and surfaces that were functionalized and derivatized with polyamidoamine dendrimer (PAMAM) (6).
One possible advantage of GPS, APS and PAMAM over PLL is that the former are covalently immobilized to the silicon bearing hydroxide functional groups on the surface of glass, while PLL is immobilized by adsorption, the result of acid–base interactions and hydrogen bonding with the amphoteric glass surface (15). Moreover, it has been reported that aminosilanes and PAMAM surfaces offer a more consistent surface than PLL, with lower background and higher overall fluorescent signal intensities (6). Given that there are ∼5.0 silanol groups/nm2 on a fully hydroxylated silica surface that is supplemented by a few layers of surface bound water, and given that the APS molecule could pack to a limit of ∼5 molecules/nm2 (perfect hydrocarbon chain packing, e.g. c-axis of polyethelene crystals packs at ∼5.2–5.4), then it is likely that a well-packed APS layer would typically present in the range 3.5–4.0 amine groups/nm2 (16,17), while PAMAM derivatized surfaces present ∼66 amines/nm2 (18). In addition, PLL surfaces generally require an induction period of ∼2 weeks before they can produce consistent microarray results (3). PLL, APS and PAMAM all present amine functional groups suitable for interaction with DNA via hydrogen bonding and, potentially, via electrostatic interactions (9) under the appropriate pH conditions. DNA is commonly ‘cross-linked’ on these surfaces by exposure to UV light, however this process is poorly understood but is believed to involve the creation of radicals that induce inter-chain cross-linking. GPS, in contrast, allows amine-terminated DNA to be covalently immobilized to the surface (19) via an amine-initiated nucleophilic ring opening reaction that leads to covalent bond formation between the GPS and the amine-terminated DNA.
Blocking reactions are typically employed to prevent labeled reverse transcription product from adsorbing to the surface of the printed microarray during the hybridization reaction. Blocking methods provide the added advantage of washing away unbound DNA from the surface that would otherwise compete with the labeled species (3). Two of the most common blocking methods to address non-specific adsorption on amine-modified microarrays involve blocking with succinic anhydride (SA) (3,14) or bovine serum albumin (BSA) (3). Both are intended to block the unreacted functional groups of the printed microarray with chemistries that have low affinity for DNA.
In this paper, we report an evaluation of spotting concentration, surface chemistries and blocking strategies for their combined role in the performance of oligonucleotide and cDNA microarrays. Our goal was to establish optimum protocols for manufacturing, spotting, hybridization and scanning of microarrays. cDNA and oligonucleotide microarrays were therefore spotted on six different surfaces. These surfaces evaluated were: APS, GPS, DAB-AM-16-poly(propyleminime hexadecaamine) (DAB), and PLL. DAB is a generation 3 dendrimer that was linked to the glass surface via covalent coupling following surface modification with GPS. In addition, two unmodified blank slides: (i) RCA-cleaned, but not surface modified (RCA); and (ii) cleaned and immersed in Tris–EDTA buffer (TEB) were also evaluated. Microarrays were blocked with either SA (SA-blocked), BSA (BSA-blocked) or left unblocked. These surfaces represent a broad range of available surface chemistries. The GPS presents the reactive glycidoxy functional group to which amine-terminated oligonucleotides and cDNA, derived from amine-terminated primers, could be covalently affixed. The APS, PLL and DAB surfaces present varying densities of amine functionalities for hydrogen-bonding interactions with DNA. The RCA-cleaned glass slides served as a reference surface while the TEB immersion deliberately introduced surface contamination to otherwise cleaned glass slide surfaces. The non-blocked surface served as the control for blocking. These surfaces and blocking strategies were evaluated by fabricating microarrays of cDNA and 30mer oligonuclotides prepared using the human GAPDH gene sequence. The oligonucleotides and cDNA were spotted at five different concentrations and hybridized to Alexaflour 555-labeled GAPDH PCR product. Wettability of the surfaces was determined by contact angle measurements with hexadecane and ultrapure water. Surface morphology was characterized by atomic force microscopy (AFM).
MATERIALS AND METHODS
Cleaning, preparation and surface modification of microarray slides
In a class 1000 clean room, 50 VWR brand glass microscope slides (VWR 48300-025) were solvent cleaned by immersion for 1 min in boiling acetone followed by 1 min in boiling isopropanol. The slides were then washed in ultrapure H2O (18 MOhm) for 1 min and dried with filtered nitrogen. Next, the slides were UV/ozonated for 15 min on one side using a Boekel UV Clean Model 135500 followed by ultrasonication in a Branson 1510 ultrasonicator in isopropanol for 5 min. The slides were then washed in diH2O and dried using filtered nitrogen. Finally, the slides were activated by immersion in a (5:1:1) solution of diH2O:hydrogen peroxide:ammonium hydroxide (RCA) at 60°C for 1 min, followed by diH2O wash, placed in glass slide carriers and dried in a convection oven for 30 min at 80°C. After this step, RCA-cleaned slides were stored for subsequent spotting.
The cleaned slides were then partitioned into six groups. One group of nine slides was modified by immersion in a solution of γ-APS 0.1% v/v in anhydrous toluene for 30 min at 40°C, washed three times in anhydrous toluene, placed in a glass staining dish and cured in a convection oven for 20 min at 110°C. The slides were then stored until needed for printing. Twenty-four slides were chemically modified by immersion in a solution of GPS 0.1% v/v in anhydrous toluene for 30 min at 40°C, washed three times in anhydrous toluene, placed in a glass staining dish and cured in a convection oven for 20 min at 110°C. Nine of these slides were stored for printing, and the remaining slides were subsequently modified by immersion in a solution of DAB 1.0% v/v in absolute ethanol overnight at room temperature. After the overnight incubation, the slides were washed three times in ethanol, placed in a glass staining dish and cured in a convection oven for 20 min at 110°C. The nine remaining slides were immersed in TEB (1.0 M Tris, 0.1 M EDTA) for 30 min at room temperature, washed in diH2O, dried in a convection oven and stored. Nine slides were modified with PLL. The slides were immersed in a solution of 70 ml phosphate-buffered saline, 70 ml of 0.1% PLL and 560 ml of diH2O, then incubated with gentle shaking for 1 h at room temperature. The slides were then washed five times in diH2O, dried with filtered nitrogen and placed in a 55°C vacuum oven for 10 min. All slides were stored in a plastic microscope box wrapped in aluminum foil then placed in a desiccator cabinet until needed for spotting. The PLL-modified slides were stored for 1 week prior to microarray spotting.
Contact angle and AFM measurements
Contact angles of de-ionized water (γL = γLp + γLd = 53 + 20 = 73 mN m–1) and anhydrous hexadecane (γL ≈ γLd = 26 mN m–1) were measured at the cleaned or chemically modified microscope glass slides using an NRL Contact Angle Goniometer (Ramé-Hart Inc., Mountain Lakes, NJ). Octadecyltricholorsilane (OTS) was used as a reference surface and was prepared following solvent cleaning by immersion in 0.1% v/v OTS in anhydrous toluene at 40°C for 30 min. The slides were then rinsed three times with toluene and dried at 110°C for 20 min. In a contact angle measurement, a droplet (∼15 µl) of probe solvent was placed on the cleaned or modified glass slide from a fixed height, and the contact angle was directly measured through the focusing lens of the goniometer. AFM was performed using a Digital Instruments Dimension 3100 Atomic Force Microscope. Scan rates were set between 5 and 8 Hz depending on the image quality, and the scan size was changed from 1 to 10 µm upon engagement of the cantilever. The instrument was operated in tapping mode to obtain the micrographs. The resulting height images were processed using Nanoscope III software. Images were flattened to remove scan lines, and the height scale was set to 75 nm. Feedback controls such as integral gain, proportional gain and amplitude set point were modulated in real time as the image was being generated. Integral and proportional gain were always set between 2 and 0.5.
Preparation of GAPDH cDNA for arraying
The glyceraldehyde-3-phosphate dehydrogenase (GAPDH) gene fragment obtained from PCR was a source of cDNA for arraying onto the slides prepared in the previous step. Amine-modified PCR primers: forward: 5′ amine-C6-ccacccatggcaaattccatggcaccgtca and reverse: 5′ amine-C6-ggtttttctagacggcaggtcaggtccacc, were diluted to a working con centration of 0.001 µg/µl and 10 µl was then mixed with 0.5 µl (5000 U/µl) of New England Biolabs (NEB) Taq polymerase (M0267S), 0.1 µl (200 mM) dNTPs (Invitrogen 10216-012, 014, 016, 018), 5 µl of 10× NEB PCR buffer, 0.5 µl of GAPDH template and 34 µl of diH2O per 50 µl reaction for a total of 50 reactions. The reaction was initiated at 95°C for 30 s and cycled 29 times under the following conditions: melt at 95°C for 30 s, anneal at 50°C for 30 s and extend at 72°C for 1 min using an MJ Research PTC-200 thermal cycler. After PCR, the reaction products were combined and distributed into three 1.7 µl centrifuge tubes. To each tube was added 750 µl of 100% ice-cold isopropanol and the tubes were centrifuged at 14 000 r.p.m. for 30 min in an Eppendorf Model 5804R centrifuge to pelletize the PCR product. The pellet was washed in 75% ethanol and re-pelleted by centrifugation at 14 000 r.p.m. for 30 min. After centrifugation the pellet was re-suspended in 20 µl diH2O per tube and the contents of each tube were combined. The concentration of GAPDH in solution was quantified by UV spectroscopy with a Perkin Elmer Lambda 40 spectrometer. The GAPDH cDNA was diluted to the concentrations of 2.0, 1.0, 0.5, 0.2, 0.02 and 0.002 µg/µl. An equal volume of 2× spotting buffer (3 M Betaine, 6× SSC) was added to each of the dilutions to make the 1× spotting solution. The solutions were then distributed into separate 96 well V bottom micotiter plates using a Packard Biochip MultiProbeII Liquid Handling robot. The plates were stored at –20°C until needed for spotting.
Preparation of oligonucleotides for arraying
Oligonucleotide primers were designed using the GAPDH sequence (accession no. NM_002046) and synthesized by Integrated DNA Technologies. Table 1 lists the oligonucleotides, their 5′ modification and their position in the GAPDH sequence. The forward, interior and random primers were diluted to the 2× concentrations: 2.0, 1.0, 0.5, 0.2, 0.02 and 0.002 µg/µl in diH2O and mixed with an equal volume of 2× spotting buffer (3 M betaine, 6× SSC). The forward, interior and random primers were arrayed on each type of chemically modified glass slide as well as onto the two groups of unmodified slides (RCA-cleaned and buffer immersed).
Table 1. Oligonucleotide sequence information.
| Oligo name | Position | Modification | Sequence |
|---|---|---|---|
| Forward | 228–258 | Amine | ccacccatgg caaattccat ggcaccgtca |
| Reverse | 802–811 | Amine | ggtttttcta gacggcaggt caggtccacc |
| Interior | 502–531 | Amine | cagcctcaag atcatcagca atgcctcctg |
| Unlabeled competitor | Complement of interior | None | caggaggcat tgctgatgat cttgaggctg |
| Randomer | None | Amine | acctggacct gaatccgcca tatagcctac |
Probe immobilization
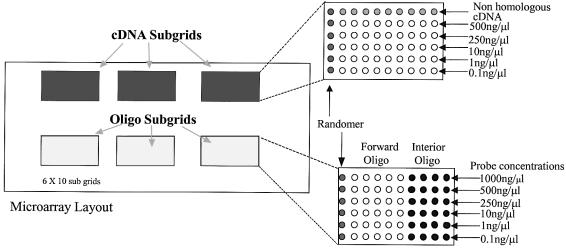
Array fabrication was performed using a Cartesian Technologies PixSys 5500SQ Pin Array Robot and Liquid Dispensing System. Forward, interior and the random oligonucleotide sequences were spotted in three sub-arrays on slides that were modified with GPS, APS, DAB, PLL and the unmodified slides (RCA-cleaned and buffer immersed). PCR amplified GAPDH cDNA was also spotted on these slides in three additional but separate sub-arrays. The DNA arrayed on these surfaces was spotted in graded concentrations using the betaine spotting solution. The final DNA microarray layout is shown in Figure 1. After spotting, the APS, DAB, PLL, RCA and buffer immersed arrays were cross-linked with 90 mJ/cm2 in an Ultra-Violet Products CL-1000 UV cross-linker and baked at 80°C for 1.5 h. The GPS arrays were incubated at 42°C in 50% humidity for 8 h, rinsed with 0.2% SDS solution for 2 min by vigorous shaking, washed three times in diH2O, incubated in diH2O at 50°C for 20 min then dried with filtered nitrogen. All arrays were then stored in foil-wrapped slide-boxes in a desiccator cabinet overnight prior to hybridization.
Figure 1.
Microarray layout.
Labeling of GAPDH target
The forward and reverse oligonucleotide primers were used to amplify a 600 bp region of the GAPDH gene for fluorophore labeling. The previously described PCR protocol was used except that aminoallyl dUTP (Molecular Probes A-21664) was included in the reaction mixture at a ratio of 3:1 dUTP:TTP for a final concentration of 200 mM in each 80 µl reaction for a total of 60 reactions. The resulting PCR product was labeled using the ARES™ DNA labeling kit from Molecular Probes (A-21665) according to the supplied protocol.
Pre-hybridization blocking
Twelve slides were immersed in pre-hybridization buffer containing 5× SSC, 0.1% SDS and 1.0% BSA, incubated at 42°C for 45 min, washed 5× in diH2O then dried using filtered nitrogen. Another 12 slides were immersed in SA pre-hybridization solution containing 15 ml sodium borate and 6 g SA in 350 ml 1-methyl-2-pyrrolidinone. The solution containing the slides was incubated on an orbital shaker for 20 min, quenched in boiling diH2O, washed five times in 95% ethanol and dried using filtered nitrogen. Twelve slides were left unblocked. The remaining slides in the GPS and RCA groups were processed separately according to the same protocol.
Hybridization and imaging
Each group of slides was hybridized using a GenTac Hybridization Station (Genomic Solutions). 100 µl of hybridization buffer [4× SSC, 1× Denhardt’s reagent, 5.0% SDS, 10% dextran sulfate, 40% formamide solution (50% v/v diH2O)] containing 40 ng labeled GAPDH cDNA and, for some experiments, 24 ng unlabeled competitor, was added to each microarray hybridization solution. The hybridization was allowed to proceed for 16 h at 42°C. After hybridization, the arrays were sequentially washed with medium stringency buffer (2× SSC, 0.1% SDS) (Genomic Solutions 16004001), high stringency buffer (0.1× SSC, 0.05% SDS) (Genomic Solutions 16004501), post wash buffer (0.1× SSC) (Genomic Solutions 16003501) and diH2O. The arrays were then dried with filtered nitrogen. Each microarray was scanned at 5 µm resolution using a Perkin Elmer ScanArray 5000 microarray scanner using the 488 nm filter.
RESULTS
Surface chemistry and blocking strategy
Four chemically modified and two unmodified glass surfaces were studied for their characteristics relating to: (i) immobilization of cDNA and oligonucleotides, (ii) resulting slide background intensity after hybridization, (iii) signal intensity (spot intensity/slide background intensity) following hybridization and (iv) spotting uniformity. The surface chemistries evaluated were γ-APS, GPS, DAB (linked to the glass surface via GPS), PLL, a cleaned glass surface that had been immersed in TEB and a RCA-cleaned surface. These surfaces were selected because they are commonly used or otherwise cost effective/easy to implement in the microarray fabrication laboratory. While there are several alternative attachment chemistries (5,7), we limited this study to the most widely used and well-documented examples. Most cDNA microarray fabrication has been reported using PLL surfaces (2,3,14,15). However, Hegde et al. (3) and Liu et al. (20) have used APS surfaces for their cDNA microarray work and APS-modified glass surfaces are commercially available from Corning [CMT-GAPS slides (catalog no. 40004, Corning)] and Telechem [Super Amine slides (catalog no. SMM)] (web addresses for microarray substrates: Corning: http://www.corning.com/LifeSciences/pdf/gaps_ii_coated_slides_10_01_ss_cmt_gaps_002.pdf and Telechem: http://arrayit.com/Products/Substrates/substrates.html).
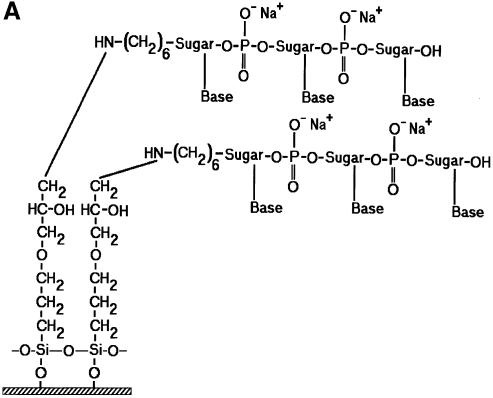
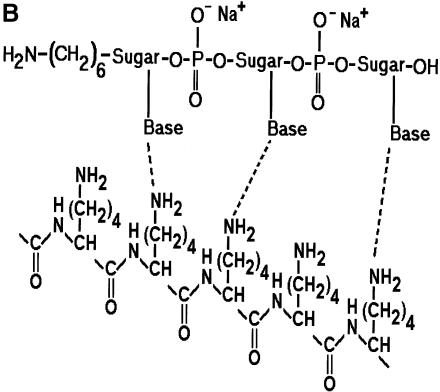
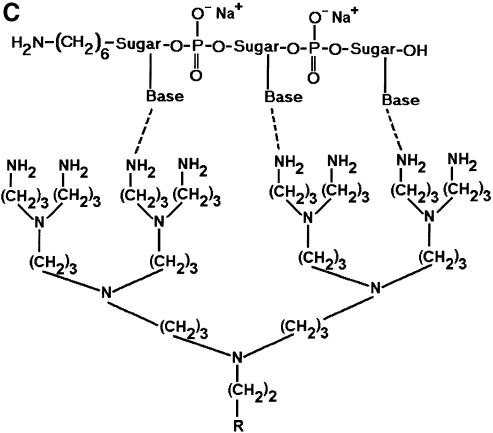
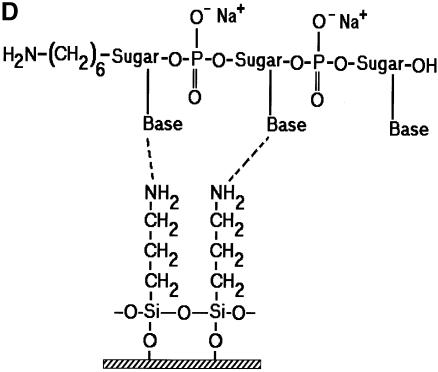
In an effort to identify a better microarray surface, one group has examined the amine presenting compound, PAMAM (6), and found it to have superior background and oligonucleotide capturing characteristics. We chose a closely related compound to that used by Benters et al. (6) for comparison with the common amine surfaces. As a means of covalent coupling, it has been reported that epoxy-silane (GPS) has been used for immobilizing amine-terminated oligonucleotides and cDNA (5,21). Figure 2 is a schematic illustration of the various surfaces studied.
Figure 2.
Schematic illustration of the various surface chemistries studied and the idealized interaction of DNA with functional groups on a glass surface. (A) GPS covalently bound to an amine-terminated oligonucleotide. (B) PLL hydrogen bonding with an oligonucleotide. (C) One-half of a DAB dendrimer hydrogen bonding with an oligonucleotide. (D) APS hydrogen bonding with an oligonucleotide.
The pre-hybridization blocking strategies studied were: no blocking, the adsorption of BSA and the reaction of SA. The ability of each of these three blocking strategies to reduce post-hybridization background intensity was investigated for each of the six surfaces. SA is commonly used as a blocking reagent in cDNA microarrays prepared on amine-functionalized surfaces (3,13). The anhydride readily reacts with the available amines forming the amide and thereby eliminating the amine from the surface with the intent of avoiding non-specific adsorption of DNA. Such an approach should be effective for both oligonucleotide and cDNA microarrays. A blocking solution containing BSA has been reported by Hegde et al. (3) to result in lower background intensities when compared with SA. BSA is a neutral globular protein that readily adsorbs to surfaces and is commonly used in ELISAs.
There are two microarray platforms in wide usage: cDNA and oligonucleotide arrays. The oligonucleotide arrays vary in oligonucleotide length but are generally 25–70mers while printed cDNA typically ranges from 70 to 600 bp. Both types were evaluated in this study. The oligonucleotides selected were 30mers of the GAPDH gene and the cDNA was an ∼600 bp PCR product amplified from GAPDH using amine-terminated primers. Both types of DNA were spotted over a broad range of concentration (0.001–0.5 µg/µl).
We measured spot quality as a function of spot and background intensities. All intensities were measured under the same conditions of laser power and PMT gain. Images were subsequently scanned at the same resolution (5 microns). Our findings are presented according to the blocking strategy employed.
Background intensities
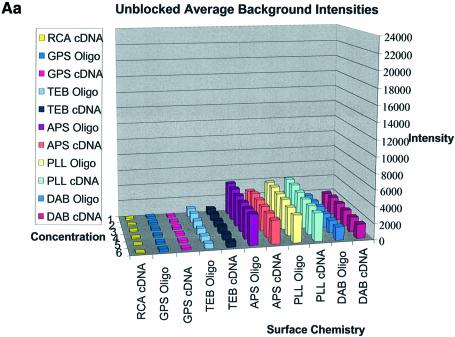
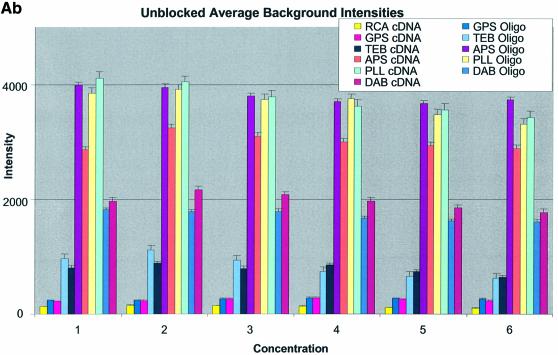
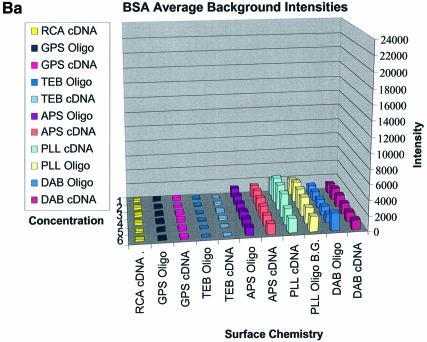
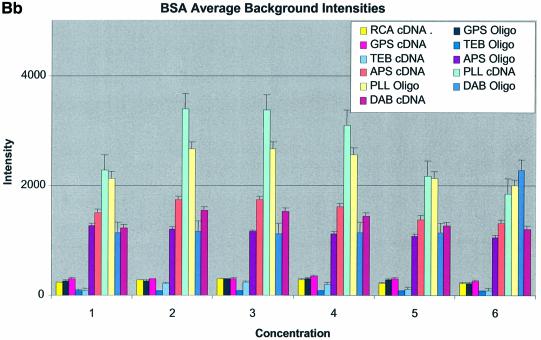
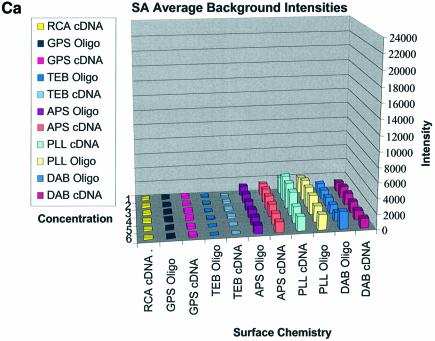
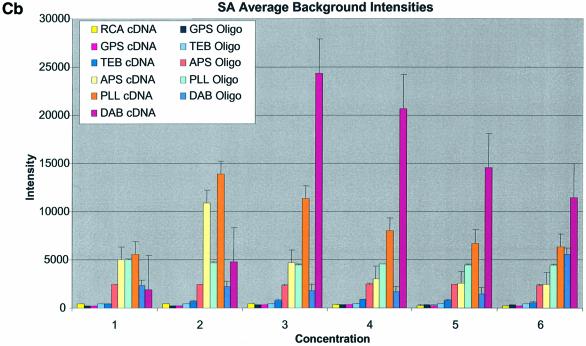
Figure 3A–C shows the average background intensities following hybridization to target for all the cDNA and oligonucleotide sectors of all six chemically modified surfaces. Background intensities were measured for each of the six different spotting concentrations (0.001–0.5 µg/µl) employed and averaged over the many replicates for that concentration. We chose this approach to allow us to discern the influence of spotting concentration, and hence spot intensity, on the intensity of the background signal as perceived by the QuantArray software. All intensities were measured using the same QuantArray parameters and were plotted on the same scale to allow ready visual comparison of the data. Figure 3A shows the background intensity of unblocked slides, while Figure 3B and C shows the background intensities of the BSA- and SA-blocked slides, respectively.
Figure 3.
(Previous two pages and above) Average background intensities following hybridization of all cDNA and oligonucleotide sectors at different spotting concentrations (0.001–1.0 µg/µl) for all six surfaces studied. These are grouped by the blocking method employed; (A) unblocked, (B) BSA blocked and (C) SA blocked. (a) 3D bar charts of average background intensities as a function of spotting concentration and surface chemistry. (b) 2D bar charts showing the standard error.
It can be seen in Figure 3A (unblocked) that the amine-bearing surfaces gave the highest background intensities (∼4000 counts) when compared with the unmodified surfaces, RCA and TEB, and the epoxide-bearing surface. Figure 3B (BSA-blocked) shows very similar behavior to the unblocked slides. That is, the amine-bearing surfaces gave higher background intensities when compared with the unmodified surfaces, RCA and TEB, and the epoxide-bearing surface. However, in this case the background intensities are between 1000 and 2000 counts, half as much as the unblocked slides. BSA therefore reduces the background intensity by ∼50% compared with unblocked slides. It is noteworthy that this reduction in background intensity is most significant for the amine-bearing surfaces and does not significantly affect the background intensities of the unmodified surfaces, RCA and TEB, or the epoxide-bearing surface. It can be seen in Figure 3C (SA-blocked) that the amine-bearing surfaces likewise gave higher background intensities compared with the unmodified surfaces, RCA and TEB, and the epoxide-bearing surface. However, in the case of SA blocking, these background values were considerably higher than those found for the amine-bearing surfaces on unblocked and BSA-blocked slides. Here, background intensities ranged from 3000 to 24 000 counts. There is also clear variation in the behavior of oligonucleotide and cDNA spots when blocked with SA. Oligonucleotide sectors were less prone to high background intensity counts while cDNA sectors gave high counts. Close observation of the scanned images revealed sizable comet tails on the cDNA spots. These observations have been previously reported in microarray experiments using SA blocking (19,20, Oregon State Microarray Laboratory: http://www.cgrb.orst.edu/CSL/custom.pdf). SA appears to have a deleterious effect on UV-cross-linked cDNA spots, inducing comet tail formation, compromising the integrity of DNA spots.
Spot intensities
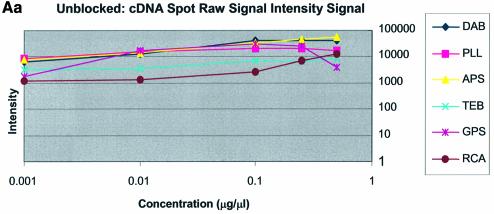
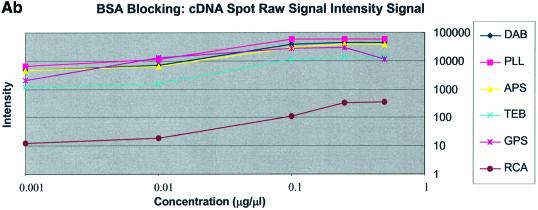
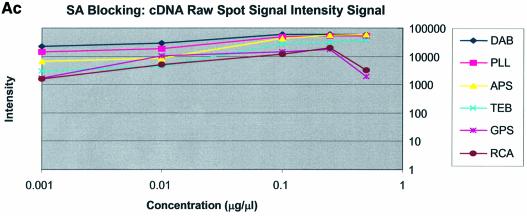
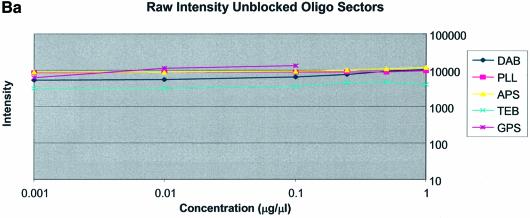
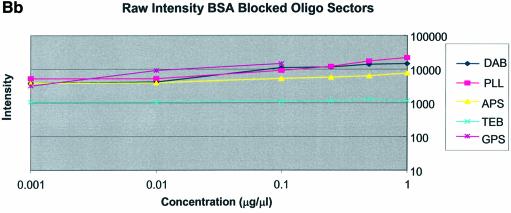
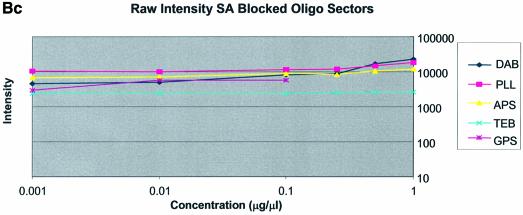
Oligonucleotide and cDNA sectors were spotted at concentrations of 0.001, 0.01, 0.1, 0.25, 0.5 and 1.0 µg/µl. Figure 4A and B shows the resulting raw spot intensities obtained over these six concentrations and under the three blocking conditions studied. For cDNA sectors the plots display a fairly sharp rise to plateau between 0.25 and 1.0 µg/µl resulting in higher spot intensity values than oligonucleotide sectors. The oligonucleotide plots did not exhibit a plateau, rather they displayed a constant gradual rise and a smaller and more even slope. Although both types of DNA were spotted at the same concentration, the raw spot intensities of oligonucleotide sectors were generally lower than those of cDNA sectors (Fig. 4B versus A) over all surfaces studied. cDNA sectors displayed an ∼2–8-fold higher raw intensity than oligonucleotide sectors for any given concentration.
Figure 4.
(Previous page and above) (A) Plots of logarithm of raw spot intensity data of cDNA sectors as a function of concentration over the range 0.001–0.5 µg/µl. (a) Unblocked, (b) BSA blocked, (c) SA blocked. (B) Plots of logarithm of raw spot intensity data of oligonucleotide DNA sectors as a function of concentration over the range 0.001–1.0 µg/µl. (a) Unblocked, (b) BSA blocked, (c) SA blocked.
The difference between cDNA and oligonucleotide spot intensities was especially apparent among the amine surfaces where spot intensities differed 8-fold. Oligonucleotides and cDNA exhibited close clustering at each concentration regardless of the surface modification employed, except for the buffer-treated surface. However, oligonucleotide intensity on the GPS surface was slightly higher than that found on other surfaces when blocked with BSA or in the unblocked condition. cDNA intensity from the GPS surface was tightly clustered with the other surfaces. Thus, the difference in intensity for oligonucleotide and cDNA sectors was ∼2-fold between the concentrations 0.001 and 0.1 µg/µl. This indicates that GPS is more effective for immobilizing oligonucleotides than the other surfaces. Measurable spot intensities for oligonucleotide sectors were not detected on RCA or TEB surfaces because the oligonucleotides, we believe, were washed away during blocking and/or hybridization.
Signal intensities
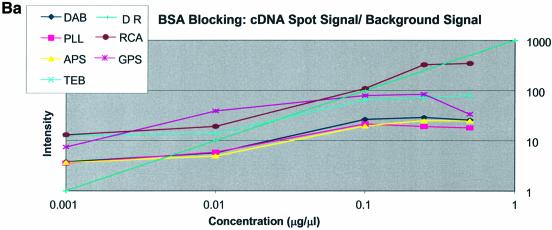
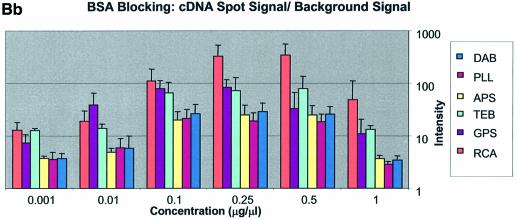
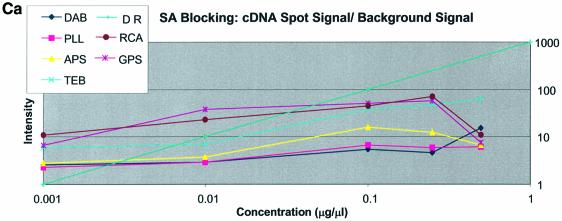
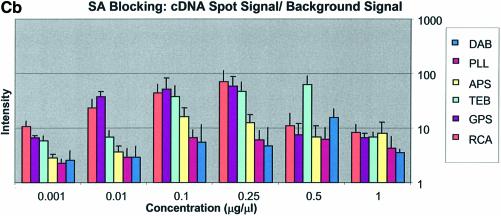
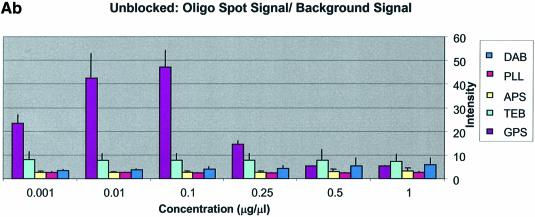
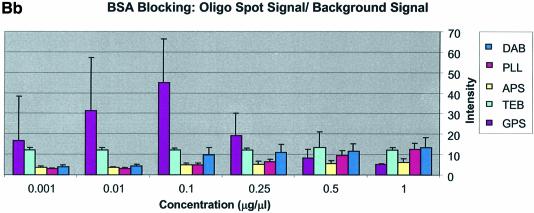
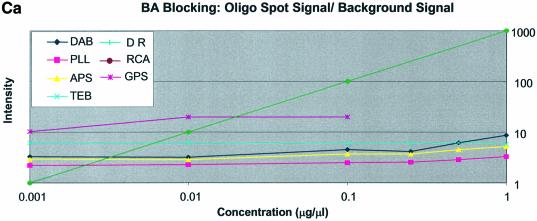
Here we define signal intensity to be the spot intensity divided by the background intensity. Signal intensities were measured using the QuantArray software and are presented as log intensity versus log concentration plots and as bar charts with standard deviations in Figure 5A–C for cDNA and Figure 6A–C for oligonucleotide. Included on these plots is the expected theoretical dynamic range, where for 10-fold dilutions the slope = log (10). The figures show that GPS surfaces yielded the highest signal intensity for both oligonucleotide and cDNA sectors. RCA-cleaned and unmodified surfaces showed the second highest signal intensity for cDNA; however, there was no apparent signal from oligonucleotide sectors on RCA slides. The DAB-modified surface performed third best with oligonucleotides and cDNA, except for the SA-blocked cDNA sectors. In cDNA sectors from SA-blocked slides prominent ‘comet tails’ were observed originating from the cDNA spots. This feature contributed greatly to the background intensity and accordingly negatively impacted on signal intensity.
Figure 5.
(Previous page and above) Plots of the signal intensity (spot/background) as a function of cDNA concentration at the various microarray surfaces employing: (A) unblocked, (B) BSA blocked, (C) SA blocked [(a) xy graph, (b) bar chart with standard deviation].
Figure 6.
(Previous page and above) Plots of the signal intensity (spot/background) as a function of oligonucleotide DNA concentration at the various microarray surfaces employing: (A) unblocked, (B) BSA blocked, (C) SA blocked [(a) xy graph, (b) bar chart with standard deviation].
Generally, there was low variation in magnitude of raw spot intensity from cDNA sectors across all surfaces. Exceptions included the buffer treated slides, which had poor spot integrity (circularity and uniformity), and the RCA-cleaned surface under the unblocked and BSA-blocked conditions. In all cases the raw spot intensity on GPS surfaces was comparable, if not higher in magnitude, with the spots from the other surfaces (Fig. 4). However, since the background signal from the GPS surfaces was much lower than any of the other surfaces except RCA, the signal from the GPS surfaces was almost always greater between the spotting concentrations of 0.25 and 0.01 µg/µl.
Note that in Figure 5A (unblocked cDNA sectors) the dynamic range line is matched only by the GPS-modified surface between 0.001 and 0.01 µg/µl. Spots on the RCA-cleaned surface between the concentrations 0.1 and 0.5 µg/µl also match the DR curve. No other surfaces show significant concurrence with the DR curve for this test condition. In Figure 5B (BSA-blocked cDNA sectors) it was observed that the RCA-cleaned surface matched the DR line between the concentrations 0.01 and 0.25 µg/µl while GPS matched the DR line between 0.001 and 0.01 µg/µl. The other surfaces (APS, PLL, TEB and DAB) conform better to the DR line between the concentrations 0.01 and 0.1 µg/µl but still do not follow the expected slope exactly. In Figure 5C (SA-blocked cDNA sectors) it can be seen that the RCA-cleaned surface matched the DR line between the concentrations 0.001 and 0.10 µg/µl. The amine-bearing surfaces APS, PLL and DAB appear to match the DR line in the region 0.10–1.00 µg/µl. None of the remaining surfaces yields spots that conform well to the DR slope.
Figure 6A–C shows that none of the experimental oligonucleotide concentration curves conforms to the slope of the expected DR line. There was little change in signal intensity as a function of concentration of the spotted oligonucleotides.
Spot quality
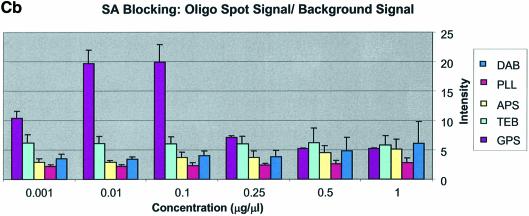
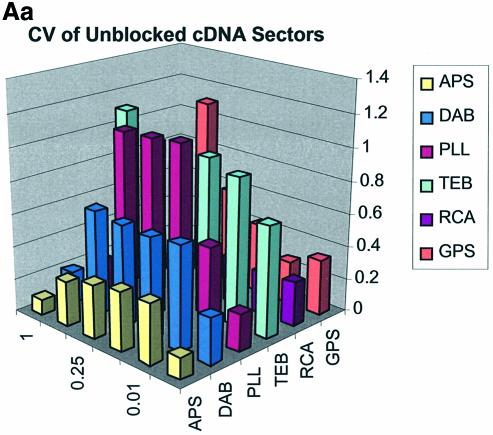
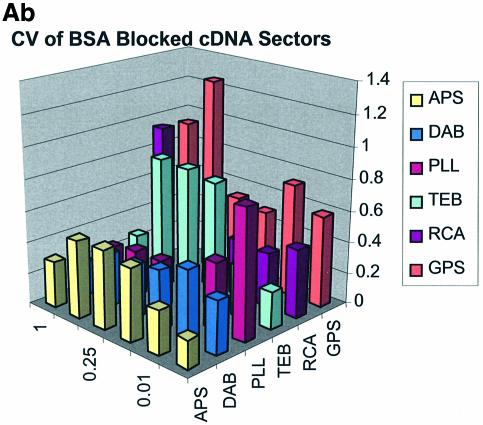
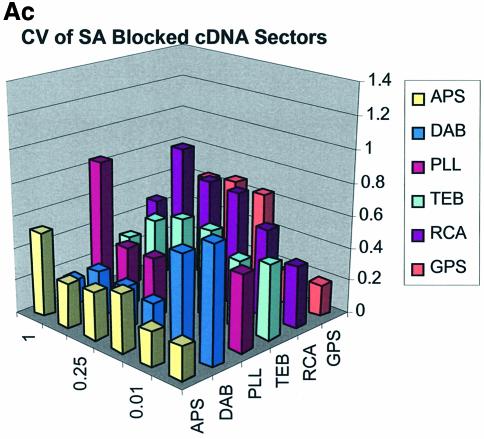
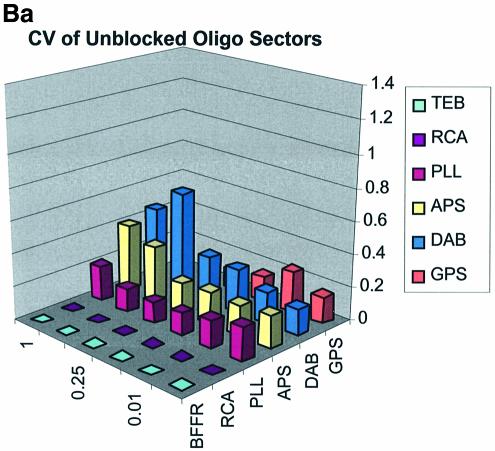
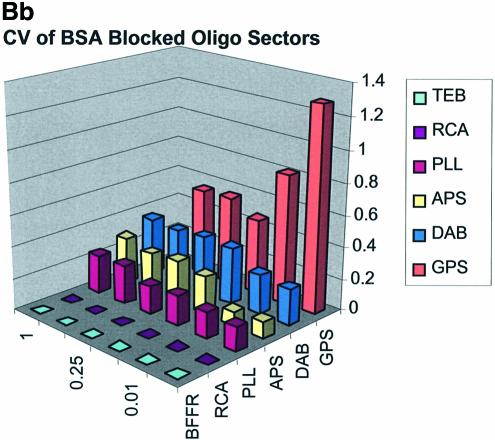
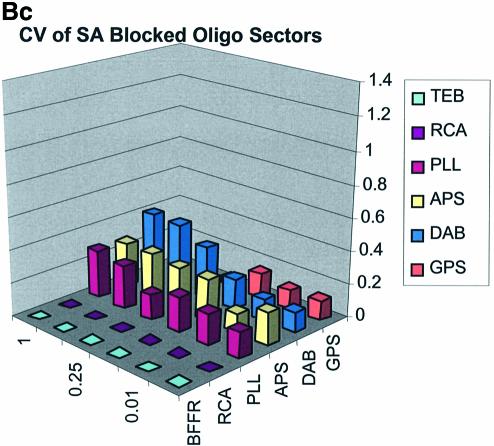
Spot quality is a global assessment that is comprised of parameters represented by spot footprint, circularity, intra-spot uniformity, inter-spot uniformity, signal-to-noise ratio and the coefficient of variation (CV = standard deviation/mean) representing replicate uniformity. In general, circularity is governed by the setup conditions in QuantArray and is generally always close to unity. We focus here on spot footprint (diameter or area) and the CV of the signal intensities as a function of surface and type of DNA: the former because of its relation to contact angle and surface topology and the latter because of its relationship to replicate uniformity. Figure 7A (a, b and c) and B (a, b and c) are plots of the CV for signal intensities obtained over the various surfaces studied and under the three separate blocking conditions. The CV was calculated from the 360 (10 per sector × 3 per microarray × 12 microarrays) replicate spots representing each cDNA concentration and from the 324 (9 per sector × 3 per microarray × 12 microarrays) replicate spots representing each oligonucleotide concentration.
Figure 7.
(A) CV of signal intensity values for cDNA sectors. (a) CV for unblocked slides, (b) CV for BSA-blocked slides, (c) CV for SA-blocked slides. (B) CV of signal intensity values for oligonucleotide sectors. (a) CV for unblocked slides, (b) CV for BSA-blocked slides, (c) CV for SA-blocked slides.
The CV was greater and more variable for cDNA sectors than for oligonucleotide sectors for all surfaces and across all blocking strategies. With few exceptions the CV for oligonucleotides was <0.4 for all surfaces and blocking methods. This means that any given individual spot intensity reading would only be ∼40% of the value of the mean. The modified and RCA surfaces performed similarly in terms of spot quality, while the buffer surface performed poorly. In the latter case the cDNA spots pooled together and formed larger irregular spots on the surface. The oligonucleotide spots completely washed off during blocking. RCA showed good spot quality for cDNA sectors but, like the TEB slides, the oligonucleotide sectors washed off.
Contact angle measurements and AFM
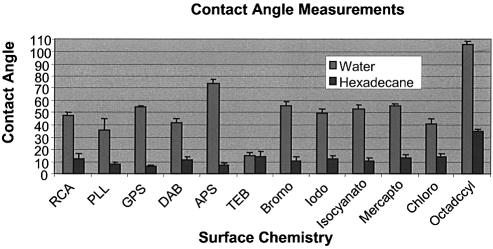
Contact-angle measurements were taken for each surface used in this experiment. Figure 8 shows the bar chart of these measurements taken with water (light gray) and hexadecane (dark gray). The bar chart most notably shows that the RCA-cleaned surface, with a water contact angle of ∼48°, is comparable in hydrophobicity with the functionalized surfaces, while the TEB surface, because of its deliberate salt contamination with TEB, was relatively hydrophilic. Furthermore, the water contact angle at the silane-modified surfaces [GPS (55°) and APS (74°)] are the most hydrophobic followed by PAMAM (40°) and PLL (34°).
Figure 8.
Bar chart showing contact angle measurements for the surfaces chosen for this experiment using ultrapure water (light grey) and hexadecane (dark grey). Note that RCA-cleaned surfaces are comparably hydrophobic compared with the functionalized.
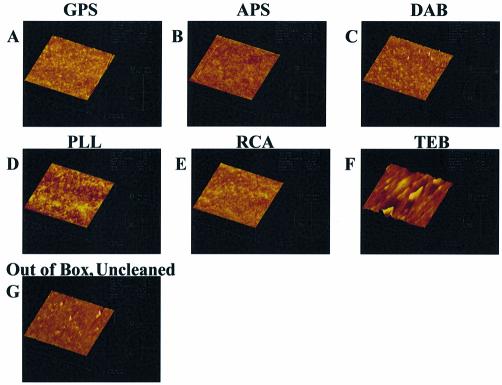
Atomic force micrographs were taken at a 2.0 µm scan size and presented on the 20 nm data scale of each of the surfaces studied and are presented in Figure 9. Uncleaned Gold Seal glass surfaces displayed surface features on the order of 20 nm. Cleaning with the procedures used in this work (solvent and RCA) increases these features to ∼40 nm. These features continue to be visible following surface modification with organo silanes, suggesting that the organo-silane layers are not very thick. These features are not evident on polished Schott D263 borosilicate glass that was evaluated for comparison.
Figure 9.
Atomic force micrographs of chemically modified glass surfaces: (A) GPS, (B) APS, (C) DAB, (D) PLL, (E) RCA, (F) TEB, (G) uncleaned, out of box.
DISCUSSION
Surface chemistry
Surface chemistry does not appear to be a critical factor influencing spot intensity data of cDNA microarrays. Recalling that all cDNA were amine terminated and therefore had the potential for direct chemical coupling to epoxy-modified surfaces, the cDNA sectors displayed similar spot intensities on epoxy-modified slides as were observed on the amine-modified slides, despite the difference in immobilization protocol (covalent versus non-covalent coupling and UV cross-linking versus no UV cross-linking) and variable density of surface amine functionalities. With respect to the cDNA sectors, the main difference in performance among the various surfaces was found in the magnitude of the slide background intensities. Spot intensities were all quite similar in magnitude at each spotting concentration across all the different surface chemistries.
Surface chemistry appears to be more important for oligonucleotide microarrays. Oligonucleotides were not effectively immobilized on unfunctionalized surfaces such as TEB-washed and RCA-cleaned surfaces and resulted in very low spot intensities for both surfaces. Oligonucleotides were likewise not as effectively immobilized on amine surfaces (APS, PLL or DAB) when compared with cDNA on these surfaces and oligonucleotides on the epoxy-modified surface.
Unmodified but cleaned (RCA) glass slides outperformed all other surface chemistries except GPS with respect to its background intensity. As a consequence, the signal (spot/background) from RCA and GPS slides was the highest. Since spots on the RCA-cleaned surface showed good circularity and uniformity (data not shown), had low CV across the several spotting concentrations (Fig. 4Aa–c), had overall low CV scores per concentration and were uniform across their diameter and yielded high signal, we conclude that RCA-cleaned glass slides presented the optimal surface for printing cDNA microarrays. This assertion reflects spot quality parameters but is likewise supported by production cost considerations. Because of the low background intensity and the low variability across the several concentrations, the epoxy-modified surfaces presented the most suitable surfaces for printing of oligonucleotide microarrays.
Background intensities
The background intensity was determined for each spot and was defined within QuantArray as that region outside, but concentric with, the designated circular spot. In this way, background intensity values capture the contributions of gross spot irregularities, spot smearing (comet-tails), the non-specific adsorption of labeled target in the specific region of the spot and any attenuation of the autofluorescence of the glass in that region of the substrate. Amine-modified surfaces yielded greater background fluorescence than epoxy-modified or non-functionalized surfaces. Furthermore, epoxy-modified surfaces had slide background intensities that were unaffected by either SA or BSA blocking. SA blocking negatively impacted background fluorescence and spot quality of all amine-modified surfaces. Conversely, background intensities of amine-modified surfaces that were unblocked and BSA-blocked performed better than corresponding SA-blocked slides. The background intensity of unblocked, amine-modified microarrays was ∼2-fold higher than that of BSA-blocked, amine-modified microarrays. This testifies to the possible value of BSA blocking on amine-modified surfaces. The consequence of this 2-fold difference in background intensity between unblocked (∼2000 counts) and BSA-blocked (∼4000 counts) amine-modified microarrays was not great as the BSA-blocked background was <4000 counts, and typical spot intensities were >20 000 counts. The blocking strategy employed was observed to have the least effect on the non-amine surfaces, epoxy and RCA respectively. This leads to three important observations: (i) blocking is not necessary for amine surfaces but does reduce slide background when the BSA blocking method is used, (ii) blocking on epoxy and RCA slides produced no apparent reduction in background intensity (Fig. 2A–C) and (iii) SA contributes to high background intensities, particularly when high concentrations of DNA are spotted.
In summary, blocking with SA resulted in the overall highest background intensity in the cDNA and oligonucleotide sectors. BSA-blocked and unblocked microarrays performed comparably, with BSA-blocked microarrays yielding about one-half the signal intensity as the unblocked group for the amine-modified surfaces. The non-amine surfaces were the least affected by blocking method showing relatively constant background intensity regardless of blocking method used.
Signal intensities
In this work, signal intensities were computed as the ratio of spot intensity to slide background intensity. One anomalous feature that negatively impacts background and spot quality is the presence of comet tails, tapering streaks of hybridized DNA originating from microarray spots. Various research groups have noted comet tails and their impact on signal intensity (22,23, Oregon State Microarray Laboratory: http://www.cgrb.orst.edu/CSL/custom.pdf). These and other groups have asserted numerous explanations for the presence of comet tails, e.g. (i) shaking in the blocking solution should be more vigorous, (ii) the spotting concentrations were too high and (iii) there was rough application of the cover slip prior to hybridization. In our experiments, only spots that ranged from 250 ng/µl to 1 µg/µl exhibited the comet tails. This supports the notion that this feature arises from excessive spotting concentration. However, this feature developed in conjunction with our use of an automated hybridization station, eliminating the need for cover slips and thus suggesting that cover slip application is not a particular cause. Moreover, comet tails were found principally on microarrays that were blocked with SA suggesting that the choice of blocking agent is an important contributor to the development of this feature. The finding that raw intensity values for cDNA sectors were not surface chemistry dependent implies that all surfaces capture the cDNA with similar efficacy. The principal difference is in the amount of background fluorescence emitted by the various surfaces.
Spotting concentration
Variations in the spotting concentration were aimed at identifying the most suitable concentration for spotting of oligonucleotides and cDNA under the aggregate conditions of surface chemistry, blocking chemistry and method of fixation used in this work. The slope of the signal versus concentration plots is an indication of the dynamic range of the analytical method. On each plot (Figs 5A–C and 6A–C) is shown the expected dynamic range curve. For the cDNA sectors of the microarrays good agreement was found only between 0.01 and 0.1 µg/µl on the BSA-blocked slides. The SA-blocked microarrays did not produce agreement over any concentration range. When unblocked, the cDNA sectors of the microarrays showed good agreement with the DR line only on the GPS surfaces. The GPS surface likewise was the only surface under BSA-blocked conditions to have good DR slope matching between 0.01 and 0.5 µg/µl. All remaining signal intensities plateau between 0.25 and 0.5 µg/µl. We conclude that when spotting cDNA the optimal spotting concentration is between 0.1 and 0.5 µg/µl. The oligonucleotide sectors of the microarrays showed very poor agreement with the DR line as these were essentially flat as a function of concentration. This we believe is the result of the washing away of excess oligonucleotides from the surface during hybridization leaving behind a finite adsorbed layer, the thickness of which is only modestly influenced by surface chemistry but is dramatically influenced by fixing method. Hence the GPS surface displays a larger signal when compared with the amine-modified surfaces (APS, PLL and DAB).
Spot quality and reproducibility
The coefficient of variation was greatest among cDNA sectors of the DNA microarrays. The differences in magnitude of the CV between cDNA and oligonucleotide sectors is likely due to the inherent variability in the fixing methods that dominate immobilization of these two types of DNA to surfaces. The UV cross-linking reaction that dominates the fixing of cDNA promotes inter- and intra-chain cross links that are formed in the solid state. This is likely a highly variable and poorly controlled reaction and so will give rise to considerable variability from spot to spot. There appears to be no systematic difference in this variability among spots of different cDNA concentration, reinforcing the view that the variability is not linked to the amount of cDNA deposited and is likely derived from an extrinsic factor such as UV crosslinking. Oligonucleotide sectors show considerably less variability. This is likely due to the fact that a finite layer of adsorbed oligonucleotides dominates the spot signal regardless of the surface chemistry or concentration applied. Even when covalently immobilized on GPS and displaying a larger signal relative to other surfaces, the variability is still quite low. The blocking with BSA creates the signal deviation in this case and produces increased variability among oligonucleotide spots, especially on GPS-modified surfaces. The source of the variation was investigated by plotting the signal averages of each sub-array, combined sub-arrays for a given slide, and all sub-arrays on all slides. It was noted that the variability remained essentially constant and was not simply a function of the differences between individual spots, spots in sub-arrays or groups of slides, rather it seemed to be intrinsic.
cDNA versus oligonucleotides
Overall, cDNA sectors yielded higher raw spot intensity values (Fig. 4A) and higher signals (Fig. 5A–C) than oligonucleotide sectors when spotted at the same concentration. Also, cDNA displayed higher spot signal variability when compared with oligonucleotides. When studied over the various surfaces, the raw spot intensities of cDNA spots were more tightly distributed than those of oligonucleotides. That is, for cDNA, the surface chemistry had less impact on the magnitude of the spot intensity. Again, this reflects the greater importance of UV crosslinking as a fixative over chemisorption as the immobilization principle.
Oligonucleotides showed the highest raw spot intensity, lowest background intensity and consequently the highest signal on GPS surfaces. The optimal spotting concentration was found to be 0.1 µg/µl (∼10 µM for a 30mer and ∼5 µM for a 60mer). Similarly, cDNA showed the highest raw spot intensity on DAB- and PLL-modified surfaces reflecting strong interaction with amine-modified surfaces. This is particularly evident at low spotting concentrations. However, among the chemically modified surfaces, GPS gave the lowest background, regardless of the blocking method used. Because of this low background, GPS-modified surfaces resulted in superior signal intensities for cDNA, being better than either DAB- or PLL-modified surfaces. This does not appear to be the contribution of covalent coupling of the 5′-amine-terminated cDNA to the GPS surface.
The differences between oligonucleotide and cDNA intensity values for the same surface chemistry were greater over all surfaces (∼4–8-fold) except for GPS, where the difference was ∼2-fold at 0.1 µg/µl. This is likely due to the difference in immobilization chemistry, recalling that all surfaces except GPS were cross-linked with 90 mJ/cm2 of UV. However, cDNA spotted on epoxy surfaces was similar in intensity to cDNA printed on the amine surfaces suggesting that UV crosslinking and epoxy–amine coupling immobilize a similar amount of cDNA.
UV crosslinking
On all amine-modified surfaces, intensity values for oligonucleotide sectors were consistently ≥4-fold than the intensity from corresponding cDNA sectors. For instance, at 0.1 µg/µl, oligonucleotide sectors on PLL-modified surfaces showed ∼4-fold less intensity than cDNA sectors. On APS-modified surfaces this was ∼5-fold less and on DAB-modified surfaces this was ∼8-fold less intensity. This trend was similar across all concentrations of DNA. Spotting on the amine surfaces was followed by UV crosslinking and baking. However, the GPS surfaces did not undergo this fixation protocol. Spotted GPS slides were incubated at 42°C for 8 h to promote amine-to-epoxide coupling reaction and subsequently washed. The cDNA sectors from these slides were also brighter, but by only ∼2-fold. This seems to indicate that UV irradiation effects the fixing of cDNA differently than it does oligonucleotides.
This explanation, however, does not fully account for the magnitude of intensity difference observed between the amine versus the epoxy surfaces. It should be noted that the cDNA was ∼600 bp in length, while the oligonucleotides were only 30 bases in length. It follows that there were fewer strands of cDNA per unit volume than oligonucleotides, yet the intensity was as much as 8-fold greater from cDNA sectors. Theoretically, cDNA 600 bp in length can bind more than one strand of labeled PCR product. Although our control for non-specific DNA interaction (non-homologous genomic DNA) showed little to no intensity, non-specific interaction could have possibly added somewhat to the spot intensity. In addition, the intensity disparity between oligonucleotides and cDNA could be a consequence of a lower hybridization sensitivity of 30mer oligonucleotides compared with 600 bp cDNA when labeled PCR product is used as the hybridization target.
The potential for covalent coupling of the amine-terminated primer-derived PCR product to GPS surfaces did not influence the performance of cDNA. UV cross-linking was a more significant fixative then covalent coupling for cDNA. It is noteworthy that UV-treated slides all displayed higher background intensities relative to the un-irradiated slides, which had low background intensities (GPS). UV irradiation is well known to bring up color centers within glass (24). This enhances autofluorescence of the substrate, increasing its background intensity.
GPS surfaces offer the greatest versatility for DNA immobilization. These surfaces offer high signal values with amine-terminated oligonucleotides and confer superior signal to cDNA. In the former case this advantage arises when covalent coupling of the oligonucleotide to the surface is promoted with the use of amine-functionalized oligonucleotides. In the latter case, this advantage arises because of the generally lower background intensity of the substrate as UV crosslinking is rendered unnecessary and so exposure to UV does not bring up the autofluorescence centers within the glass. Blocking as an approach to reduce non-specific adsorption of labeled target is not required or necessary. Where blocking must be pursued, BSA confers the lowest background intensity values and represents some modest improvement of the unblocked condition. SA provokes comet tail formation, particularly at higher spotting concentrations, and should be avoided. The most appropriate spotting concentration on GPS surfaces was found to be 0.1 µg/µl (10 µmol) for oligonucleotides and between 0.01 and 0.1 µg/µl for cDNA.
Acknowledgments
ACKNOWLEDGEMENTS
The authors wish to thank the VCU Center for Bioelectronics, Biosensors and Biochips (C3B), the Virginia Center for Innovative Technology (CIT BIO-99-010) and the Commonwealth of Virginia VA Commonwealth Technology Research Fund for Cancer Genomics and Development of Diagnostic Tools and Therapies (grant no. SE2002-02).
REFERENCES
- 1.Blohm D.H. and Guiseppi-Elie,A. (2001) New developments in microarray technology. Curr. Opin. Biotech., 12, 41–47. [DOI] [PubMed] [Google Scholar]
- 2.Kane M.D., Jatkoe,T.A., Stumpf,C.R., Lu,J., Thomas,J.D. and Madore,S.J. (2000) Assessment of the sensitivity and specificity of oligonucleotide (50mer) microarrays. Nucleic Acids Res., 28, 4552–4557. [DOI] [PMC free article] [PubMed] [Google Scholar]
- 3.Hegde P., Qi,R., Abernathy,K., Gay,C., Dharap,S., Gaspard,R., Hughes,J.E., Snesrud,E., Lee,N. and Quackenbush,J. (2000) A concise guide to cDNA microarray analysis. Biotechniques, 29, 548–550. [DOI] [PubMed] [Google Scholar]
- 4.Rickman D., Bobek,M,. Misek,D., Kuick,R., Blaivas,M., Kurnit,D., Taylor,J. and Hanash,S. (2001) Distinctive molecular profiles of high-grade and low-grade gliomas based on oligonucleotide micorarray analysis. Cancer Res., 61, 6885–6891. [PubMed] [Google Scholar]
- 5.Lindroos K., Liljedahl,U., Raitio,M. and Syvanen,A. (2001) Minisequencing on oligonucleotide microarrays: comparison of immobilization chemistries. Nucleic Acids Res., 29, e69. [DOI] [PMC free article] [PubMed] [Google Scholar]
- 6.Benters R., Niemeyer,C.M., Drutschmann,D., Blohm,D. and Wohrle,D. (2002) DNA microarrays with PAMAM dendritic linker systems. Nucleic Acids Res., 30, e10. [DOI] [PMC free article] [PubMed] [Google Scholar]
- 7.Zammatteo N., Jeanmart,L., Hamels,S., Courtois,S., Louette,P., Hevesi,L. and Remacle,J. (2000) Comparison between different strategies of covalent attachment of DNA to glass surfaces to build DNA microarrays. Anal. Biochem., 280, 143–150. [DOI] [PubMed] [Google Scholar]
- 8.Dolan P., Wu,W., Ista,L., Metzenberg,R., Nelson,M. and Lopez,G. (2001) Robust and efficient synthetic method for forming DNA microarrays. Nucleic Acids Res., 29, e10. [DOI] [PMC free article] [PubMed] [Google Scholar]
- 9.Call D., Chandler,D. and Brockman,F. (2001) Fabrication of DNA micorarrays using unmodified oligonucleotide probes. Biotechniques, 30, 368–379. [DOI] [PubMed] [Google Scholar]
- 10.Brazma A., Hingamp,P., Quackenbush,J., Sherlock,G., Spellman,P., Stoeckert,C., Aach,J., Ansorge,W., Ball,C.A., Causton,H.C., Gaasterland,T., Glenisson,P., Holstege,F.C., Kim,I.F., Markowitz,V., Matese,J.C., Parkinson,H., Robinson,A., Sarkans,U., Schulze-Kremer,S., Stewart,J., Taylor,R., Vilo,J. and Vingron,M. (2001) Minimum information about a microarray experiment (MIAME)-toward standards for microarray data. Nature Genet., 29, 365–371. [DOI] [PubMed] [Google Scholar]
- 11.Wolfinger D.R., Gibson,G., Wolfinger,D.E., Bennett,L., Hamadeh,H., Bushel,P., Afshari,C. and Paules,S.R. ( 2001) Assessing gene significance from cDNA microarray expression data via mixed models. J. Comp. Biol., 8, 625–637. [DOI] [PubMed] [Google Scholar]
- 12.Diehl F., Grahlmann,S., Beier,M. and Hoheisel,J.D. (2001) Manufacturing DNA microarrays of high spot homogeneity and reduced background signal. Nucleic Acids Res., 29, e38. [DOI] [PMC free article] [PubMed] [Google Scholar]
- 13.Wang X., Ghosh,S. and Guo,S.W. (2001) Quantitative quality control in microarray image processing and data acquisition. Nucleic Acids Res., 29, e75. [DOI] [PMC free article] [PubMed] [Google Scholar]
- 14.Schena M., Shalon,D., Davis,R.W. and Brown,P.O. (1995) Quantitative monitoring of gene expression patters with a complementary DNA microarray. Science, 270, 467–470. [DOI] [PubMed] [Google Scholar]
- 15.Sorribas H., Braun,D., Leder,L., Sonderegger,P. and Tiefenauer,L. (2001) Adhesion proteins for a tight neuron-electrode contact. J. Neurosci. Meth., 104, 133–141. [DOI] [PubMed] [Google Scholar]
- 16.Ho M. (1993) Characterization of the structure and bonding of adsorbates on model silica surfaces. PhD Thesis, Pennsylvania State University.
- 17.Guiseppi-Elie A., Wilson,A.M., Tour,J.M., Brockmann,T.W., Zhang,P. and Allara,D.L. (1995) Specific immobilization of electropolymerized polypyrrole thin films onto interdigitated microsensor array electrodes. Langmuir, 11, 1745–1768. [Google Scholar]
- 18.Kim H.J., Moon,J.H. and Park,J.W. (2000) A hyperbranched poly(ethyleneimine) grown on surfaces. Journal Colloid. Interface Science, 227, 247–249. [DOI] [PubMed] [Google Scholar]
- 19.Gheorghe M. and Guiseppi-Elie,A. (2003) Electrical frequency dependent characterization of DNA hybridization. Biosensors Bioelectronics, in press. [DOI] [PubMed] [Google Scholar]
- 20.Liau L., Lallone,R., Seitz,R., Buznikov,A., Gregg,J., Kornblum,H., Nelson,S. and Bronstein,J. (2000) Identification of human glioma-associated growth factor gene, granulin, using differential immuno-absorption. Cancer Res., 60, 1353–1360. [PubMed] [Google Scholar]
- 21.Lamture B., Beattiek,K., Burke,B., Eggers,M., Ehrlich,D., Fowler,R., Hollis,M., Kosicki,B., Reich,R. and Smith,S. (1994) Direct detection of nucleic acid hybridization on the surface of a charge coupled device. Nucleic Acids Res., 22, 4710–4714. [DOI] [PMC free article] [PubMed] [Google Scholar]
- 22.Yang Y.H., Buckley,M., Dudoit,S. and Speed,T. (2000) Comparison of methods for image analysis on cDNA microarray data. Technical Report 584. http://stat-www.berkeley.edu/users/terry/zarray/Html/image.html. [Google Scholar]
- 23.Latto D. and Boucher,C. (2000) Microarray Gene Expression Profiling: The Basics. BioNote MG002 v1.0. BioRobotics Inc., Woburn, MA, USA. pp. 24. http://www.biorobotics.com/Users/downloads/BioNoteMG002_V1.0.pdf. [Google Scholar]
- 24.Exarhos G.J. (1984) Vibrational raman studies of particle induced damage in oxide glasses. Nuclear Instruments Meth. Phys. Res., 1, 498–502. [Google Scholar]


