Abstract
Acyl-CoA:glycerol-3-phosphate acyltransferase (GPAT) catalyzes the first step during de novo synthesis of triacylglycerol. It has been well recognized that mammals possess multiple enzymatically distinct proteins with GPAT activity. Although the mitochondrial-associated GPAT has been cloned and extensively characterized, the molecular identity of the endoplasmic reticulum (ER)-associated GPAT, which accounts for the majority of total GPAT activity in most tissues, has remained elusive. Here we report the identification of genes encoding human and mouse ER-associated GPAT (termed GPAT3). GPAT3 is a member of the acyltransferase family predominantly expressed in tissues characterized by active lipid metabolism, such as adipose tissue, small intestine, kidney, and heart. Ectopic expression of GPAT3 leads to a significant increase in N-ethylmaleimide-sensitive GPAT activity, whereas acyltransferase activity toward a variety of other lysophospholipids, as well as neutral lipid substrates, is not altered. Overexpression of GPAT3 in mammalian cells results in increased triacylglycerol, but not phospholipid, formation. GPAT3 is localized to the ER when overexpressed in COS-7 cells. GPAT3 mRNA is dramatically up-regulated during adipocyte differentiation, is reciprocally regulated in adipose tissue and liver of ob/ob mice, and is up-regulated in mice treated with a peroxisome proliferator-activated receptor γ (PPARγ) agonist. A substantial loss of GPAT activity in 3T3-L1 adipocytes was achieved by reducing GPAT3 mRNA levels through GPAT3-specific siRNA knockdown. These findings identify GPAT3 as a previously uncharacterized triacylglycerol biosynthetic enzyme. Similar to other lipogenic enzymes, GPAT3 may be useful as a target for the treatment of obesity.
Keywords: bioinformatics, endoplasmic reticulum, lysophosphatidic acid, regulation
Synthesis of triacylglycerol (TAG) is a fundamental metabolic pathway important for energy storage and utilization, nutrient absorption, lactation, and phospholipid metabolism (1–4). In mammals, there are two main biochemical pathways for TAG biosynthesis: the monoacylglycerol (MAG) pathway, which plays an important role in nutrient absorption in the small intestine, and the glycerol-3-phosphate (G3P) pathway, which is responsible for the majority of de novo TAG synthesis. Acyl-CoA:glycerol-3-phosphate acyltransferase (GPAT, EC 2.3.1.15) catalyzes the initial step of de novo TAG synthesis by converting G3P to lysophosphatidic acid (LPA). LPA is then acylated to form phosphatidic acid, followed by dephosphorylation to diacylglycerol (DAG). The MAG and the G3P pathways share a common last step, the conversion of DAG to TAG, catalyzed by acyl-CoA:DAG acyltransferase (DGAT).
In mammals, GPAT activity exists in multiple isoforms, which can be distinguished by subcellular localization (mitochondrial vs. microsomal), sensitivity to N-ethylmaleimide (NEM), and substrate preference (1, 2, 5). The gene encoding the mammalian mitochondrial NEM-resistant GPAT1 (mtGPAT1, GPAM) was identified a decade ago and was shown to play a key role in liver TAG synthesis (6–8). Although initial reports suggested that mtGPAT1-deficient mice have decreased adipose tissue mass (6), more recent studies found little effect of mtGPAT1 deficiency on the development of obesity (7). It is likely that GPAT isoforms other than mtGPAT1 contribute to lipogenesis in adipose tissue.
The mammalian NEM-sensitive microsomal GPAT activity was demonstrated to account for 80–90% of total GPAT activity in most tissues and 50–80% of total activity in liver (1). In contrast to a relatively modest increase in mitochondrial GPAT activity, microsomal GPAT activity is dramatically induced during adipocyte differentiation (8, 9). Although considerable attempts have been made to purify microsomal GPAT from various species (10–13), the gene(s) encoding NEM-sensitive GPAT activity in mammalian tissues have not yet been identified.
Here, we report the identification of human and mouse genes encoding microsomal proteins with GPAT activity. We demonstrate that overexpression of these genes confers NEM-sensitive GPAT activity and increases TAG formation. We also show that these genes are expressed and regulated in a manner suggesting an important role in lipogenesis, and that the mouse gene encodes a significant portion of GPAT activity in 3T3-L1 adipocytes. Our findings open the door to in vivo studies addressing the role of microsomal GPAT in normal physiology and in pathological disease states.
Results
Identification of Candidate Genes for Microsomal GPAT.
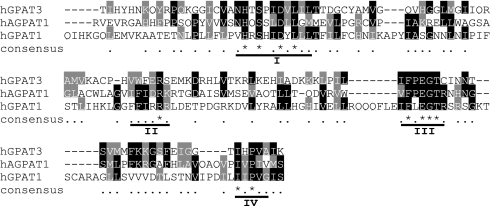
To identify genes that might encode microsomal GPAT activity, we used the following criteria: (i) the gene should be a member of the acyltransferase family, (ii) the mRNA should be abundantly expressed in tissues where glycerolipids are actively metabolized, (iii) the mRNA should be up-regulated during 3T3-L1 adipocyte differentiation (8, 9), and (iv) the calculated molecular mass might be ≈45 kDa (13). Using a seed-alignment sequence derived from the previously described glycerolipid acyltransferase motif (PF01553) (1), we performed a sequence homology search of public databases, which generated an acyltransferase data set. In parallel, we used transcriptional profiling to identify genes up-regulated during 3T3-L1 adipocyte differentiation and highly expressed in adipose tissue. Comparison of the two data sets identified a previously uncharacterized mouse gene (GenBank accession no. NM_172715), fulfilling all four criteria listed above. A closely related human gene, MGC11324 (GenBank accession no. NM_032717), was also identified. These genes are designated in the present study as mouse GPAT3 and human GPAT3 (mGPAT3 and hGPAT3).§ The mouse and human genes encode 438- and 434-aa proteins, respectively, sharing 95% identity [supporting information (SI) Fig. 8]. Both proteins are predicted to be integral membrane proteins with at least two transmembrane domains (Fig. 8) and contain all four conserved acyltransferase motifs within a 133-aa domain as revealed by comparison with mtGPAT1 and acyl-CoA-acyl-glycerol-3-phosphate acyltransferase 1 (AGPAT1) (Fig. 1). Despite the presence of the acyltransferase motifs, hGPAT3 and mGPAT3 have <15% sequence identity with mtGPAT1 and previously identified yeast and plant GPATs (14, 15) (data not shown).
Fig. 1.
Sequence alignment of predicted acyltransferase domains of hGPAT3 (amino acids 209–332), human AGPAT1 (amino acids 83–211), and human mtGPAT1 (hGPAT1, amino acids 205–355). Underlined are four motifs (I–IV) characteristics of glycerophospholipid acyltransferases.
Demonstration of GPAT Activity.
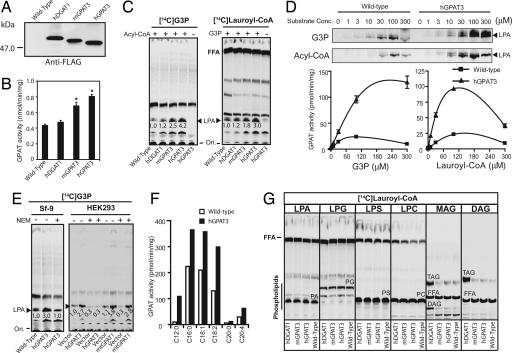
To determine whether the newly identified genes encode proteins with GPAT activity, we overexpressed native and N-terminally Flag-tagged mGPAT3 and hGPAT3 in Sf-9 cells. Western blot analysis using anti-FLAG antibody confirmed expression and showed an apparent molecular mass of ≈50 kDa for both proteins, consistent with the predicted molecular masses of 49.9 and 49.5 kDa (Fig. 2A). GPAT activity was initially assessed in cell lysates by using a conventional extraction method that measures incorporation of [3H]G3P into butanol-extractable products (8, 16). We initially used Lauroyl-CoA as an acyl donor, because recombinant mtGPAT1 showed a preference for Lauroyl-CoA over longer acyl-CoA species (data not shown). Lysates from Sf-9 cells overexpressing mGPAT3 or hGPAT3 showed a significant increase in the formation of butanol-extractable radiolabeled lipids, compared with wild-type cells or cells overexpressing human DGAT1 (Fig. 2B). To directly demonstrate formation of LPA, the product of the GPAT reaction, we separated lipids by thin-layer chromatography (TLC). Using [14C]G3P as the radiolabeled substrate, formation of LPA was enhanced 2.5- and 4.2-fold in lysates from cells overexpressing mGPAT3 and hGPAT3 (Fig. 2C Left). Similarly, using [14C]Lauroyl-CoA as radiolabeled substrate, formation of LPA was increased 1.8- and 3.0-fold, respectively (Fig. 2C Right). No LPA formation was observed in samples lacking either one of the substrates (“-Acyl-CoA” and “-G3P” lanes, Fig. 2C). TLC separation also showed the presence of several non-LPA lipids derived from either [14C]G3P or [14C]Lauroyl-CoA (e.g., upper bands in Fig. 2C), which may represent products of endogenous enzymes in insect cells. The presence of these non-LPA lipids in the butanol extract likely accounts for the higher background and decreased sensitivity of this method. Thus, GPAT activity was assessed by TLC separation in all subsequent experiments. Formation of LPA increased in a substrate concentration-dependent manner for both [14C]G3P and Lauroyl-CoA and was significantly higher in hGPAT3-expressing cells compared with controls at all concentrations tested (Fig. 2D). hGPAT3-dependent LPA formation decreased at very high concentrations of acyl-CoA (Fig. 2D), similar to what has been reported for mtGPAT1 (8). The maximal hGPAT3-dependent increase in LPA formation corresponded to ≈100 pmol/min per mg protein with half-maximal activity reached at ≈25 μM Lauroyl-CoA and ≈80 μM G3P (Fig. 2D). It is important to note that our assay was performed by using a nonpurified system; variations in activity and fold increase (2.5- to 10-fold; average 6-fold) among experiments likely reflect differences in expression levels among different preparations. We also overexpressed hGPAT3 in HEK293 cells and saw a similar, although on average less-pronounced, increase in LPA formation compared with control cells (≈3-fold increase; ≈100 pmol/min per mg) (Fig. 2E Right). Importantly, the fold increase observed upon GPAT3 overexpression was comparable to the one observed with mtGPAT1 (2.7- vs. 3.8-fold; Fig. 2E Right).
Fig. 2.
Enzymatic activity of GPAT3. Lysates from uninfected insect cells (wild type) or insect cells infected with virus expressing N-terminally FLAG-tagged human DGAT1 (hDGAT1) or native or N-terminally FLAG-tagged hGPAT3 and mGPAT3 were analyzed. In some experiments (E Right), lysates from mammalian HEK293 cells transfected with empty vector (vector) or hGPAT3- or mtGPAT1-containing vector were analyzed. (A) Western blot using anti-Flag antibody. (B) GPAT activity analyzed by butanol-extraction method (mean ± SD, n = 3). ∗, P < 0.05 compared with wild type or hDGAT1. (C) GPAT activity analyzed by TLC using either [14C]glycerol-3-phosphate (G3P, Left) or [14C]Lauroyl-CoA (Right) as radiolabeled substrates. The embedded numbers represent the relative levels of formed radiolabeled LPA (indicated by ▴). Ori, origin of migration; FFA, free fatty acid. The fast-migrating band next to LPA (C Left) may represent a G3P-dependent but acyl-CoA-independent product by endogenous enzyme(s), possibly phosphatidylglycerol phosphate or phosphatidylglycerol. Similar results were obtained in more than three independent experiments. (D) Substrate concentration dependence of GPAT activity. Assays were conducted by using Sf-9 lysates with the indicated concentrations of [14C]G3P or Lauroyl-CoA in the presence of 100 μM Lauroyl-CoA or [14C]G3P, respectively. Representative TLC images indicating the formation of LPA are shown on top; specific GPAT activities are shown below (mean ± SD, n = 3–4). (E) GPAT activity conferred by GPAT3, but not mtGPAT1, is sensitive to NEM. Enzymatic activity was analyzed in both Sf-9 cells (Left) and mammalian HEK293 cells (Right). (F) GPAT activity using different acyl-CoA species as substrates. Data represent the average of two independent experiments; variation between experiments was <15%. (G) Activity of GPAT3 toward different acyl acceptors. PA, phosphatidic acid; PG, phosphatidylglycerol; PS, phosphatidylserine; PC, phosphatidylcholine. Data are representative of two independent experiments with similar results.
Microsomal GPAT activity has been shown to be sensitive to NEM (1). Pretreatment of either Sf-9 or HEK293 lysates with NEM completely abolished the increase in LPA formation conferred by hGPAT3 overexpression (Fig. 2E), whereas mtGPAT1-dependent LPA formation was not affected by NEM (Fig. 2E Right). Sequence alignment of GPAT3 orthologs from different species revealed several conserved cysteine residues not shared by mtGPAT1 that may account for the NEM sensitivity of GPAT3 (data not shown). In addition to Lauroyl-CoA, GPAT3 also recognizes a broad range of long-chain fatty acyl-CoA, including both saturated and unsaturated species, as acyltransferase donors, as evidenced by an hGPAT3-dependent increase in LPA formation (Fig. 2F). Importantly, acyltransferase activity conferred by GPAT3 overexpression is specific toward G3P, because no significant increase in product formation was observed when LPA, lysophosphatidylcholine, lysophosphatidylserine, lysophosphatidylglycerol, MAG, or DAG were presented as substrates (Fig. 2G).
Ectopic Expression of GPAT3 Increases TAG, but Not Phospholipid, Formation in Mammalian Cells.
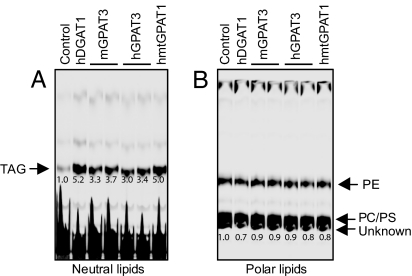
To further investigate the role of GPAT3 in TAG and/or phospholipid synthesis, we measured the incorporation of [14C]oleic acid into lipids in intact HEK 293 cells overexpressing mGPAT3 or hGPAT3 (Fig. 3). Formation of labeled TAG was significantly (≈3- to 4-fold) increased in GPAT3 overexpressing cells compared with control cells (Fig. 3A), whereas no increase in phospholipid formation was observed (Fig. 3B). Overexpression of GFP or other proteins such as adiponutrin did not increase TAG synthesis under the same experimental conditions (data not shown). The increase in TAG formation upon GPAT3 overexpression was similar in magnitude to the increase observed upon overexpression of DGAT1 or mtGPAT1 (Fig. 3A). These data indicate that GPAT3 functions in the TAG biosynthetic pathway.
Fig. 3.
Overexpression of GPAT3 in mammalian cells led to increased incorporation of oleic acid into TAG but not phospholipids. Metabolic labeling studies were performed in HEK293 cells overexpressing hGPAT3 and mGPAT3, human DGAT1, or human mtGPAT1 (hmtGPAT1) as described in Materials and Methods. (A) TLC analysis of neutral lipids. (B) TLC analysis of polar lipids. The number below each band represents relative level to that of the control, which was arbitrarily assigned as 1. Data are representative of two independent experiments with similar results. PE, phosphatidylethanolamine; PS, phosphatidylserine; PC, phosphatidylcholine.
GPAT3 Is Localized to the Endoplasmic Reticulum (ER).
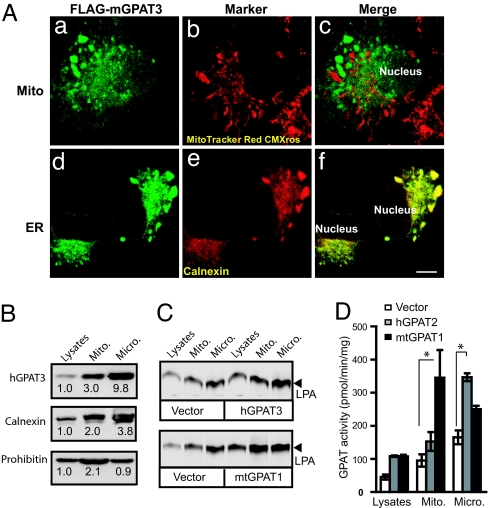
To examine the subcellular localization of GPAT3, we overexpressed Flag-tagged mGPAT3 in COS-7 cells. By immunofluorescence, mGPAT3 displayed a perinuclear staining pattern (Fig. 4A a and d) that was distinct from the staining of a mitochondrial marker (MitoTracker Red CMXRos) but colocalized well with an ER marker (Calnexin) (Fig. 4A). Although the calnexin/GPAT3 staining was reticular in some cells, the cells exhibiting the brightest GPAT3 staining showed the presence of Calnexin/GPAT3-labeled cisternae, possibly reflecting an effect of GPAT3 overexpression on ER morphology. Similar results were achieved with hGPAT3 (data not shown). To further investigate the subcellular localization of GPAT3, we generated subcellular fractions enriched for mitochondria and microsomes using differential sedimentation of HEK293 cell membranes overexpressing FLAG-tagged hGPAT3 or untagged mtGPAT1. Western blotting showed enrichment of the mitochondrial marker prohibitin in the mitochondrial fraction, whereas the ER marker Calnexin was enriched in the microsomal fraction (Fig. 4B). FLAG-tagged hGPAT3 showed a fractionation pattern similar to Calnexin (Fig. 4B), consistent with ER localization. The increase in GPAT activity in lysates from hGPAT3 and mtGPAT1 overexpressing cells was similar (≈2-fold compared with control, Fig. 4 C and D). mtGPAT1-overexpressing cells showed the largest increase in activity in the mitochondrial fraction, whereas GPAT activity was increased primarily in the microsomal fraction in hGPAT3 overexpressing cells (Fig. 2 C and D). These findings are consistent with GPAT3 being an ER-localized enzyme.
Fig. 4.
GPAT3 is localized to ER but not mitochondria. (A) Immunofluorescent staining of COS-7 cells overexpressing Flag-tagged mGPAT3. GPAT3 is visualized by indirect immunofluorescence with anti-FLAG antibody (a and d), mitochondria and ER are visualized by staining with MitoTracker Red CMXRos (b) and antibody specific for Calnexin (e), respectively. c and f represent merged pictures of a with b and d with e, respectively. (Scale bar, 10 μm.) (B) Western blot analysis of subcellular fractions from HEK293 cells overexpressing FLAG-hGPAT3. The number below each band represents relative level to that of the lysates, which was arbitrarily assigned as 1. (C) TLC analysis of GPAT activity in subcellular fractions of HEK293 cells overexpressing FLAG-GPAT3 or mtGPAT1. (D) Quantitative analysis of GPAT activity (mean ± SD, n = 3–4). ∗, P < 0.05.
Tissue Distribution of GPAT3 mRNA in Mouse and Human.
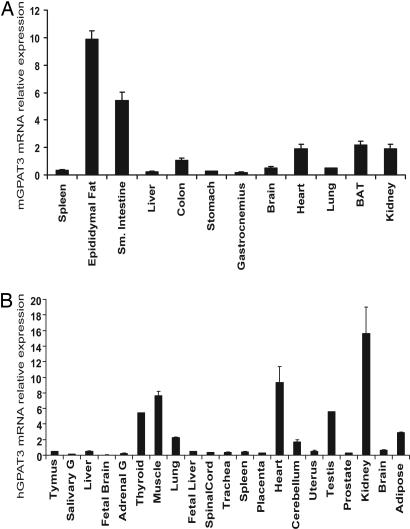
As detected by Taqman real-time RT-PCR, mGPAT3 mRNA was most abundant in epididymal fat, followed by small intestine, brown adipose tissue, kidney, heart, and colon within the tissues included in this study (Fig. 5A). In humans, GPAT3 mRNA was most highly expressed in kidney, heart, skeletal muscle, thyroid gland, and testis. Significant levels were also found in lung and adipose tissue (Fig. 5B). No major alternative splice variants of mGPAT3 and hGPAT3 genes were found by database searching or Northern blot analysis (data not shown). Interestingly, the level of GPAT3 mRNA in both mouse and human liver was low, possibly suggesting the existence of additional genes that encode liver microsomal GPAT activity. With the exception of small intestine, liver, and lung, mGPAT3 shows a tissue distribution similar to mouse mtGPAT1, whereas human mtGPAT1 is strikingly abundant in adipose tissue (SI Fig. 9).
Fig. 5.
Tissue distribution of mouse (A) and human (B) GPAT3 mRNA detected by Q-PCR. Data are expressed as mean ± SD (n = 4).
GPAT3 Accounts for a Significant Portion of GPAT Activity in 3T3-L1 Adipocytes.
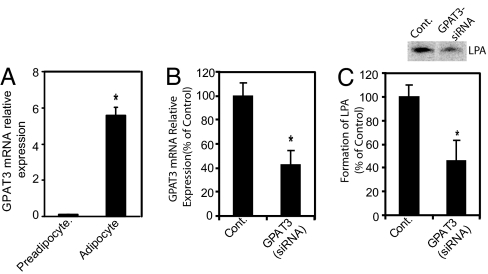
Microsomal GPAT activity is known to be significantly (≈70-fold) increased during differentiation of 3T3-L1 preadipocytes to adipocytes (8, 9). We found that GPAT3 mRNA was increased ≈60-fold in 3T3-L1 adipocytes compared with preadipocytes (Fig. 6A), concomitant with a similar increase in GPAT activity (data not shown). Depletion of mGPAT3 in differentiated 3T3-L1 adipocytes using RNAi oligonucleotides resulted in a decrease in mGPAT3 mRNA by ≈60% (Fig. 6B) and a concomitant decrease in GPAT activity by ≈55% (Fig. 6C), compared with cells transfected with nontargeting control RNAi oligonucleotides. A significant decrease in GPAT3 mRNA as well as GPAT3 activity was also observed with two additional siRNA oligonucleotides targeting GPAT3 (data not shown). These data suggest that a significant part of the GPAT activity in differentiated 3T3-L1 adipocytes is due to GPAT3 expression.
Fig. 6.
GPAT3 mRNA expression and GPAT activity in 3T3-L1 adipocytes. (A) Induction of GPAT3 mRNA during 3T3-L1 differentiation detected by Q-PCR. (B and C) siRNA-mediated knockdown of GPAT3 in 3T3-L1 adipocytes. GPAT3 mRNA levels (B) and GPAT activity (C) were determined by Q-PCR analysis and TLC, respectively. Shown on top of C is a representative TLC datapoint showing the formation of LPA in the GPAT assay. Data are expressed as mean ± SD (n = 4). ∗, P < 0.05.
Regulation of GPAT3 in Obese Mice and upon Peroxisome Proliferator-Activated Receptor γ (PPARγ) Activation.
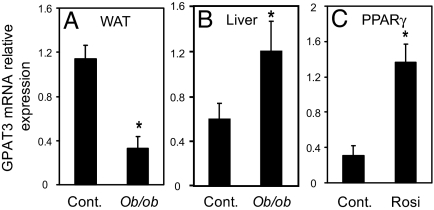
To further understand a role of GPAT3 in lipogenesis, we examined GPAT3 expression in ob/ob mice, a genetic model of obesity, as well as its response to PPARγ activation. mGPAT3 mRNA was significantly (70%) decreased in adipose tissue (Fig. 7A) and significantly increased (2-fold) in liver (Fig. 7B) of ob/ob mice. PPARγ agonists such as rosiglitazone induce expression of the lipogenic program in adipose tissue (17). Treatment of ob/ob mice with rosiglitazone for 21 days induced expression of mGPAT3 mRNA in white adipose tissue 4.5-fold (Fig. 7C). mtGPAT1 and DGAT1 mRNA also showed a large increase during 3T3-L1 differentiation (8, 18) (SI Fig. 10 A and E) and a significant down-regulation in adipose tissue of ob/ob mice (SI Fig. 10 B and F). The down-regulation of mRNA for DGAT1 and other genes involved in lipogenesis in ob/ob white adipose tissue has been reported and has been attributed to dedifferentiation of adipose tissue in ob/ob mice (19, 20). In contrast to GPAT3, the expression levels of mtGPAT1 and DGAT1 did not change in the liver of ob/ob mice or in adipose tissue upon rosiglitazone treatment (SI Fig. 10 C, D, G, and H). Taken together, the regulation of GPAT3 mRNA supports a role for this enzyme in lipogenesis.
Fig. 7.
Regulation of GPAT3 mRNA in mice. (A and B) GPAT3 mRNA in white adipose tissue (WAT, A) or liver (B) of ob/ob mice compared with wild-type control mice. (C) Treatment of ob/ob mice with the PPARγ agonist rosiglitazone (Rosi) increased GPAT3 mRNA expression in WAT. Data are expressed as mean ± SEM. (n = 4). ∗, P < 0.05.
Discussion
Although the existence of NEM-sensitive microsomal GPAT activity has been known for many decades, this report identifies genes encoding this activity in mammals. Several lines of evidence suggest that the human and mouse genes we named GPAT3 indeed encode a microsomal GPAT. First, GPAT3 contains all four conserved motifs that are found in most acyltransferases involved in glycerolipid metabolism. Second, recombinant GPAT3 expressed in insect or mammalian cells exhibits NEM-sensitive GPAT activity. Importantly, expression of recombinant GPAT3 specifically increased acylation of G3P, but not LPA, other lysophospholipids, MAG, or DAG. Recognition of a wide variety of acyl-CoA species, including both saturated and unsaturated, is also in line with the reported characteristics of microsomal GPAT. Third, GPAT3 was localized to the ER but not to mitochondria. Fourth, GPAT3 mRNA was up-regulated during 3T3-L1 adipocyte differentiation, consistent with the reported up-regulation of microsomal GPAT activity in this cell line. Finally, GPAT3 mRNA and GPAT activity in differentiated adipocytes was significantly decreased by siRNA directed against GPAT3, suggesting that GPAT3 accounts for a significant portion of the increased GPAT activity. These findings establish GPAT3 as a microsomal GPAT.
The product of the GPAT reaction, LPA, is an intermediate in both phospholipid and TAG synthesis. Here we show that GPAT3, when overexpressed, selectively increases TAG synthesis and does not affect synthesis of phospholipids. A function for GPAT3 in TAG synthesis is further supported by the pattern of GPAT3 mRNA expression and regulation. Similar to DGAT1 and mtGPAT1, GPAT3 mRNA is highly expressed in white adipose tissue, is up-regulated during adipocyte differentiation, and is down-regulated in the adipose tissue of ob/ob mice. In addition, GPAT3 mRNA is increased in white adipose tissue of mice treated with the PPARγ agonist rosiglitazone, which is known to induce expression of lipogenic genes (17) and is significantly up-regulated in livers of ob/ob mice, a model of hepatic steatosis. It remains to be determined whether additional microsomal GPAT isoforms exist that are primarily responsible for phospholipid synthesis.
Obesity, type 2 diabetes, dyslipidemia, and atherosclerosis are closely associated with alterations in TAG and fatty acid synthesis, and enzymes such as DGAT1, acetyl-CoA carboxylase 2, and stearoyl-CoA desaturase 1 have emerged as important therapeutic targets for treating these conditions (21–24). Microsomal GPAT has similarly been suggested as a possible therapeutic target for obesity, type 2 diabetes, and dyslipidemia (25); however, the lack of molecular knowledge so far has hampered efforts to pursue this activity as a target. Our findings open the door to evaluate the role of microsomal GPAT in the pathophysiology of obesity, type 2 diabetes, and related disorders, and to determine whether GPAT3 might be a target for treating these diseases.
Materials and Methods
Bioinformatic Analysis.
A profile hidden Markov model was generated by using the Pfam glycerophosphate acyltransferase model (PF01553) (26) and recently reported yeast ER-bound GPATs (15). This profile was then queried against SwissPort/TrEMBL (27), RefSeq (28), Ensembl (29), and human and mouse genome databases to retrieve a list of sequences containing the glycerophosphate acyltransferase domain. A nonredundant set was generated by filtering out duplicates and alternative splice variants.
Cloning and Expression of GPAT3.
Full-length mGPAT3 and hGPAT3 coding sequences with or without an in-frame N-terminal FLAG epitope (MDYKDDDDL) were cloned into pPCRscript Amp SK(+) vector (Stratagene, La Jolla, CA) by PCR amplification from mouse 17-day embryo and human leukocyte cDNA libraries (BD Biosciences, Franklin Lakes, NJ). The cDNA inserts were subsequently cloned into the mammalian expression vector pcDNA3.1(+)/Hygro or into the pFastBac1 vector to generate recombinant baculovirus for insect cell expression using the Bac-to-Bac baculovirus expression system (BD Biosciences). The human DGAT1 and mtGPAT1 clones were generated as described (18, 30). Mammalian cells were transiently transfected by using Fugene 6 (Roche Diagnostics, Indianapolis, IN). For expression in insect cells, Sf-9 cells were infected with recombinant baculovirus at an optimal multiplicity of infection for 64 h. Cell pellets were harvested in ice-cold PBS and lysed by sonication, and total lysate was used immediately for activity assay. For subcellular fractionation, cells were lysed by using nitrogen decompression (Parr Instrument Company, Moline, IL), followed by differential centrifugation at 8,000 × g (mitochondrial fraction) and 100,000 × g (microsomal fraction). Protein concentration was determined by a Bio-Rad (Hercules, CA) protein assay with BSA as a standard.
Acyltransferase Activity Assays.
GPAT activity assay by 1-butanol extraction was performed as described (8, 16), using [3H]G3P [30 Ci/mmol, American Radiolabeled Chemicals, Inc. (St. Louis, MO) (1 Ci = 37 GBq)] and Lauroyl-CoA as substrates. For TLC separation, the assay was conducted in 75 mM Tris·HCl, pH 7.5/4 mM MgCl2/1 mg/ml fatty acid free BSA with 150 μM [14C]G3P (55 mCi/mmol) and 50 μM acyl-CoA or 25 μM [14C]Lauroyl-CoA (55 mCi/mmol) and 0.5 mM G3P as substrates, unless otherwise mentioned. Lipids were extracted by using chloroform:methanol (2:1, vol/vol), dried, and separated by TLC with chloroform:methanol:water (65:25:4, vol/vol) followed by exposure to a PhosphorImager screen. Where indicated, cell lysates were incubated with or without 0.4 μM NEM for 15 min on ice before the initiation of reaction. Acyltransferase activity toward LPA, lysophosphatidylcholine, lysophosphatidylserine, lysophosphatidylglycerol, MAG, and DAG were assayed as described (30–32) by using 25 μM [14C]Lauroyl-CoA and 200 μM acyl acceptors.
Metabolic Labeling Studies.
Forty hours after transfection, HEK293 cells were incubated with 2 μM [14C]oleic acid (50 Ci/mmol) in medium supplemented with 0.1% fatty acid free BSA for 6 h. Cells were then washed twice with cold PBS, and total lipids were extracted with chloroform/methanol (2:1, vol/vol). Lipids were resolved by TLC by using chloroform:methanol:water (65:25:4, vol/vol, polar lipids) or hexane:ethyl ether:acetic acid (80:20:1, vol/vol/v, neutral lipids) and visualized by exposure to a PhosphorImager screen.
Immunofluorescence.
Indirect immunofluorescence was performed in COS-7 cells transfected with Flag-tagged mGPAT3, as described (30). Mitochondria and ER were stained with MitoTracker Red CMXRos (Invitrogen, Carlsbad, CA) and anti-Calnexin antibody (StressGen Biotechnologies, Victoria, Canada), respectively, as described (30). Images were collected on a Bio-Rad MRC-600 Laser Confocal Microscope System.
Transcriptional Profiling and Quantitative RT-PCR Analysis.
Undifferentiated and differentiated 3T3-L1 adipocytes, tissues from normal, 8- to 12-week-old male C57BL/6J mice, as well as tissues from 10-week-old male ob/ob and age-matched wild-type control mice, were obtained as described (33). For PPARγ agonist treatment, 10-week-old male ob/ob mice were gavaged once per day with 15 mg/kg rosiglitazone or vehicle control for 21 days. RNA from human tissues was obtained from Clontech (Mountain View, CA). Taqman real-time quantitative PCR (Q-PCR) was performed by using an ABI Prism 7900 sequence detector (PE Applied Biosystems, Foster City, CA) with 18S as an internal control, as described (33). Gene-specific primers and probes were obtained from Applied Biosystems. Relative expression was determined by the Ct method (Applied Biosystems).
siRNA Electroporation of 3T3-L1 Adipocytes.
3T3-L1 cells were induced to differentiate as described (33). On day 10 after differentiation, 2.5 × 10⁶ 3T3-L1 adipocytes suspended in 0.5 ml of PBS were transfected with 15 nmol of control siRNA (Ambion, Austin, TX; catalogue no. 4613) or mGPAT3-specific siRNA duplex [Ambion catalogue no. 16708A, siRNA ID 16316, 16317 (shown in Fig. 6), and 16318] by electroporation as described (34). After electroporation, cells were immediately mixed with fresh medium and incubated for 10 min on ice before seeding into six-well plates. Seventy-two hours after electroporation, GPAT3 mRNA was measured by Q-PCR, and GPAT activity was determined as described above.
Statistical Analysis.
Statistical significance was determined by Student's t test.
Note.
GPAT3 is closely related (≈80% identity within the acyltransferase domain) to a previously identified gene of unknown enzymatic function, AGPAT6. During the preparation of this manuscript, two publications reported on tissue distribution and in vivo functions of AGPAT6 (35, 36), indicating an important role of AGPAT6 in TAG biosynthesis. The gene we named GPAT3 was provisionally designated as AGPAT8 in these two manuscripts; however, no enzymatic activity data were provided for both AGPAT6 and GPAT3/AGPAT8.
Supplementary Material
Acknowledgments
We thank Christina Benander and Dr. Jae Eun Kim for technical assistance, Christine Huard and Dr. Robert Martinez for transcriptional profiling data, and Andrew Lake for critical reading of this manuscript.
Abbreviations
- DAG
diacylglycerol
- DGAT
acyl-CoA:DAG acyltransferase
- ER
endoplasmic reticulum
- GPAT
acyl-CoA:glycerol-3-phosphate acyltransferase
- G3P
glycerol-3-phosphate
- LPA
lysophosphatidic acid
- NEM
N-ethylmaleimide
- Q-PCR
quantitative PCR
- TAG
triacylglycerol
- TLC
thin-layer chromatography
- MAG
monoacylglycerol
- mtGPAT1
mitochondrial NEM-resistant GPAT1
- mGPAT3
mouse GPAT3
- hGPAT3
human GPAT3
- PPARγ
peroxisome proliferator-activated receptor γ
- AGPAT
acyl-CoA-acyl-glycerol-3-phosphate acyltransferase.
Footnotes
Conflict of interest statement: H.F.L. owns publicly traded stock in Wyeth. The authors are employed by Wyeth and may also own publicly traded stock in Wyeth.
This article contains supporting information online at www.pnas.org/cgi/content/full/0609140103/DC1.
References
- 1.Coleman RA, Lee DP. Prog Lipid Res. 2004;43:134–176. doi: 10.1016/s0163-7827(03)00051-1. [DOI] [PubMed] [Google Scholar]
- 2.Lehner R, Kuksis A. Prog Lipid Res. 1996;35:169–201. doi: 10.1016/0163-7827(96)00005-7. [DOI] [PubMed] [Google Scholar]
- 3.Smith SJ, Cases S, Jensen DR, Chen HC, Sande E, Tow B, Sanan DA, Raber J, Eckel RH, Farese RV., Jr Nat Genet. 2000;25:87–90. doi: 10.1038/75651. [DOI] [PubMed] [Google Scholar]
- 4.Stone SJ, Myers HM, Watkins SM, Brown BE, Feingold KR, Elias PM, Farese RV., Jr J Biol Chem. 2004;279:11767–11776. doi: 10.1074/jbc.M311000200. [DOI] [PubMed] [Google Scholar]
- 5.Lewin TM, Schwerbrock NM, Lee DP, Coleman RA. J Biol Chem. 2004;279:13488–13495. doi: 10.1074/jbc.M314032200. [DOI] [PubMed] [Google Scholar]
- 6.Hammond LE, Gallagher PA, Wang S, Hiller S, Kluckman KD, Posey-Marcos EL, Maeda N, Coleman RA. Mol Cell Biol. 2002;22:8204–8214. doi: 10.1128/MCB.22.23.8204-8214.2002. [DOI] [PMC free article] [PubMed] [Google Scholar]
- 7.Neschen S, Morino K, Hammond LE, Zhang D, Liu ZX, Romanelli AJ, Cline GW, Pongratz RL, Zhang XM, Choi CS, Coleman RA, Shulman GI. Cell Metab. 2005;2:55–65. doi: 10.1016/j.cmet.2005.06.006. [DOI] [PubMed] [Google Scholar]
- 8.Yet SF, Lee S, Hahm YT, Sul HS. Biochemistry. 1993;32:9486–9491. doi: 10.1021/bi00087a029. [DOI] [PubMed] [Google Scholar]
- 9.Coleman RA, Reed BC, Mackall JC, Student AK, Lane MD, Bell RM. J Biol Chem. 1978;253:7256–7261. [PubMed] [Google Scholar]
- 10.Kluytmans JH, Raju PK. Prep Biochem. 1974;4:141–163. doi: 10.1080/00327487408068769. [DOI] [PubMed] [Google Scholar]
- 11.Yamashita S, Numa S. Eur J Biochem. 1972;31:565–573. doi: 10.1111/j.1432-1033.1972.tb02566.x. [DOI] [PubMed] [Google Scholar]
- 12.Eccleston VS, Harwood JL. Biochim Biophys Acta. 1995;1257:1–10. doi: 10.1016/0005-2760(95)00054-g. [DOI] [PubMed] [Google Scholar]
- 13.Mishra S, Kamisaka Y. Biochem J. 2001;355:315–322. doi: 10.1042/0264-6021:3550315. [DOI] [PMC free article] [PubMed] [Google Scholar]
- 14.Zheng Z, Xia Q, Dauk M, Shen W, Selvaraj G, Zou J. Plant Cell. 2003;15:1872–1887. doi: 10.1105/tpc.012427. [DOI] [PMC free article] [PubMed] [Google Scholar]
- 15.Zheng Z, Zou J. J Biol Chem. 2001;276:41710–41716. doi: 10.1074/jbc.M104749200. [DOI] [PubMed] [Google Scholar]
- 16.Haldar D, Vancura A. Methods Enzymol. 1992;209:64–72. doi: 10.1016/0076-6879(92)09008-q. [DOI] [PubMed] [Google Scholar]
- 17.Rosen ED, Spiegelman BM. J Biol Chem. 2001;276:37731–37734. doi: 10.1074/jbc.R100034200. [DOI] [PubMed] [Google Scholar]
- 18.Cases S, Smith SJ, Zheng YW, Myers HM, Lear SR, Sande E, Novak S, Collins C, Welch CB, Lusis AJ, et al. Proc Natl Acad Sci USA. 1998;95:13018–13023. doi: 10.1073/pnas.95.22.13018. [DOI] [PMC free article] [PubMed] [Google Scholar]
- 19.Suzuki R, Tobe K, Aoyama M, Sakamoto K, Ohsugi M, Kamei N, Nemoto S, Inoue A, Ito Y, Uchida S, et al. J Biol Chem. 2005;280:3331–3337. doi: 10.1074/jbc.M410955200. [DOI] [PubMed] [Google Scholar]
- 20.Nadler ST, Stoehr JP, Schueler KL, Tanimoto G, Yandell BS, Attie AD. Proc Natl Acad Sci USA. 2000;97:11371–11376. doi: 10.1073/pnas.97.21.11371. [DOI] [PMC free article] [PubMed] [Google Scholar]
- 21.Chen HC, Farese RV., Jr Trends Cardiovasc Med. 2000;10:188–192. doi: 10.1016/s1050-1738(00)00066-9. [DOI] [PubMed] [Google Scholar]
- 22.Subauste A, Burant CF. Curr Drug Targets Immune Endocr Metabol Disord. 2003;3:263–270. doi: 10.2174/1568008033340081. [DOI] [PubMed] [Google Scholar]
- 23.Shi Y, Burn P. Nat Rev Drug Discov. 2004;3:695–710. doi: 10.1038/nrd1469. [DOI] [PubMed] [Google Scholar]
- 24.Chen HC, Farese RV., Jr Arterioscler Thromb Vasc Biol. 2005;25:482–486. doi: 10.1161/01.ATV.0000151874.81059.ad. [DOI] [PubMed] [Google Scholar]
- 25.Thuresson ER. Curr Opin Investig Drugs. 2004;5:411–418. [PubMed] [Google Scholar]
- 26.Finn RD, Mistry J, Schuster-Bockler B, Griffiths-Jones S, Hollich V, Lassmann T, Moxon S, Marshall M, Khanna A, Durbin R, et al. Nucleic Acids Res. 2006;34:D247–D251. doi: 10.1093/nar/gkj149. [DOI] [PMC free article] [PubMed] [Google Scholar]
- 27.Boeckmann B, Bairoch A, Apweiler R, Blatter MC, Estreicher A, Gasteiger E, Martin MJ, Michoud K, O'Donovan C, Phan I, et al. Nucleic Acids Res. 2003;31:365–370. doi: 10.1093/nar/gkg095. [DOI] [PMC free article] [PubMed] [Google Scholar]
- 28.Pruitt KD, Tatusova T, Maglott DR. Nucleic Acids Res. 2005;33:D501–D504. doi: 10.1093/nar/gki025. [DOI] [PMC free article] [PubMed] [Google Scholar]
- 29.Birney E, Andrews D, Caccamo M, Chen Y, Clarke L, Coates G, Cox T, Cunningham F, Curwen V, Cutts T, et al. Nucleic Acids Res. 2006;34:D556–D561. doi: 10.1093/nar/gkj133. [DOI] [PMC free article] [PubMed] [Google Scholar]
- 30.Cao J, Liu Y, Lockwood J, Burn P, Shi Y. J Biol Chem. 2004;279:31727–31734. doi: 10.1074/jbc.M402930200. [DOI] [PubMed] [Google Scholar]
- 31.Yang Y, Cao J, Shi Y. J Biol Chem. 2004;279:55866–55874. doi: 10.1074/jbc.M406710200. [DOI] [PubMed] [Google Scholar]
- 32.Cao J, Lockwood J, Burn P, Shi Y. J Biol Chem. 2003;278:13860–13866. doi: 10.1074/jbc.M300139200. [DOI] [PubMed] [Google Scholar]
- 33.Lake AC, Sun Y, Li JL, Kim JE, Johnson JW, Li D, Revett T, Shih HH, Liu W, Paulsen JE, Gimeno RE. J Lipid Res. 2005;46:2477–2487. doi: 10.1194/jlr.M500290-JLR200. [DOI] [PubMed] [Google Scholar]
- 34.Jiang ZY, Zhou QL, Coleman KA, Chouinard M, Boese Q, Czech MP. Proc Natl Acad Sci USA. 2003;100:7569–7574. doi: 10.1073/pnas.1332633100. [DOI] [PMC free article] [PubMed] [Google Scholar]
- 35.Vergnes L, Beigneux AP, Davis R, Watkins SM, Young SG, Reue K. J Lipid Res. 2006;47:745–754. doi: 10.1194/jlr.M500553-JLR200. [DOI] [PMC free article] [PubMed] [Google Scholar]
- 36.Beigneux AP, Vergnes L, Qiao X, Quatela S, Davis R, Watkins SM, Coleman RA, Walzem RL, Philips M, Reue K, Young SG. J Lipid Res. 2006;47:734–744. doi: 10.1194/jlr.M500556-JLR200. [DOI] [PMC free article] [PubMed] [Google Scholar]
Associated Data
This section collects any data citations, data availability statements, or supplementary materials included in this article.


