Abstract
Following a pretest, 8 participants who were unfamiliar with algebraic and trigonometric functions received a brief presentation on the rectangular coordinate system. Next, they participated in a computer-interactive matching-to-sample procedure that trained formula-to-formula and formula-to-graph relations. Then, they were exposed to 40 novel formula-to-graph tests and 10 novel graph-to-formula tests. Seven of the 8 participants showed substantial improvement in identifying formula-to-graph relations; however, in the test of novel graph-to-formula relations, participants tended to select equations in their factored form. Next, we manipulated contextual cues in the form of rules regarding mathematical preferences. First, we informed participants that standard forms of equations were preferred over factored forms. In a subsequent test of 10 additional novel graph-to-formula relations, participants shifted their selections to favor equations in their standard form. This preference reversed during 10 more tests when financial reward was made contingent on correct identification of formulas in factored form. Formula preferences and transformation of novel mathematical and stimulus functions are discussed.
Keywords: value, preference, mutual entailment, combinatorial entailment, transformation of function
Many mathematical functions have graphs that are transformations of a library of functions on Descarte's rectangular coordinate system. Historically, transformation of graphs of functions has been a major component of many levels of algebra as well as of more advanced courses in mathematics. Showing students how a variable changes in defined stages has been a dynamic learning tool in training mathematical relations. In other words, allowing students to “see” the transformations that occur when an equation is modified in its particular characteristics (Larson & Hostetler, 2001) helps the learner to understand families of functions and their relations to each other. This can be particularly beneficial in showing how transformations are applied to mathematical functions on the coordinate axis, and how the equation of a function can be systematically modified to transform the graph of any function (Sullivan, 2002).
Nevertheless, instructional strategies aimed at training transformation of mathematical functions have been circumvented in many high school and college intermediate algebra classes (R. Huettenmueller, personal communication, June 25, 2005). This is somewhat surprising in that, traditionally, many state assessment instruments of algebra have included questions regarding transformation of functions (e.g., Texas Education Agency, 2002), and most Algebra I textbooks (e.g., Kennedy, McGowan, Schultz, Hollowell, & Jovell, 1998; Saxon, 1997) and intermediate algebra textbooks (e.g., Larson & Hostetler, 2001) emphasize the importance of exposure to these concepts. Moreover, this subject matter is often addressed in varying degrees of complexity within college algebra (e.g., Larson & Hostetler, 1997), trigonometry (e.g., Smith, 1998), precalculus (e.g., Sullivan, 2002), and calculus (e.g., Finney, Weir, & Giordano, 2001) textbooks. Concurrently, math performance in the United States has been in a state of continuous lag behind most of the countries in the industrialized world. Findings from the Programme for International Student Assessment (PISA, 2003) study indicate that 15-year-old students in the United States are performing at a disappointing level in fundamental math concepts when contrasted with their counterparts in other parts of the industrialized world. For example, the United States ranked 24th of 29 countries with regard to mathematics literacy. Moreover, the PISA study indicated that 25% of American students performed below the lowest possible level of competence in mathematics. This lack of fluency in the fundamentals of basic mathematical operations has migrated into postsecondary education, where more than one in three college students must enroll in a remedial math program prior to taking college-level courses (Steen, 2003).
From the perspective of behavior analysis, it seems likely that the omission of component math skills would contribute to a cumulative dysfluency in prerequisite and related problem-solving skills (see Binder, 1996, for a discussion of cumulative dysfluency). Consequently, applied behavior-analytic methods for training transformation of mathematical functions appear to be needed, and indeed recent research has begun to address this issue (Ninness, Rumph, McCuller, Harrison, et al., 2005; Ninness, Rumph, McCuller, Vasquez, et al., 2005). This work has drawn directly on some of the procedures and concepts used in various types of research on stimulus relations (e.g., Lane, Clow, Innis, & Critchfield, 1998; Leader & Barnes-Holmes, 2001; Lynch & Cuvo, 1995) and in particular on relational frame theory (RFT; Hayes, Barnes-Holmes, & Roche, 2001). One of the core postulates of RFT is that much of human relational responding, including mathematical reasoning, is established in the form of generalized relational operants through appropriate histories of multiple-exemplar training (e.g., Y. Barnes-Holmes, Barnes-Holmes, Smeets, Strand, & Friman, 2004). In fact, a wide range of new training protocols using stimulus relations are beginning to appear in the applied literature. For example, Rehfeldt and Root (2005) confirmed that a history of relational responding generated requesting skills among 3 adults with severe developmental disabilities. In addition, 1 of the participants demonstrated tacting and textual behavior. Rehfeldt and Root speculate that establishing derived relations has the potential to generate novel forms of requesting and perhaps a wide range of complex verbal skills. According to RFT, there are many such relational operants (or relational frames), but they all possess three defining behavioral properties: mutual entailment, combinatorial entailment, and the transformation of stimulus functions. It is important that the latter should not be confused with the mathematical variety, transformations of graphs of functions. Both types of transformations are detailed below.
The concept of mutual entailment refers to the derived relations that may obtain between two stimuli or events. For example, if a given stimulus is related to another such that Stimulus A is the same as Stimulus B, then the derived relation—B is the same as A—is mutually entailed. The concept of combinatorial entailment refers to derived relations among three or more stimuli. For example, given that A is the opposite of B and B is the opposite of C, C same as A and A same as C are defined as combinatorially entailed relations. Among many other possibilities (e.g., greater than or less than), it might be that A is the same as B and B is the same as C, in which case A remains the same as C (and vice versa) as combinatorially entailed. There are virtually an unlimited number of ways in which stimuli or events might be mutually or combinatorially entailed, and many of these may result in comparisons other than sameness. Nevertheless, in all cases, mutually and combinatorially entailed relations constitute a relational network, and when such a network has particular stimulus functions, the functions of other events in that network may transform or alter in accordance with the derived relations.
Transformation of Stimulus Functions
The concept of transformation of stimulus function refers to the changes that occur in the behavioral functions of stimuli based on their participation in a particular relational network. In the present study, transformation of stimulus function addresses how networks of newly learned relations may become preferred over others. As a practical matter, consider the following brief example from Stewart, Barnes-Holmes, Hayes, and Lipkens (2001). Perhaps an English-speaking child has learned that a nickel has a particular type of financial value in relation to a dime,
and furthermore has learned the arbitrary comparative relation of size, such that when offered a nickel or a dime she will avoid the physically larger nickel to pick the arbitrarily “larger” dime. If when visiting the Netherlands the child is provided contextual cues for the derivation of a relation between a “stuiver” and a “dubbeltje,” that is analogous to that between a nickel and a dime (e.g., “stuiver is to dubbeltje as nickel is to dime”) then she may now derive that a “stuiver” is half the value of a “dubbeltje.” (p. 77)
Conversely, if in the above example, the child were to be informed (incorrectly) that the relation between “stuiver” and a “dubbeltje” was the “opposite” of that of similar coins in her native land, she might well derive that a “stuiver” is twice the value of a “dubbeltje.” Moreover, while still operating under the control of such an inaccurate rule, if given an opportunity to select one of the two coins, this same individual is likely to show a preference for the physically larger “stuiver.” Here, the specific value function of the coins transforms in accordance with their respective contextual cues (verbal descriptions of their relative value) and independent of any direct training or reinforcement addressing the monetary systems involved.
In the same way that a particular discriminative stimulus may control a class of unique responses in alternating contexts, a particular rule that describes a context may alter a class of responses, but only in the context defined by the rule. Informing a child that when she is in a particular country, coins are the same as or the opposite of similar coins in her native land may control her preference for those coins, but only for the duration of her stay in that country. The rules function as a form of instructional control, but only conditionally. Although the above account is only a theoretical example, it has practical implications for training several types of mathematical relations. The current study focused on the transformation of preference functions for specific relational or mathematical networks.
Transformation of Mathematical Functions
When graphs of functions change by the addition (or subtraction) of terms within formulas for those functions, they are said to transform. Collectively, these techniques are often described as transformations of graphs of functions (Larson & Hostetler, 2001). Critically, the concept of relating relations may be important in developing a behavior-analytic understanding of the transformation of mathematical functions. When a student successfully learns to relate a particular graph to a particular formula, for example, this involves more than simply relating two discrete stimulus events. Both the graph and the formula are composed of multiple stimuli that relate to each other in specific ways, so relating graph to formula thus involves relating one set of relations to another set of relations.
For instance, many functions have graphs that interrelate in their various types of vertical and horizontal shifts, reflections, compressions, and stretches. As one example of a mathematical transformation, the addition of a positive constant inside of the argument shifts the function to the left (negative direction), whereas the subtraction of a constant inside of the argument produces a shift to the right (positive direction). For many students, horizontal transformations run contrary to expectation, and many students have difficulty learning to identify graphed representations of such transformations when displayed individually or in multiple combinations of horizontal and vertical shifts. Pilot research in our laboratory suggests that horizontal shifts are especially difficult for many students when the argument entails a negative x coefficient and a negative constant (e.g.,  ). However, our previous investigations have demonstrated that training students to factor via matching-to-sample (MTS) procedures allowed them to learn horizontal shifts more efficiently and to derive more complex transformations for a much wider range of formulas and graphed analogues.
For example, Ninness, Rumph, McCuller, Vasquez, et al. (2005) employed a series of MTS procedures in training formula-to-graph relations. Participants were tested on 36 novel variations of the original equations, and most demonstrated substantially improved performance. Participant error patterns were identified with the help of an artificial neural network system called the self-organizing map (Kohonen, 2001). Subsequently, revised software was developed to remediate errors, and participants showed improved performances in identifying mathematical relations. In a follow-up study (Ninness, Rumph, McCuller, Harrison, et al., 2005), participants took part in an MTS procedure in which they received training on particular standard formula-to-factored formula and factored formula-to-graph relations as these formulas pertain to reflections and vertical and horizontal shifts. Participants demonstrated combinatorial entailment by identifying standard formula-to-graph relations and showed high levels of accuracy in identifying 40 novel transformations of graphs of mathematical functions. The fact that the participants were capable of identifying novel transformations indicated that they had not simply learned to relate formula and graphs as discrete stimulus events. Instead, they had learned to relate the relations contained within the graphs and formulas to each other, and this relating of relations was then applied to the novel transformation problems. The present study sought to extend this research.
In most mathematical textbooks, equations of functions are illustrated in standard form, starting with the highest degree term and continuing with terms in descending order. (Depending on the function, some texts refer to this as the general form of the equation.) In contrast, factored equations are written as the products of lower degree expressions, and they are most often used for explanatory purposes or to demonstrate the derivation of various mathematical relations (Sullivan, 2002).
To delineate the present study from our previous work in this area, in the present investigation we attempted to expand our analysis to include novel graph-to-formula relations as well as the transformation of stimulus functions of formulas. Unlike most laboratory research in the area of derived stimulus relations (e.g., Dougher & Markham, 1994; O'Hora, Roche, Barnes-Holmes, & Smeets, 2002), the current investigation attempted to address contextual control by manipulating verbal instructions that address novel mathematical relations. First, as in our previous research (Ninness, Rumph, McCuller, Harrison, et al., 2005; Ninness, Rumph, McCuller, Vasquez, et al., 2005), participants were given a brief lecture, followed by computer-interactive training on the relations between standard formulas and more easily understood factored formulas as well as factored formulas and their graphical representations. MTS procedures were used to assess mutual entailment and combinatorial entailment, and participants were probed over an array of novel and complex formula-to-graph relations. However, unlike any of our previous studies in this area, participants also were probed on 10 novel graph-to-formula relations, in which two of the six comparison items were correct. One of the correct formulas was arranged in standard form and the other in factored form. Then, we attempted to transform participants' preference for particular forms of correct answers by informing them that mathematicians prefer to express equations in standard rather than factored form. Finally, we implemented a control condition in which the experimental contingencies were altered by informing participants that they would receive increased financial reward for selecting correct equations represented in the factored form rather than the standard form.
Method
Participants and Setting
After obtaining informed consent and administering a pretest to determine individuals' familiarity with various mathematical functions, the experimenters dismissed anyone who demonstrated any prior knowledge of transformation of mathematical functions. Correctly answering more than three of 15 pretest items precluded an individual from participating in the experiment.
Ten participants (9 women and 1 man), ranging in age from 19 to 35 years, began the experiment, but 2 did not complete the entire training and testing sequence. All participants were undergraduates or graduate students at Stephen F. Austin State University. Participants were recruited from various academic programs by way of prearranged agreements with professors to offer this opportunity to their classes. All participants received five test points on their final examination for taking part in the experiment. There were 70 tests of novel relations in total. Each participant was paid a maximum of $8.00 for the entire experiment, with 10 cents per correct response during the assessment of novel relations (i.e., the first 60 items) and 20 cents per correct response during the last 10 trials. After completing the study, all participants were debriefed and compensated according to the number of correct responses they provided in the assessment of novel formula-to-graph and graph-to-formula relations. All sessions were conducted in rooms of the university that remained free of external diversions throughout the course of the experiment.
Apparatus and Software
Participants were seated individually at a table in a small session room containing a Hewlett Packard Pavilion ze5170 (Pentium 4 2-GHz processor with 512 MB RAM) laptop computer that displayed both mathematical equations and graphical representations of equations on a white background. A Labtec AM 252 microphone adjacent to each computer was conspicuously attached to a side port of the computer. Training and MTS procedures and the recording of responses were controlled by the computer program, which was written by the first author in Visual Basic 6 and C++. The software provided math instructional tutorials, displayed graphs, and recorded the accuracy of responses throughout all phases of the study. The experimental sessions were conducted on the laptop with an attached infrared mouse.
Design and Procedure
After a brief pretraining presentation (Stage 1), the participant was taken to the computer in an individual treatment room for Stage 2, where computer-interactive training was conducted. As in Ninness, Rumph, McCuller, Harrison, et al. (2005), participants were trained and tested on A-B and B-C relations and the assessment of mutually entailed (B-A and C-B) and combinatorially entailed (A-C and C-A) relations. The computer program then assessed the participant on 40 novel relations between formulas and the graphs of these functions.
At the conclusion of the assessment of novel formula-to-graph relations, participants' preferences for factored and standard forms of the equations were assessed. In this phase, we attempted to produce an experimental analogue of the transformation of stimulus functions, or change in formula preference, by way of providing contextual cues in the form of verbal rules that described a mathematical preference for particular types of formulas over others. In attempting to examine the transformation of stimulus functions, rules were used to establish contextual control over the discrimination of correct formulas from the comparison array of incorrect formulas. Participants were exposed to comparison items with four incorrect formulas and two correct formulas. One of the correct formulas was represented in standard form and the other in factored form. After participants responded to 10 graph-to-formula comparisons, they were given verbal rules indicating that equations of graphs are preferred when they are represented in their standard form. Subsequent to responding to a set of 10 graph-to-formula comparisons, we implemented a control condition in which we told participants that they would receive supplemental reinforcement (20 cents rather than 10 cents) for selecting the correct comparison formula in factored form rather than standard form.
Stage 1: Pretraining on Basic Mathematical Relations
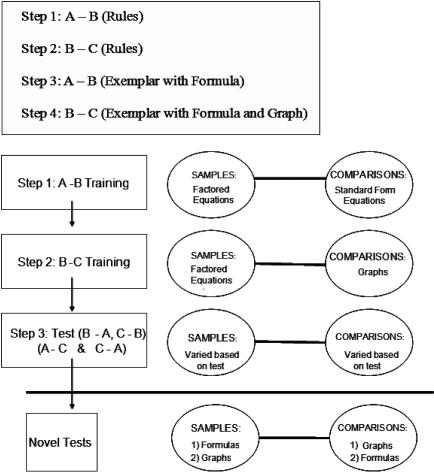
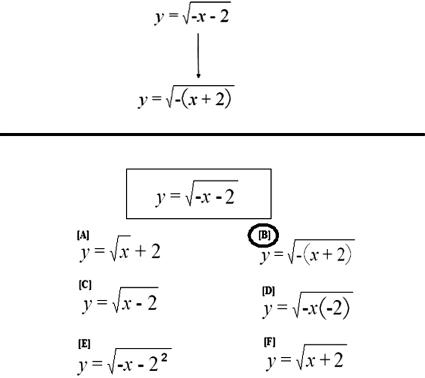
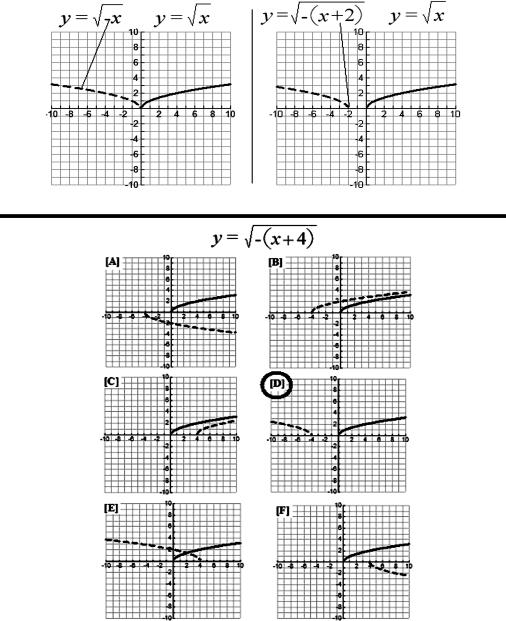
The experimenter provided a pretraining lecture to participants individually using PowerPoint® illustrations of the rectangular coordinate system. As illustrated in Figure 1, the experimenter read rules regarding square root operations from the screen and answered questions, but only to the extent that the questions pertained directly to sample-to-comparison items (A-B or B-C). The relations of B-A, C-B, A-C, and C-A were not addressed.
Figure 1. Stage 1 included giving rules and rules with exemplars by way of a PowerPoint® presentation.
Stage 2 involved computer-interactive conditional discrimination MTS training.
Step 1: Provide A-B rules. In pretraining A-B rules, the experimenter explained that a negative coefficient of x inside the argument of the standard form of a formula often makes graphing the function more complicated and that the standard form of the formula can be factored to remove any negative signs that preceded the x variable. It was explained that factoring the standard formula makes it more conducive to graphing techniques.
In this narrative account of A-B relations, standard formulas were samples, and factored formulas served as comparisons. For instance, participants were shown a basic square root function in its standard form and how to express it when a negative one coefficient is factored out of the argument. In the pretraining and computer training phases, we used the words “negative sign” rather than “−1 coefficient” because most of our participants had no familiarity with the latter term.
Step 2: Provide B-C rules. Because participants were unfamiliar with the Cartesian coordinate system, the experimenter noted that the horizontal number line is identified as the x axis and that the vertical number line is called the y axis. Participants were told that various types of formulas were called functions and could be employed to produce graphs. Using PowerPoint® slides, the experimenter read rules explaining that a negative sign inside the radical or the parentheses reflects the graph over in (about) the y axis and that a negative sign outside the radical or the parentheses reflects the graph down in (about) the x axis. Likewise, a constant value added or subtracted outside the radical or the parentheses moves the graph up or down the y axis in the same direction as indicated by the sign. The illustrations and rules provided on the slide presentation were identical to those of the computer-interactive MTS procedures that followed this presentation.
Step 3: Provide A-B exemplar. Participants were exposed to an instance of an A-B test screen. In this illustration, A was represented as a standard square root formula and B as one of six factored square root formulas, or comparisons. The experimenter told participants that the same type of screen image would be used during the computer-interactive training session. Using a handheld laser pointer, the experimenter identified the correct comparison item.
Step 4: Provide B-C exemplar. Participants were exposed to a slide of a B-C test screen. Here, B represented the factored formula, and C was one of six possible graphical representations of B. Again, using the laser pointer, the experimenter identified the correct comparison item displayed on the screen. (The A-B and B-C PowerPoint® illustrations were not the same as those used in Stage 2 for the actual computer-interactive training.)
As in Ninness, Rumph, McCuller, Harrison, et al. (2005), all participants were given the same 15-min pretraining presentation regarding the basics of the rectangular coordinate system and the relation between the square root formula and its graphical representation. Following the presentations, participants were escorted to the session room, and the experimenter demonstrated a point-and-click response on a sample screen and made sure that the participants could perform this type of response independently. Participants were told that mathematical rules would be posted on various screens and were directed to read these rules into the microphone adjacent to the computer each time the program instructed them to do so.
Stage 2: Training and Testing of Mathematical Relations
Before beginning the experiment, all participants were advised that at various points during the session, the computer would instruct them to stop responding. At that time, they were to contact the experimenter, who was located in an adjacent office. Stage 2 involved conditional discrimination MTS training; the program presented the participants with visual displays in the form of mathematical rules and emphasized that these rules should be stated aloud by reading them into a microphone. Thus, participants read and practiced the behaviors specified by mathematical rules. After training and assessing standard formula-to-factored-formula (A-B) relations and factored-formula-to-graph (B-C) relations, participants were tested for mutually entailed formula-to-formula (B-A) relations and graph-to-formula (C-B) relations. Then, the combinatorially entailed relations between the standard form of the formulas and their respective graphs (A-C), as well as the graphs of the functions and the original standard formulas (C-A), were tested.
For samples and comparisons, formula size was set at 24 using Times New Roman font. When displayed as samples, graphs were approximately 2 in. square on the computer screen; however, when displayed as comparisons in groups of six, they were reduced to approximately 1.5 in. square each. On any occasion during which a participant emitted an incorrect response, the program randomized all comparison elements on all screens and reexposed the participant to the entire MTS protocol, starting from the beginning.
Step 1: Train A-B relations, test A-B. As in Ninness, Rumph, McCuller, Harrison, et al. (2005), computer-interactive training of A-B included the following details. As the program displayed a mathematical rule on each training screen, the computer instructed the participant to read this rule into the microphone. For example, the participant read a rule indicating that the standard form of the square root formula can be factored to remove any negative signs that precede the x variable. After reciting each rule twice, the participant clicked “next” to advance to the screen that assessed A-B performance (see Appendix A). Unlike the previous training procedures employed in Ninness, Rumph, McCuller, Harrison, et al. (2005), the computer program did not generate any audio output expressing the rules displayed on the screen, nor did we attempt to record participants' reading of the rules displayed on the computer screen.
Step 2: Train B-C relations, test B-C. The same MTS procedure was used to train and test B-C relations but focused on rules pertaining to factored equations and their graphs. Rules regarding reflections and vertical and horizontal shifts associated with various functions on the coordinate system were displayed and then read aloud by participants. For example, the screen displayed solid blue lines to represent the basic square root functions and dashed red lines to illustrate transformations of the square root functions that occurred when the formulas changed. These rules described mathematical relations such as, “Negative sign inside the radical is reflected over in the y axis. A positive constant inside the radical or the parentheses moves the function in the opposite direction along the x axis.” (The program used the words “over in” rather than the conventional “about” based on pilot testing feedback that indicated this phrasing was easier for many participants to understand. See Appendix B for an illustration.) After these rules were displayed twice, the participant clicked “next” to advance to the screen that assessed B-C performance. Although the assessment screens varied the specific values of the constants within the formulas, the correct answers were always obtainable by performing in accordance with the previously displayed rules.
Step 3: Test B-A, test C-B, test A-C, and test C-A. This step assessed the mutually entailed B-A and C-B relations and the combinatorially entailed relations between the graphs of the functions and the original standard equations (A-C). Also, the combinatorial relations between the standard forms of the formulas and their graphs (C-A) were tested (see Appendix C).
All mathematical rules, formulas, and graphical representations for horizontal and vertical shifts as well as for reflections in the x axis and y axis were trained according to this protocol. In total, the program trained and tested two versions of the square root function and two versions of the common logarithmic function.
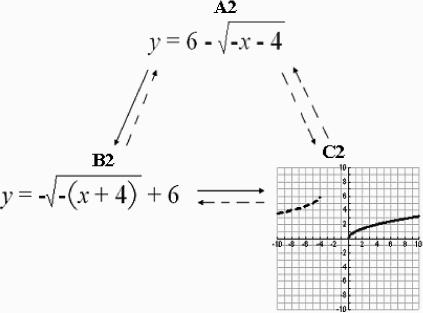
Figure 2 illustrates the trained and assessed relations addressing the log function A2, B2, and C2. Following the trained (A-B and B-C) relations, the program tested the mutually entailed (B-A and C-B) relations and combinatorially entailed (A-C and C-A) relations.
Figure 2. A square root function where A2 is in standard form, B2 is in factored form, and C2 is the graphical representation of this function.
Correction Procedures and Mastery Criteria
Mastery of the basic mathematical relations required the participant to complete one errorless sequence of all four classes of related mathematical functions. This included six MTS tests (A-B, B-C, B-A, C-B, A-C, and C-A) within each class of functions. Therefore, mastery required 24 consecutive correct identifications of the formula-to-graph and graph-to-formula relations. Participants who made MTS errors during the assessment of relations were returned to the beginning of the program; the program randomized all comparison elements before reexposing participants to the MTS protocol. If a participant required more than five reexposures to the protocol, the program ended, and the participant was compensated, debriefed, and excused from the study.
Assessment of Novel Formula-to-graph Relations
After demonstrating mutual entailment and combinatorial entailment on both versions of the square root functions and both versions of the common logarithmic functions, participants were tested on novel relations between formulas and their graphs—specifically, 40 complex variations of the trained mathematical formula-to-graph relations. For each test item, the participant attempted to match a new formula with a graph from a selection of six graphs not previously used during any training and assessment screens. (Within any MTS test, the comparison graphs were all the same type of mathematical function; for instance, a sine formula was only compared against variations of sine graphs.) No accuracy feedback or reexposure to training was given during assessment of novel formula-to-graph relations. This task required participants to identify graphs relating to formulas with new combinations of positive and negative constants inside and outside the arguments of 40 new mathematical functions. These novel formula-to-graph assessments included multiple combinations of reflections and vertical and horizontal shifts for complex logarithmic, square root, exponential, square, cubic, tangent, and sine functions. Performing these MTS tasks did not require the participant to become familiar with the dynamics of each type of mathematical function. However, successful performance did require the participant to identify new and complex combinations of reflections and shifts as they occurred among a wide array of diversified functions. In effect, this task involved relating specific relations expressed within the formula to specific relations illustrated within the graphs.
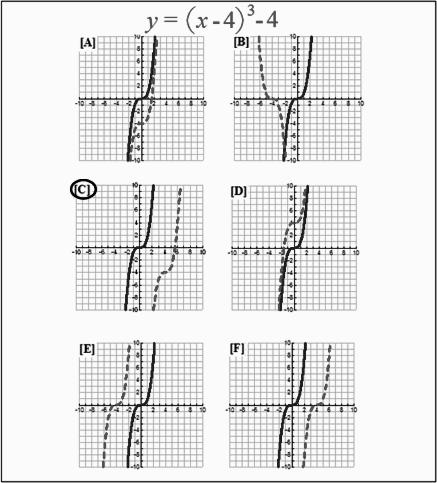
Figure 3 illustrates one of the 40 novel formula-to-graph tests. The solid line on each of the six comparison graphs represents the basic function prior to transformation. The dashed line shows the graph produced by the novel formula. When given the formula for a cube function with a negative constant 4 inside the argument (shifting right) and a negative 4 outside the argument (shifting down), participants who answered correctly chose C as the mathematical transformation of this function.
Figure 3. One of the 40 tests of novel formula-to-graph relations.
The solid lines represent the basic cube function (y = x3), and the dashed lines indicate the possible transformation when the formula becomes more complex. A participant who identified a novel variation of the formula that included a negative constant 4 within the argument and a negative constant 4 following the argument would select C as the correct comparison item.
Assessment of Novel Graph-to-formula Relations
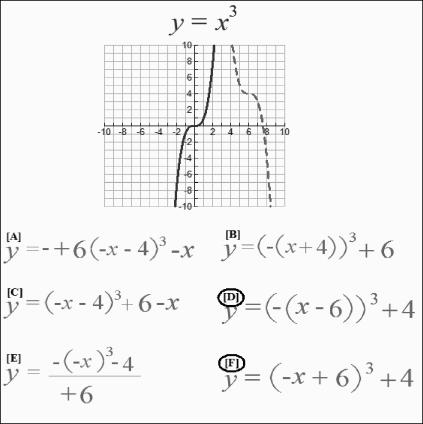
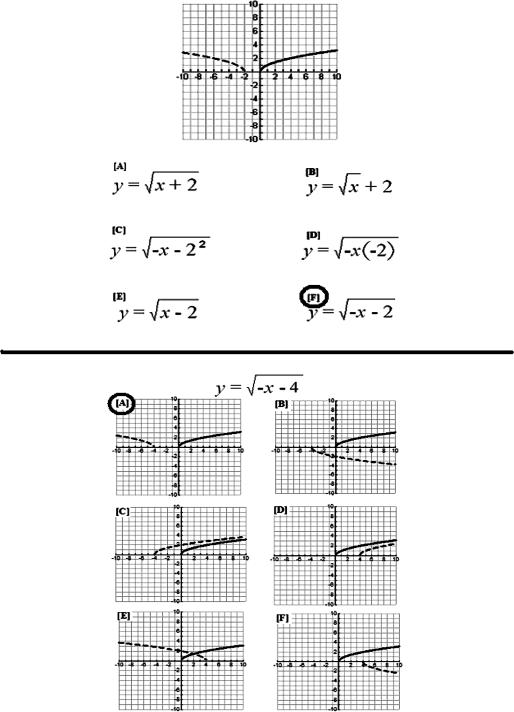
After providing 40 formula-to-graph comparisons in the format illustrated in Figure 3, we assessed participants' preferences for factored and standard forms of the equations. Here, the program provided 10 trials of novel graph-to-formula comparisons. On each screen, a graphical representation of a function was positioned at the top and an array of six equations was displayed below. In each array, two of the comparisons were correct: one in factored form and the other in standard form. Figure 4 shows 1 of the 10 screen displays employed during this phase, where F represents the standard form and D represents the factored form of the argument of this function.
Figure 4. One of the 30 tests of novel graph-to-formula relations.
The solid line represents the basic exponential function (y = x3), and the dashed line indicates the transformation when the formula becomes more complex. A participant who identified that this function included a negative coefficient of x, a positive constant 6 within the argument, and a positive constant 4 following the argument would select F as the correct comparison item in its standard form or D as the correct comparison item in its factored form.
Identifying Standard Arguments
After the participant responded to the 10 graph-to-formula comparisons, the computer interrupted the program with the following message: “Please stop and contact the experimenter. OK?” After being summoned, the experimenter gave the participant a brief statement regarding the types of equations preferred by mathematicians and others working in related academic areas. While pointing to a graph and its equation within a precalculus textbook (Sullivan, 2002), the experimenter stated,
Generally, standard formulas of graphs are considered to be more elegant and sophisticated since they contain fewer terms and operations. In the next part of the experiment, there could be more than one form of the correct answer on some tests. Mathematicians try to identify equations in their standard form if they are available.
The participants then clicked “OK” on the input box of the computer screen and proceeded to respond to another series of 10 novel graph-to-formula comparisons in which two of the comparison items were correct. Again, one of the correct answers was in standard form and the other was in factored form.
Identifying Factored Arguments
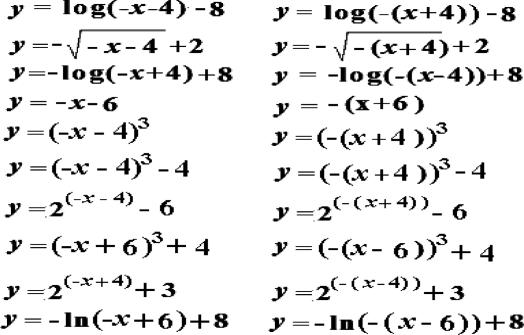
After the participant responded to the set of 10 graph-to-formula comparisons, the program again interrupted the testing procedure by displaying the message, “Please stop and contact the experimenter.” After being summoned, the experimenter gave the participant the following revised statement regarding the experimental contingencies: “This time you can double your earnings. We will give you 20 cents each time you identify the correct formula in its factored form.” This phase entailed 10 more tests of graph-to-formula relations with two mathematically correct equations within each set of six comparisons. Again, one of the two correct equations in the array of comparisons was the standard form and the other was the factored form. At the conclusion of the 10th test, the program ended, and the participant was debriefed and reimbursed according to the number of comparison items correctly identified during the assessment of all novel relations. Figure 5 illustrates the first 10 formulas used in assessing novel graph-to-formula relations, displayed in standard and factored forms. The remaining 20 formulas were variations of the same types of formulas listed in this figure.
Figure 5. The first 10 formulas as displayed in standard (left) and factored forms (right).
Two additional similar sets of 10 formulas in standard and factored forms were used during the experiment.
Results
One of the participants made a series of errors during the MTS training procedure. She was reexposed to training five times, after which the computer automatically exited her from the program. She was debriefed, compensated, and excused from the study. A 2nd participant was interrupted during her first exposure to the training sequence and was unable to return due to a scheduling conflict. The remaining 8 participants completed the MTS training procedure in fewer than five exposures. Table 1 shows the number of required exposures for each participant to complete the training of all A-B and B-C relations.
Table 1. Number of Training Exposures Required to Attain Mastery.
| Participant | A1-B1 | B1-C1 | A2-B2 | B2-C2 | A3-B3 | B3-C3 | A4-B4 | B4-C4 | Total |
| 1 | 2 | 2 | 2 | 2 | 1 | 1 | 1 | 1 | 12 |
| 2 | 3 | 3 | 3 | 3 | 3 | 3 | 3 | 1 | 22 |
| 3 | 3 | 3 | 3 | 3 | 3 | 1 | 1 | 1 | 18 |
| 4 | 2 | 2 | 2 | 2 | 2 | 2 | 1 | 1 | 14 |
| 5 | 1 | 1 | 1 | 1 | 1 | 1 | 1 | 1 | 8 |
| 6 | 3 | 3 | 2 | 2 | 2 | 2 | 2 | 2 | 18 |
| 7 | 2 | 2 | 2 | 2 | 2 | 1 | 1 | 1 | 13 |
| 8 | 3 | 3 | 3 | 3 | 2 | 2 | 2 | 2 | 20 |
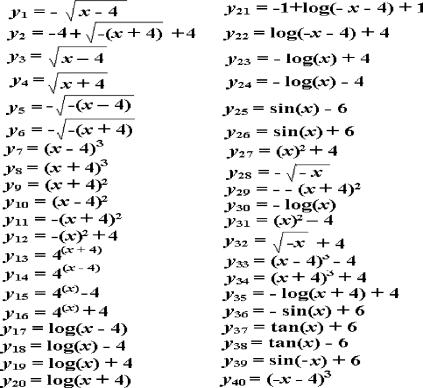
Figure 6 shows the 40 probe formulas employed in the test of novel formula-to-graph relations. The subscripts of y identify the sequence in which these formulas were presented by the computer program. For example, y20 = log(x + 4) was the 20th item given in the assessment of novel formula-to-graph relations. All but one of these test items are identical to those used in the Ninness, Rumph, McCuller, Harrison, et al. (2005) study.
Figure 6. The 40 probe formulas employed in the test of novel formula-to-graph relations.
The subscripts of y identify the sequence in which these formulas were presented by the computer program.
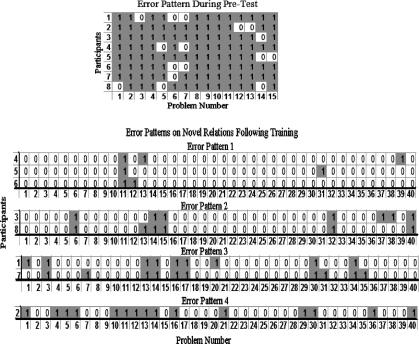
The top of Figure 7 shows the pretest error patterns of our eight participants on 15 formula-to-graph test items. Although the first 15 items in the pretest were reemployed, all the comparison items were randomized during the computer-interactive test of novel relations that followed MTS training. Items 16 through 40 were composed of 25 novel formulas. Participants were not exposed to any of these formulas (or their graphs) during any part of their training or pretraining. Pretest results appear to confirm that the participants were unfamiliar with the types of formula-to-graph relations used in this experiment.
Figure 7. The top block shows the correct and incorrect responses on the pretest.
Problem numbers are listed along the x axis for each of the 8 participants. Accurate responses contain the digit 0; errors are shaded blocks containing 1. The four blocks beneath show the same participants' error patterns following training and classification by error patterns.
Error Pattern 1 includes 3 participants who demonstrated above 92.5% accuracy during the assessment of novel stimulus relations. All 3 failed to respond correctly to the 11th test item (y11 in Figure 6), which included a leading −1 coefficient before the argument of a square function. These participants shared no other common errors in the testing sequence.
Error Pattern 2 shows 2 participants who correctly responded to the novel mathematical relations with an accuracy level at or above 82.5%. They shared errors on Novel Test Items 6, 14, 15, 32, and 40. Item 6 required identification of a graph when its formula included a negative square root with a negative argument. Item 14 involved a novel exponential equation containing the number 4 in the base and exponent. Item 15 was very similar but involved an exponential equation containing the number 4 in the base and a constant 4 subtracted outside the argument. Item 32 involved a square root function with a negative argument and a constant 4 added outside the argument. Item 40 addressed a novel cube function in standard form. This function included a leading negative coefficient of x and a negative constant 4 inside the argument. This item was also missed by 1 other participant, who was not classified in this error pattern.
Error Pattern 3 shows 2 participants who made several errors consistent with those seen in Error Pattern 2. These participants also missed Item 16, which was arranged in a similar exponential format. In addition, both participants failed to correctly identify the novel formula-to-graph relation in Items 3, 16, 17, 30, and 34; however, there do not appear to be any unique or distinguishing characteristics regarding these test items. Participants in this error pattern correctly identified novel mathematical relations with an accuracy level at or above 75%. Surprisingly, all of the participants in Error Patterns 1, 2, and 3 correctly identified Item 29, which included a double negative sign preceding the argument of a square function.
Error Pattern 4 includes only 1 participant, who showed more difficulty responding to the novel formula-to-graph relations than the other participants. This participant made errors consistent with those of other participants and several other errors that defied classification with other participants. Nevertheless, she did correctly identify 62.5% of the novel formula-to-graph relations. Table 1 shows that she required more training exposures than any of the other participants to obtain mastery. Other than this participant, there appears to be very little correspondence between the number of exposures required to reach the mastery criteria and the number of errors that occurred during the assessment of novel relations.
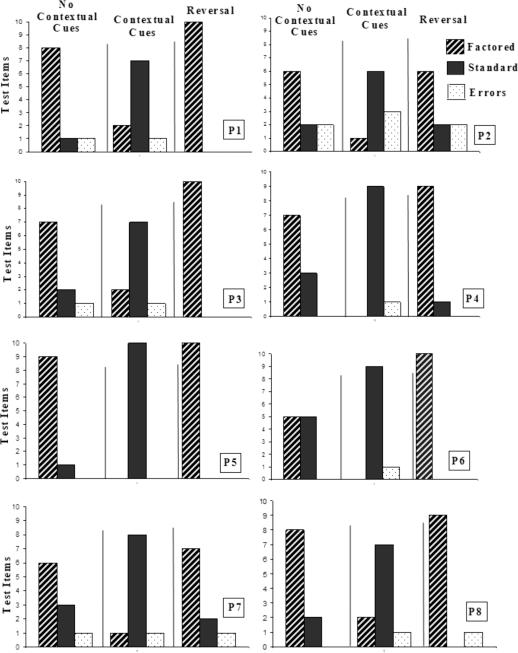
Thirty additional test screens (41 to 70) assessed transformation of novel graph-to-formula relations. These screens contained two correct formulas in the array of six comparisons. For each array of comparisons, one correct formula was presented in standard form and the other in factored form. Thus, for any given test, the probability of being correct was approximately 33%; we did not attempt to categorize these outcomes by analyzing error patterns. The first 10 graph-to-formula tests were given directly after the tests of novel formula-to-graph relations. Participants were not informed that we had included two forms of correct formulas on each test screen (as shown in Figure 4). Figure 8 shows that 7 of the 8 participants tended to select formulas in their factored form during the first 10 novel graph-to-formula relations. Participant 6 correctly responded to all 10 tests, selecting five formulas in factored form and five in standard form. Only Participant 2 demonstrated more than one error during these tests of novel graph-to-formula relations.
Figure 8. Participants tended to select formulas in their factored form during the first 10 novel graph-to-formula relations.
All 8 participants tended to shift their selection preferences in favor of the standard forms of the formulas following the manipulation of rules suggesting that mathematicians favored formulas expressed in their standard form. This trend shifted when the experiment indicated that reinforcement would be doubled for identifying formulas in their factored form.
After responding to the 10th test screen in this series, the computer displayed a message indicating that the participant was to stop and contact the experimenter, who provided contextual cues in the form of rules. Here, participants were informed that mathematicians had a distinct preference for formulas expressed in standard form; subsequently, all 8 participants demonstrated a conspicuous shift toward selection of formulas in standard form. However, 5 of the participants still selected two or fewer formulas in their factored form. Only Participant 2 made more than one error during these tests.
This trend shifted when the experimenter indicated that reinforcement would be doubled for identifying formulas in their factored form. During the final 10 tests, only 3 participants made errors and 5 of the participants selected factored formulas exclusively. In general, formula selection was consistent with the contextual cues provided by the experimenter. Participants averaged 53 min (range, 43 to 67 min) to complete training, MTS testing, testing of novel formula-to-graph relations, and testing of novel graph-to-formula relations.
Discussion
The current results replicate and extend those of our earlier investigations of the relating of mathematical formulas to mathematical equations (Ninness, Rumph, McCuller, Harrison, et al., 2005; Ninness, Rumph, McCuller, Vasquez, et al., 2005). After completion of training, participants were exposed to 40 novel formula-to-graph tests and 30 novel graph-to-formula tests. Of the 8 participants who completed the MTS training sequence, 7 demonstrated substantially improved performance in identifying novel formula-to-graph relations. Then, participants were exposed to a series of 10 novel graph-to-formula tests. In each trial, six comparison formulas included one correct version of the equation in factored form and one correct version in standard form. Our data suggest that participants tended to select equations in their factored form. This outcome is not especially surprising in that the factored forms of these equations require fewer operations to derive the transformation of graphs of functions.
In the next stage, we manipulated two different contextual functions. First, we gave the participants a brief lecture regarding the mathematical importance of being able to recognize equations in their standard form and subsequently assessed their performance with 10 more tests of novel graph-to-formula relations. Here, participants demonstrated a shift in preference and tended to select comparison equations in their standard form. Then, we provided contradictory instructions for the final 10 test items, with increased financial reward contingent on identifying formulas in their factored form. Specifically, participants received 20 cents per correct problem for identifying the factored form of the mathematical relations (10 cents for the standard form). Participants exhibited a systematic preference for factored forms of the comparison equations. Results confirm that participants changed their formula preferences in accordance with the contextual functions that were in effect.
Shifting Formula Preferences
Given that graphed and factored formulas were paired during B-C training, selecting a standard formula in the presence of a graph entailed more complex combinatorial relations than selecting a factored formula. Therefore, participants' initial preference for factored forms of the formulas is not surprising. However, attention should be given to the notable shift in preferences in favor of the more evasive standard form of the formulas when given specific rules stating that standard formulas of graphs are considered to be more elegant and sophisticated. Likewise, the fact that participants once again shifted their preferences when given rules informing them that they could double their earnings by simply identifying the correct formula in its factored form merits consideration.
Just as preference for large versus small coins may change in accordance with the currency rules established across different countries, so, too, might a student's preference for particular types of mathematical formulas alter in accordance with the rules established across experimental or real academic settings. Indeed, there are many instructors of advanced mathematics classes who would disapprove of expressing formulas in factored form (despite the fact that the factored forms might be more explanatory).
This begs the question as to whether verbal rules are sufficient to constitute a form of contextual control. It has been argued that once a repertoire of relational framing has been established, relational frames and networks can then function as contextual cues for relational framing itself (e.g., D. Barnes-Holmes et al., 2001). The finding that a transformation of function occurs under the control of a rule (i.e., relational network) is consistent with this argument. These data, particularly the shifts in preference from factored to standard and back to factored equations, demonstrate a transformation of stimulus functions in the context of a mathematical relating relations task. Stewart, Barnes-Holmes, Roche, and Smeets (2002) reported a broadly similar effect, but in the context of a basic experimental procedure that did not articulate directly with an educational, or indeed any, applied behavior-analytic concerns. The extent to which our participants came under the immediate and flexible control of contextual cues in the form of rules regarding the value of standard formulas [e.g., y = −ln(−x + 6) + 8] or factored formulas [e.g., y = −ln(−(x − 6)) + 8] demonstrates how easily such rules may alter newly established complex repertoires. Whether or not participants selected the factored or standard versions of the correct answers depended not only on the newly derived repertoires for graph-to-formula relations but also on verbal rules describing the changing value of particular types of formulas across experimental conditions.
The transformation of stimulus functions has been demonstrated many times in the laboratory environment (e.g., Stewart et al., 2002); however, in the laboratory, contextual control is typically established using novel arbitrary stimuli (but see Kohlenberg, Hayes, & Hayes, 1991, who employed gender-specific names as contextual cues). In the current study, we used natural language as a means for establishing contextual control. The finding that a transformation of function occurs under the control of a rule (i.e., relational network) is consistent with our view that once a repertoire of relational framing has been established, relational frames and networks can then function as contextual cues. Insofar as this view is correct, there may be considerable benefit in conducting further studies in which natural language and RFT training procedures are intermingled. Doing so will allow researchers to determine if, and to what extent, the RFT approach to complex human behavior is valuable in producing greater prediction and influence in applied or natural settings.
If our participants had learned simply to identify four three-member classes composed of formulas and graphs in the same manner employed in laboratory arrangements using completely arbitrary shapes or nonsense syllables, then we might expect less robust performance levels in tests of novel mathematical relations. However, the formula-to-graph and graph-to-formula relations identified by participants in this study were not directly comparable and allowed participants to identify networks of relations extending from the exemplars provided during training. Our view, therefore, is that participants were not relating samples and comparisons as unitary stimuli but were relating relations contained in the formulas to the relations found in the graphs. Consequently, it would be overly simplistic to argue that the current data could be described simply in terms of four three-member equivalence classes (see Hayes & Barnes, 1997, for a related discussion).
Multiple Exemplars in Mathematics
Multiple-exemplar training and derived transformation of functions have produced a series of impressive results with children across a wide range of skills (e.g., Y. Barnes-Holmes, Barnes-Holmes, Roche, & Smeets, 2001), and perhaps it is not surprising that such methods produced similar effects in training mathematical relations. Nevertheless, multiple-exemplar training procedures that employ a wider range of factoring techniques in mathematics require more extensive investigation. For example, as noted in Ninness, Rumph, McCuller, Harrison, et al. (2005), a quadratic function may be expressed as y = x2 − 8x; however, in this form, the equation does not immediately lend itself to graphing. Factoring (completing the square) allows one to obtain y = (x − 4)2 − 16. This version of the formula increases the likelihood that a participant who has learned to identify formula-to-formula and formula-to-graph relations, by way of the above experimental exercises, may also identify y = (x − 4)2 −16 as a graph that shifts horizontally to the right by 4 units and vertically 16 units.
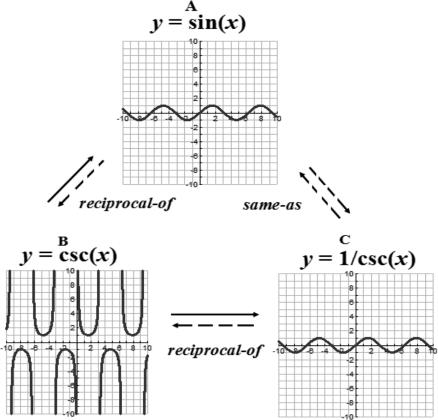
As alluded to earlier, the concept of relational frames indicates that derived relations that could address a virtually infinite number of diversified relations within a network of mutually entailed and combinatorially entailed relations such as same as, greater than, less than, opposite of, inverse of, or reciprocal of. In our laboratory, we have recently explored reciprocals functions in which, given that A is the reciprocal of B and B is the reciprocal of C, C same as A and A same as C are derived as combinatorially entailed. For example, a function such as y = sin(x) has a reciprocal of cosecant function, y = csc(x), and the graphs of these functions generate lines going in different directions along the coordinate axis. Taking the reciprocal of the cosecant function, we obtain y = 1/csc(x). Here, the reciprocal of a reciprocal is combinatorially entailed such that y = sin(x) is the same as y = 1/csc(x), and the graphs of these functions appear precisely the same as they form a Pythagorean identity (see Figure 9 for an illustration of the equations and their respective graphical functions). Note that only the formulas in Figure 9 actually serve as samples and comparison items within our training protocols; however, the graphs below each formula help to illustrate the topographic changes produced by the respective formulas within the relational network. We are developing several programs on our experimental Web site to train these types of reciprocal functions (see www.sfasu.edu/hs/TransSinCosCscSec06.html as one illustration of this protocol in progress). Indeed, preliminary findings using similar types of RFT protocols are most promising (Ninness et al., 2006). Moreover, multiple-exemplar training in our laboratory has shown that students who had difficulty learning transformations of graphs of functions were able to acquire such relations following relatively brief MTS training.
Figure 9. The function y = sin(x) has a reciprocal of cosecant function y = csc(x).
Taking the reciprocal of the cosecant function, y = 1/csc(x) is obtained, and in this example, the reciprocal of a reciprocal is combinatorially entailed and y = sin(x) is the same as y = 1/csc(x).
As contextual cues in the form of new mathematical rules are incorporated into a relational network, most students only require exposure to a minimal number of exemplars consistent with precise rules to derive and respond appropriately to many more detailed and complex mathematical relations. We anticipate that these procedures may contribute to the development of more sophisticated training platforms that permit users to derive complex mathematical relations in less time and with greater accuracy. As another variation on this theme, Binder (1996) demonstrated that applying frequency-building methods to components in an analogue of stimulus equivalence experiments produced improved acquisition rates during MTS procedures. Similar outcomes have been demonstrated repeatedly in precision teaching studies (e.g., Van Houten, 1980). Frequency-building procedures could be incorporated into our software as we develop more advanced versions of our training protocols.
Caveats
As in our earlier research in this area, this study did not attempt to isolate the influence of the pretraining lecture from that of the computer-interactive MTS training procedures. Given that our participants were relatively naive regarding graphing techniques as they applied to the coordinate system, some introductory discussion was necessary for them to interact with the training and testing system. With the results from this study and those of our previous investigations, it is becoming increasingly obvious that particular entry-level skills are required to initiate training on such platforms. Moreover, we are not suggesting that these procedures constitute a stand-alone instructional system for training all of the complexity of mathematical functions. It does suggest, however, that having learned to match factored and standard formulas and having learned to identify the graphs of these functions with a limited number of basic exemplars, participants derived a much wider array of more complex and diversified formula-to-graph as well as graph-to-formula relations.
Much of the current pedagogical emphasis in U.S. high school and college mathematics instruction is directed at facilitating students' discovery of preexisting mathematical concepts (Biggs & Moore, 1993). From kindergarten math (e.g., Macmillan, 1990) through calculus (e.g., Dubinsky & Schwingendorf, 1991), learners are encouraged to uncover commonalities and differences in their cognitive schema as they encounter all manner of mathematical challenges. From this perspective, students construct their own knowledge of mathematical relations and discover principles for themselves (Slavin, 2006). Notwithstanding the pedagogical emphasis in math education, the current lack of fluency in fundamental math skills has now saturated substantial proportions of the postsecondary population, with more than one in three college students required to enroll in remedial math before being permitted take college-level courses (Steen, 2003).
One might fairly question whether a technology based on derived relational responding can play a role in addressing such pervasive deficits. Clearly, we have not yet demonstrated in any of our research to date that a history of reinforced relational responding is superior to the more traditional forms of math instruction, nor have we yet published evidence that a history of multiple-exemplar training is more effective or efficient than training all possible mathematical relations directly. Nevertheless, many behavior analysts are focusing on the development of specific instructional strategies that employ multiple-exemplar training as it applies to the critical features among relations in mathematics. Used in conjunction with a well-designed mathematics curriculum, we believe that an MTS approach to mathematical relations might be adapted to traditional modalities of instruction. Lynch and Cuvo (1995) as well as Leader and Barnes-Holmes (2001) have shown similar types of outcomes with different populations and different types of exemplars. With a current emphasis on basic trigonometric functions, we are attempting to develop and deploy a Web-based beta version of multiple-exemplar training at www.sfasu.edu/hs/NinnessTrigGraph06.html. (Note that although these links may be useful for preliminary or complementary instruction regarding amplitude and frequency of odd and even trigonometric functions, a complete MTS protocol is required to train these functions most effectively.) Pilot research in our laboratory that addresses several trigonometric relations pertaining to amplitude and frequency (as well as the reflections and shifts described in this study) suggests that multiple-exemplar training procedures can be very effective in rapidly generating a wide range of complex mathematical relations among individuals without any history in this area. Preliminary outcomes suggest that our MTS protocols produce substantially higher acquisition rates of formula-to-graph and graph-to-formula trigonometric relations than the process of directly training all possible combinations of the various math functions under consideration (e.g., Ninness et al., 2006). By expanding our current architecture to include more basic algebra, trigonometry, and precalculus relations, we hope to deploy a series of online protocols directed at facilitating the remediation of students who suffer the insidious effects of cumulative dysfluencies (Binder, 1996). Beta versions of these applications are freely available to interested users; however, a complete Web-based platform allowing us to rigorously compare multiple-exemplar training to many of the more traditional math education systems is still under development.
Appendix A
Moving from the standard form of the formula to the most conducive form of the formula, the conducive form always factors out any negative signs that may precede x.
Appendix B
Negative sign inside the radical is reflected over in the y-axis
A positive constant inside the radical or the parentheses moves the function in the opposite direction along the x-axis.
Appendix C
Footnotes
Portions of this paper were presented at the 31st annual convention of the Association for Behavior Analysis, Chicago, May, 2005.
References
- Barnes-Holmes D, O'Hora D, Roche R, Hayes S.C, Bissett R.T, Lyddy F. Understanding and verbal regulations. In: Hayes S.C, Barnes-Holmes D, Roche B, editors. Relational frame theory: A post-Skinnerian account of human language and cognition. New York: Kluwer Academic/Plenum; 2001. pp. 103–117. In. eds. [Google Scholar]
- Barnes-Holmes Y, Barnes-Holmes D, Roche B, Smeets P. Exemplar training and a derived transformation of function in accordance with symmetry. The Psychological Record. 2001;51:589–604. [Google Scholar]
- Barnes-Holmes Y, Barnes-Holmes D, Smeets P.M, Strand P, Friman P. Establishing relational responding in accordance with more-than and less-than as a generalized operant behavior in young children. International Journal of Psychology and Psychological Theory. 2004;4:531–558. [Google Scholar]
- Biggs J, Moore P. The process of learning. Sydney: Prentice Hall; 1993. [Google Scholar]
- Binder C. Behavioral fluency: Evolution of a new paradigm. The Behavior Analyst. 1996;19:163–197. doi: 10.1007/BF03393163. [DOI] [PMC free article] [PubMed] [Google Scholar]
- Dougher M.J, Markham M. Stimulus equivalence, functional equivalence and the transfer of function. In: Hayes S.C, Hayes L.J, Sato M, Ono K, editors. Behavior analysis of language and cognition. Reno, NV: Context Press; 1994. pp. 71–90. In. eds. [Google Scholar]
- Dubinsky E, Schwingendorf K. Constructing calculus concepts: Cooperation in a computer laboratory. In: Leinbach L.C, editor. The laboratory approach to teaching calculus. Washington, DC: The Mathematical Association of America; 1991. pp. 47–70. In. ed. [Google Scholar]
- Finney R.L, Weir M.D, Giordano F.R. Thomas' calculus (10th ed.) Boston: Addison, Wesley, Longman; 2001. [Google Scholar]
- Hayes S.C, Barnes D. Analyzing derived stimulus relations requires more than the concept of stimulus class. Journal of the Experimental Analysis of Behavior. 1997;68:225–233. doi: 10.1901/jeab.1997.68-235. [DOI] [PMC free article] [PubMed] [Google Scholar]
- Hayes S.C, Barnes-Holmes D, Roche B, editors. Relational frame theory: A post-Skinnerian account of human language and cognition. New York: Kluwer Academic/Plenum; 2001. [DOI] [PubMed] [Google Scholar]
- Kennedy P.A, McGowan D, Schultz J.E, Hollowell K, Jovell I. Algebra one interactions: Course 1. Orlando, FL: Holt, Rinehart and Winston; 1998. [Google Scholar]
- Kohlenberg B.S, Hayes S.C, Hayes L.J. The transfer of contextual control over equivalence classes through equivalence classes: A possible model of social stereotyping. Journal of the Experimental Analysis of Behavior. 1991;56:505–518. doi: 10.1901/jeab.1991.56-505. [DOI] [PMC free article] [PubMed] [Google Scholar]
- Kohonen T. Self-organizing maps (3rd ed.) Berlin, Germany: Springer-Verlag; 2001. [Google Scholar]
- Lane S.D, Clow J.K, Innis A, Critchfield T.S. Generalization of cross-modal equivalence classes: Operant processes as components in human category formation. Journal of the Experimental Analysis of Behavior. 1998;70:267–279. doi: 10.1901/jeab.1998.70-267. [DOI] [PMC free article] [PubMed] [Google Scholar]
- Larson R, Hostetler R.P. Algebra and trigonometry (4th ed.) Boston: Houghton Mifflin; 1997. [Google Scholar]
- Larson R, Hostetler R.P. Intermediate algebra (3rd ed.) Boston: Houghton Mifflin; 2001. [Google Scholar]
- Leader G, Barnes-Holmes D. Establishing fractional-decimal equivalence using a respondent-type training procedure. The Psychological Record. 2001;51:151–165. [Google Scholar]
- Lynch D.C, Cuvo A.J. Stimulus equivalence instruction of fraction-decimal relations. Journal of Applied Behavior Analysis. 1995;28:115–126. doi: 10.1901/jaba.1995.28-115. [DOI] [PMC free article] [PubMed] [Google Scholar]
- Macmillan A. Constructivism in a kindergarten mathematics class. Mathematics Education Research Journal. 1990;2:12–27. [Google Scholar]
- Ninness C, Barnes-Holmes D, Rumph R, McCuller G, Ford A, Holland J, et al. Transformations of web-based trigonometric and stimulus functions: Accelerating the acquisition of derived complex mathematical relations. 2006. May, Paper presented at the 32nd annual meeting of the Association for Behavior Analysis, Atlanta, GA. [Google Scholar]
- Ninness C, Rumph R, McCuller G, Harrison C, Ford A.M, Ninness S. A functional analytic approach to computer-interactive mathematics. Journal of Applied Behavior Analysis. 2005;38:1–22. doi: 10.1901/jaba.2005.2-04. [DOI] [PMC free article] [PubMed] [Google Scholar]
- Ninness C, Rumph R, McCuller G, Vasquez E, Harrison C, Ford A.M, et al. A relational frame and artificial neural network approach to computer-interactive mathematics. The Psychological Record. 2005;51:561–570. [Google Scholar]
- O'Hora D, Roche B, Barnes-Holmes D, Smeets P.M. The Psychological Record. Vol. 52. 2002. Response latencies to multiple derived stimulus relations: Testing two predictions of relational frame theory. pp. 51–76. [Google Scholar]
- Programme for International Student Assessment. Learning for tomorrow's world: First results from PISA 2003. 2003. Retrieved December 22, 2005, from http://www.pisa.oecd.org/dataoecd/1/60/34002216.pdf. [Google Scholar]
- Rehfeldt R.A, Root S.L. Establishing derived requesting skills in adults with severe developmental disabilities. Journal of Applied Behavior Analysis. 2005;38:101–105. doi: 10.1901/jaba.2005.106-03. [DOI] [PMC free article] [PubMed] [Google Scholar]
- Saxon J.H. Algebra 1: An incremental development (3rd ed.) Norman, OK: Saxon Publishers; 1997. [Google Scholar]
- Slavin R. Educational psychology: Theory and practice (8th ed.) Boston: Allyn and Bacon; 2006. [Google Scholar]
- Smith K. Trigonometry for college students. Pacific Grove, CA: Brooks/Cole; 1998. [Google Scholar]
- Steen L.A. Issues in science and technology online. Math education at risk. 2003. Retrieved December 26, 2005, from http://www.issues.org/issues/19.4/steen.html. [Google Scholar]
- Stewart I, Barnes-Holmes D, Hayes S.C, Lipkens R. Relations among relations: Analogies, metaphors, and stories. In: Hayes S.C, Barnes-Holmes D, Roche B, editors. Relational frame theory: A post-Skinnerian account of human language and cognition. New York: Kluwer Academic/Plenum; 2001. pp. 73–86. In. eds. [Google Scholar]
- Stewart I, Barnes-Holmes D, Roche B, Smeets P.M. A functional-analytic model of analogy: A relational frame analysis. Journal of the Experimental Analysis of Behavior. 2002;78:375–396. doi: 10.1901/jeab.2002.78-375. [DOI] [PMC free article] [PubMed] [Google Scholar]
- Sullivan M. Precalculus (6th ed.) Upper Saddle River, NJ: Prentice Hall; 2002. [Google Scholar]
- Texas Education Agency, Student Assessment Division. Released tests, answer keys, and scoring guides (algebra I) 2002. Retrieved February 20, 2006, from www.tea.state.tx.us/student.assessment/resources/online/2002/eoc/algebra.html. [Google Scholar]
- Van Houten R. Learning through feedback: A systematic approach for improving academic performance. New York: Human Sciences Press; 1980. pp. 24–25. [Google Scholar]


