Abstract
The proapoptotic activity of the “BH3-only” molecule BAD can be differentially regulated by survival factor signaling. Bad-deficient mice lacking both BAD long and BAD short proteins proved viable, and most cell types appeared to develop normally. BAD did not exclusively account for cell death after withdrawal of survival factors, but it was an intermediate for epidermal growth factor- or insulin-like growth factor I-countered apoptosis, consistent with a “sensitizing” BH3-only molecule. Lymphocytes developed normally with no premalignant hyperplasia, but they displayed subtle abnormalities in proliferation and IgG production. Despite the minimal phenotype, Bad-deficient mice progressed, with aging, to diffuse large B cell lymphoma of germinal center origin. Exposure of Bad-null mice to sublethal γ-irradiation resulted in an increased incidence of pre-T cell and pro-/pre-B cell lymphoblastic leukemia/lymphoma. Thus, proapoptotic BAD suppresses tumorigenesis in the lymphocyte lineage.
The BCL-2 family of proteins constitutes a critical apoptotic control point residing immediately upstream of mitochondria. The antiapoptotic members display sequence conservation throughout all four BCL-2 homology domains (BH1–BH4). However, proapoptotic members can be subdivided into “multidomain” BAX, BAK and a “BH3-only” subset that possesses sequence homology only within this amphipathic α-helical segment, which constitutes the critical death domain (1, 2). Doubly deficient cells revealed that BAX, BAK molecules constitute requisite gateways to the mitochondria (3) as well as to the endoplasmic reticulum (4) to control apoptosis. BH3-only molecules including BAD, BID, NOXA, PUMA, BIK, and BIM operate upstream, connecting proximal death signals to the activation of BAX, BAX, which permeabilizes the outer mitochondrial membrane to release cytochrome c (5). Bid-deficient mice are resistant to pathologic Fas-activated hepatic apoptosis (6). Bim-deficient mice are defective in eliminating reactive thymocytes (7). BCL-2, BCL-XL antiapoptotic molecules can sequester BH3-only molecules in stable complexes, preventing the activation of BAX, BAK (5). A recent examination of BH3 α-helical peptides revealed evidence for two functional classes in which BAD-like “sensitizing” domains occupy antiapoptotic pockets, displacing BID-like “activating” domains to trigger BAX, BAK (8).
BAD was the first BH3-only molecule to be connected to proximal signal transduction through its differential phosphorylation in response to extracellular survival factors (2, 9). Dephosphorylated BAD appears to be active and bound to BCL-2, BCL-XL at the mitochondria, whereas, when phosphorylated on serine sites (Ser-112, -136, and -155), BAD is inactive and can be bound by 14-3-3 (9, 10). Factors including IL-3, insulin-like growth factor 1 (IGF-1), and nerve growth factor transduce intracellular survival signaling by activating kinase cascades that phosphorylate death substrates, including BAD. The phosphatidylinositol 3-kinase (PI3K) pathway, including but probably not restricted to AKT and p70S6K, mitochondrial tethered protein kinase A (PKA), and RSK have been implicated in the phosphorylation of BAD (11–16). However, most of the data implicating BAD as a prodeath molecule have been gain-of-function approaches that overexpressed WT or mutant BAD and/or the candidate kinases. Here, we generate a loss-of-function, Bad-deficient mouse to ask whether this BH3-only molecule will be singularly required for physiological cell death in vivo.
BCL-2 was discovered at the t(14;18) chromosomal breakpoint of human follicular lymphoma. Transgenic mice expressing a BCL-2-Ig minigene developed a polyclonal B cell follicular hyperplasia that progressed after 1 yr to monoclonal, large cell lymphoma in ≈15% of mice (17, 18). Reciprocally, proapoptotic BCL-2 members might function as tumor suppressors, and their loss of function might contribute to malignancy. Consequently, we chose to follow an aging cohort of Bad-deficient mice to determine whether a single BH3-only molecule could possibly function as a tumor suppressor.
Materials and Methods
Generation of the Bad Knockout. A Bad cDNA fragment was used to screen a λ murine genomic library from the 129/SvJ strain (Stratagene). Two phage clones were isolated. A 12-kb XbaI fragment from one of the clones was subcloned into pBR322. The pNTK vector was used to generate the targeting construct. A 3-kb BamHI fragment, which contains two exons 3 and 4, including the BH3 domain and the 3′ poly(A) adenylation signal, was deleted and replaced by a NeoR cassette. The transfection was carried out by using the embryonic stem (ES) cell line RW-4. Three of 110 clones of ES cell line RW-4 were identified as Bad homologous recombinants with both 5′ and 3′ probes. A NeoR probe confirmed that only one recombination event occurred. The homologous recombinant ES clones were injected into blastocysts from C57BL/6 mice. Mice were backcrossed onto a C57BL/6 background (four to eight generations) or maintained as a pure 129/SvJ strain. Animals were genotyped by Southern blot or PCR analysis. Southern blotting was performed on BamHI-digested genomic DNA by using the 3′ probe. Alternatively, the presence of the WT and the disrupted allele was determined by PCR using three oligos: (i) primer within disruption site (WT), 5′-GCT AGT TTG CGC TTG GAT A (top strand); (ii) primer downstream of disruption (54), CTG CCA TTG CCC AAG TCA CCT (bottom strand, 3′ end of deleted fragment); and (iii)5′-TCG TGC TTT ACG GTA TCG CC (top strand, 3′ end of NEO). The Bad WT product is 300 bp; the Bad disrupted band product is 600 bp.
Cell Culture, Cell Cycle, and Survival Assays. Purified lymphocytes were cultured in RPMI medium 1640 supplemented with 2 mM glutamine, 0.1% penicillin–streptomycin (pen–strep), 10 mM Hepes, 100 μM 2-mercaptoethanol, and 0–10% FBS (HyClone) as indicated. Cells were left untreated or were exposed to the indicated reagents. Cell viability was quantified at daily intervals by staining with propidium iodide (PI) plus FITC-labeled annexin V or with PI alone (PharMingen) and was analyzed by flow cytometr y on a FACSCalibur (BD Biosciences) using cellquest software. Primary murine embryonic fibroblasts (MEFs) were prepared from d-13.5 embryos and were cultured in DMEM with 20% serum. Where indicated, low-passage primary MEFs were cultured in serum-free, IGF-1-containing media for 12 h before additional death stimuli were added. B220+ and CD4+ lymphocyte populations were isolated by magnetic cell sorting using MACS separation columns (Miltenyi Biotec, Auburn, CA). For thymidine incorporation, 1 μCi (1 Ci = 37 GBq) of [3H]thymidine was added per well for the final 12 h of a 60-h culture, and incorporation was measured by scintillation counting.
Spectral Karyotyping (SKY)/Comparative Genomic Hybridization (CGH). For SKY analysis, metaphase chromosomes were prepared from cells from manually dissociated lymphoid samples, which were cultured overnight in CHANG media (Irvine Scientific) in the presence of growth factors (IL-2 and IL-7) and Colcemid. The cells were collected the next day, were swelled gently in a hypotonic KCl solution, and were fixed in methanol/acetic acid (3:1). At least six metaphases were analyzed from each sample. Whole chromosome paints (Spectral Imaging, Carlsbad, CA) were used per the supplier's recommendations. Images were acquired with an Olympus microscope and Applied Imaging (Santa Clara, CA) genus software. Chromosome aberrations were evaluated in splenic B and T cells from three pairs of previously irradiated (400 rad; 1 rad = 0.01 Gy) Bad+/+ and Bad–/– mice of 8–15 months of age. T and B cells were activated with anti-CD3, anti-CD28 (24 h), and anti-IgM with IL-4 (48 h), respectively. Metaphase chromosomes were stained by using a trypsin–Giemsa banding technique, and 20 metaphase cells were analyzed per culture. For CGH, genomic DNA was extracted from primary tumors. DNA labeling, hybridization, and detection were performed on cDNA-based microarrays as described (Agilent Technologies, Palo Alto, CA). More details can be found in Supporting Materials and Methods, which is published as supporting information on the PNAS web site, www.pnas.org.
Results
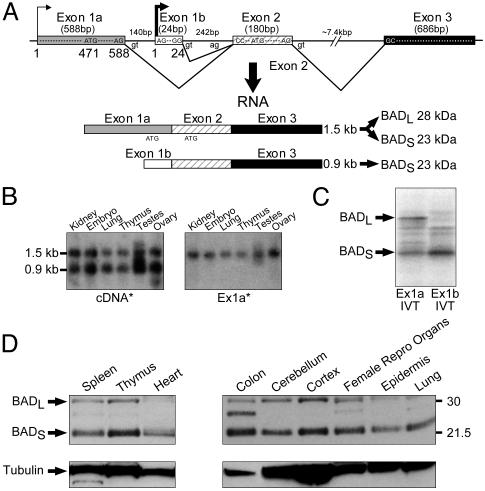
Alternative Transcription Initiation and Translation Start Sites Result in BAD Long and Short Murine Proteins. The murine Bad genomic locus was further characterized, and its transcription initiation and translation start sites were mapped (Fig. 1). Bad cDNAs varied at their 5′ end, reflecting the use of alternative exon 1a versus 1b (Fig. 1 A). Primer extension analysis (data not shown) confirmed alternative transcription initiation sites within exons 1a and 1b as denoted in Fig. 1 A. Two Bad mRNA species of 1.5 and 0.9 kb corresponded to the use of exon 1a versus 1b, respectively (Fig. 1B). Exon 2 possessed an ATG translation start codon with a Kozak consensus sequence (Fig. 1 A), and in vitro coupled transcription/translation revealed that exon 1b containing a 0.9-kb transcript resulted in a 23-kDa BAD short protein (BADS) (Fig. 1C). In contrast, the longer, 1.5-kb transcript possessed an additional ATG translation start site in exon 1a, and in vitro coupled transcription/translation indicated that either can be used, resulting in a 28-kDa BAD long protein (BADL) as well as BADS (Fig. 1C). Western blot analysis of cellular lysates from WT mice revealed that most tissues expressed substantial BADS levels, whereas BADL levels were more variable (Fig. 1D). Of note, exon 1a is not conserved in the human genome, and we have detected only the BADS mRNA and protein in humans (data not shown).
Fig. 1.
The murine locus encodes BADL and BADS. Alternative transcription initiation and translation start sites result in 28-kDa BADL and 23-kDa BADS. (A) Alternative first exons result in two Bad mRNA species. (B) Northern blot analysis with a Bad cDNA probe confirms two mRNA species in which the 1.5-kb mRNA contains exon 1a (Ex1a). (C) In vitro coupled transcription/translation indicates that exon 1a containing mRNA results in BADL and BADS, whereas exon 1b containing mRNA results in BADS. (D) Western blot analysis of BADL and BADS.
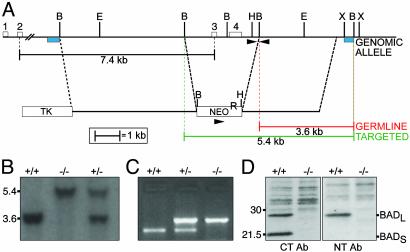
Generation of Bad-Deficient Mice. We constructed a Bad targeting construct that deleted a genomic fragment possessing exon 3, which contains the BH3 domain, and exon 4, which contains the poly(A) adenylation site, and substituted a neomycin resistance gene, NeoR (Fig. 2A). Chimeric mice from two independent homologous recombinant embryonic stem cell clones transmitted the disrupted allele through the germ line. This transmission was confirmed by Southern blot analysis using probes external to both the 5′ and 3′ ends of the construct (Fig. 2 A and B). Southern blot- or PCR-based genotypes revealed that mice heterozygous (+/–) and homozygous (–/–) for the disrupted Bad allele were viable and represented at Mendelian frequency (Fig. 2 B and C). Western blot assessment of thymocyte cellular extracts using both an anti-N-terminal and an anti-C-terminal BAD Ab confirmed that Bad–/– mice lacked both BADL and BADS (Fig. 2D). Moreover, protein levels of other BCL-2 family members were not altered in Bad-deficient mice (Fig. 7, which is published as supporting information on the PNAS web site). Bad–/– mice grow to adulthood and are externally indistinguishable from WT mice, and the weight and histology of their organs indicate no gross developmental abnormalities in spleen, thymus, brain, heart, liver, lungs, or kidneys. One consistent developmental defect resided in testes. Although Bad–/– male mice were fertile, their seminiferous tubules demonstrated prominent multinucleated giant cells (Fig. 8, which is published as supporting information on the PNAS web site).
Fig. 2.
Disruption of the murine Bad gene. (A) A deletional targeting construct of the murine Bad gene removes exons 3 and 4, including the BH3 domain, replacing it with a NeoR cassette. Restriction enzyme sites, probes for Southern blot analysis (blue boxes), and primers for PCR analysis (arrowheads) are indicated. B, BamHI; E, EcoRI; H, HindIII; X, XbaI. (B) Southern blot analysis of BamHI-digested genomic DNA from mouse tails using the 3′ external probe. (C) PCR assay distinguishes the WT from the targeted allele and genotypes of Bad+/+, Bad+/–, or Bad–/–. (D) Western blotting of BAD protein in Bad+/+ or Bad–/– thymocyte extracts. Neither BADL nor BADS was detected in Bad–/– tissues from the targeted animal by using Abs against C-terminal or N-terminal (C20 or N20, respectively; Santa Cruz Biotechnology) BAD.
B and T Lymphocyte Development. Other knockout mice of BCL-2 family members often demonstrate abnormal development or maintenance of the immune system (19). We performed an extensive survey of lymphocyte subsets in thymus, spleen, and bone marrow over the lifetime of Bad-null mice (Fig. 9, which is published as supporting information on the PNAS web site). Thymocyte subsets, including the four stages of double negative (CD4–8–), double positive (CD4+8+), and single positive (CD4+ or CD8+) cells, were normal. Examination of bone marrow revealed normal B cell subsets including pre-/pro-B (B220+ and CD43+), pro-B (B220+, CD43+, and CD19+), and pre-B through mature B (B220+ and CD19 plus IgM+). Moreover, spleen populations of mature T cells were normal, as were B cells, including type I/II subsets based on surface levels of IgM/IgD and CD21/CD23. In addition, no premalignant lymphocyte hyperplasia occurred with aging, and there was no evidence for autoimmunity.
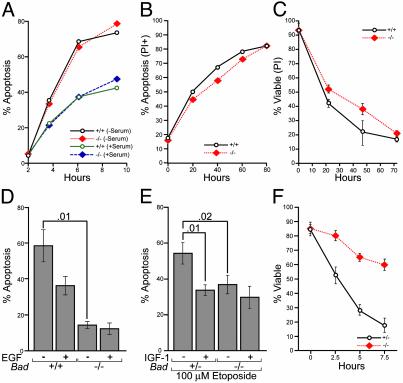
Cell Death After Withdrawal of Survival Factors. We withdrew serum from cultured thymocytes as a measure of “death by neglect.” Bad–/– thymocytes did not prove resistant to serum withdrawal (Fig. 3A). Purified splenic B and T cells cultured in vitro in serum, but no exogenous cytokines, showed similar death rates for Bad–/– and Bad+/+ cells (Fig. 3B; data not shown). Thymocyte responses to dexamethasone (5 μM), tumor necrosis factor (TNF)-α (10 ng/ml), and cycloheximide (1 μg/ml) or staurosporine (1 μM) proved normal. Bad-deficient thymocytes did display a modest, but consistent, delay in the course of death after γ-irradiation (225 rad) (Fig. 3C).
Fig. 3.
Survival analysis of Bad–/– cell populations. (A) Thymocytes were cultured with or without serum. (B) Purified splenic B cells from Bad+/+ and Bad–/– mice were cultured in the presence of 10% serum. Apoptosis was monitored by annexin V staining and propidium iodide (PI) exclusion. (C) Thymocytes were treated with γ-irradiation (225 rad), and cell survival was quantified by PI staining and flow cytometry (data are the mean ± 1 SD of five experiments). (D) Bad+/+ and Bad–/– mammary epithelia cultures were established in serum-, EGF-, and insulin-containing media. Media were replaced with serum-free DMEM/F12 either with or without 5 ng/ml EGF for 5 h. Cells were harvested and apoptosis was quantified by examining nuclear morphology after staining with Hoechst 33258. Data are the mean ± 1 SD of four experiments; P values are indicated. (E) Bad+/– and Bad–/– primary MEFs were treated with 100 μM etoposide in the presence or absence of IGF-1 (50 ng/ml). Cell death was quantified by annexin V staining at 5 h postetoposide (data are the mean ± 1 SD of three experiments; P values are indicated). (F) Primary MEFs in serum-free media were treated with anti-Fas Ab (200 ng/ml) and cycloheximide (200 μg/ml), and death was assessed by Hoechst staining (data are the mean ± 1 SD of three experiments).
Epithelial sites also express BAD highly (20, 21), warranting an examination of their reliance on BAD for apoptosis after withdrawal of survival factors. Bad-deficient mammary epithelial cells are significantly protected by survival factors when establishing cultures (Fig. 3D). Of note, withdrawal of epidermal growth factor (EGF) increased death of WT cells, but Bad-null cells proved resistant. Thus, EGF can counter apoptosis in Bad+/+, but not Bad–/–, mammary cells (Fig. 3D).
Bad–/– and Bad+/+ MEF cell lines displayed comparable apoptosis in response to withdrawal of survival factors. We next examined whether the withdrawal of survival factors that dephosphorylate and activate BAD might sensitize WT, but not Bad-deficient, cells to subsequent apoptotic stimuli. In response to treatment with etoposide, the removal of IGF-1 increased cell death only if BAD was present, but not in Bad-deficient cells (Fig. 3E). We also noted differential sensitivity to a variety of other apoptotic stimuli. This sensitivity includes the increased resistance of cells lacking BAD to the combination of extrinsic pathway Fas activation plus serum withdrawal (Fig. 3F; data not shown). Blocking survival factor signaling also augmented the death of cells expressing BAD, more than cells lacking BAD, to TNF receptor 1 (TNFR1) activation (data not shown). In total, this series of studies indicates that, on its activation by factor withdrawal, BAD sensitizes cells to a variety of apoptotic stimuli.
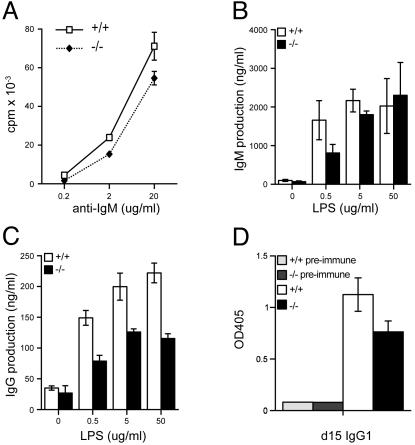
Functional Abnormalities of Bad-Deficient B Cells. In response to activation of the B cell receptor complex by anti-IgM Ab, Bad-deficient B cells demonstrated a modest, but consistent, reduction in proliferation as assessed by incorporation of [3H]thymidine (Fig. 4A). Bad–/– purified splenic B cells also displayed a reduced response to anti-CD40 Ab, but normal activation by lipopolysaccharide (data not shown). In contrast, the proliferation of and IL-2 production by Bad-deficient T cells were normal in response to T cell receptor activation by anti-CD3 Ab alone or in combination with anti-CD28 Ab costimulation (data not shown).
Fig. 4.
B cell functional analysis. (A) Purified splenic B cells were stimulated with anti-IgM, and [3H]thymidine (1 uCi per well) incorporation was measured for the final 15 h of a 60-h stimulation. Shown is IgM (B) and IgG (C) production after lipopolysaccharide (LPS) activation of purified splenic B cells in vitro. (D) In vivo production of IgG1-specific Ab to 2,4,6-trinitrophenyl (TNP). Bad+/+ and Bad–/– mice were immunized with 100 μg of TNP-ovalbumin in complete Freund's adjuvant, and sera were collected at d 7 (data not shown) and d 15. Titers of anti-TNP Ab of several isotypes were measured by ELISA using serial dilutions of sera. Results are expressed as OD405 values and are shown for a point in the linear portion of the dilution curve for IgG1-specific Ab.
Bad-deficient B cells displayed nearly normal production of IgM, but a substantially decreased production of IgG, in response to in vitro stimulation with lipopolysaccharide (LPS, Fig. 4 B and C). This difference could not be ascribed to differences in cell death or subset differentiation (22). This defect also was observed in vivo as Bad-deficient mice displayed diminished production of anti-2,4,6,-trinitrophenyl (TNP)-specific IgG1 Ab at d 7 and d 15 after immunization with the T cell-dependent antigen TNP–ovalbumin (Fig. 4D; data not shown).
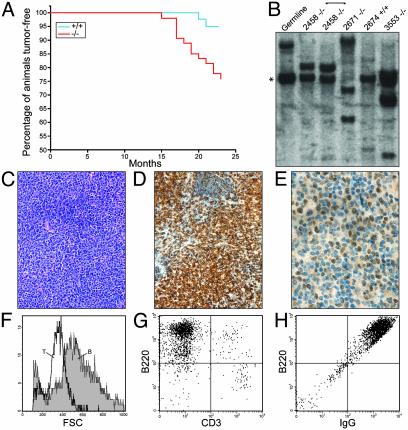
Bad-Deficient Mice Progress to B Cell Lymphoma. An initial cohort of Bad–/– mice revealed a reduced lifespan (≈80% viable) relative to Bad+/+ mice (100% viable) at 18 months (data not shown). To carefully define the cause of mortality, a matched cohort of 42 Bad+/+ and 54 Bad–/– mice on either C57BL/6 or 129/SvJ backgrounds was monitored over a 2-yr period. Bad-deficient mice displayed an increased death rate from malignancy (P = 0.003, by Fisher's exact test) (Fig. 5A; Table 1) and a shortened time to death from tumor (P = 0.001). The most prominent malignancy was, by histology, a lymphoma of diffuse large cell type (Table 1; Fig. 5C). Of 54 Bad–/– mice, 11 (≈20%) developed lymphoma, compared with 2 of 42 (4%) Bad+/+ mice (P = 0.03) (Table 1). Lymphoma most prominently involved the spleen and lymph nodes, especially the mesenteric lymph nodes. Lymphoid infiltrates were occasionally noted in other tissues, including lung and liver, but typically did not involve the bone marrow. In addition, two Bad-deficient mice developed malignant plasma cell dyscrasia (Table 1). Moreover, Bad-null mice displayed several sarcomas whose histology and marker studies were consistent with an assignment as angiosarcoma or dendritic sarcoma (Table 1). No significant increase in tumors was noted for organs outside the hematopoietic system.
Fig. 5.
Bad-deficient mice develop diffuse large B cell lymphoma. (A) Kaplan–Meier analysis of lymphoma incidence. The percentage of lymphoid tumor-free animals is plotted against time (in weeks) for Bad–/– and Bad+/+ mice. (B) Southern blotting of EcoRI-digested genomic DNA from Bad–/– lymphomas and a Bad+/+ follicular hyperplasia (lane 2674) hybridized with a JH probe reveals clonal rearrangement of the IgH gene in Bad–/– lymphomas. *, The germ-line 6.5-kb EcoRI JH fragment. (C) Hematoxylin/eosin stain of a representative Bad–/– lymphoma. (D and E) B220 (D) and BCL-6 (E) immunohistochemistry on a lymphoma section is shown. (F–H) Representative flow cytometry phenotype of cells from a Bad–/– malignant lymph node showing large B, compared with T, cell size (F), and B220 positivity (G) and surface IgG expression (H). The cells did not express markers of immature or mantle/marginal cells including CD5, CD34, and c-kit.
Table 1. Malignancies in Bad-deficient mice.
|
No. of cases
|
|||
|---|---|---|---|
| Disease | +/+ | -/- | Description |
| B lymphoma | 2 | 10 | B220+, CD19+, CD43-, BCL-6+, surface IgG or IgM, diffuse large cell |
| Malignant plasma cell dyscrasia | 0 | 2 | |
| T lymphoma | 0 | 1 | |
| Sarcoma | 0 | 2 | Angiosarcoma |
| 1 | Dendritic sarcoma | ||
| Adenocarcinoma | 1 | 2 | |
| Atypical lymphoid hyperplasia | 4 | 3 | B cell |
| 1 | 0 | Hematopoietic, nonlymphoid | |
| Hemangioma | 0 | 2 | |
| Hepatoma | 2 | 1 | |
| No. of animals evaluated | 42 | 54 | |
Ten of 11 lymphomas were predominantly large cells (Fig. 5F) of B220+ mature B cell phenotype (Fig. 5 D and G). Further phenotypic characterization supported a mature B cell phenotype for the lymphoma cells that were CD19+, CD43– and expressed either surface IgM or IgG (Fig. 5H; Table 1). The majority of the lymphomas (five of eight tested by immunohistochemistry) expressed the zinc finger transcription factor BCL-6, indicative of germinal center B cells (Fig. 5E). In total, the immunophenotypic characterization indicates a large B cell lymphoma of germinal center origin.
Clonality of the B cell lymphomas was established by the presence of clonal Ig heavy-chain gene rearrangements (Fig. 5B). Where testable, the same clonal Ig gene rearrangement pattern was detected in multiple lymphoma sites from the same mouse. In contrast, samples with a histology compatible with atypical hyperplasia from smaller lymphadenopathy, four from Bad+/+ and three from Bad–/– mice, lacked clonal rearrangements (Fig. 5B; Table 1).
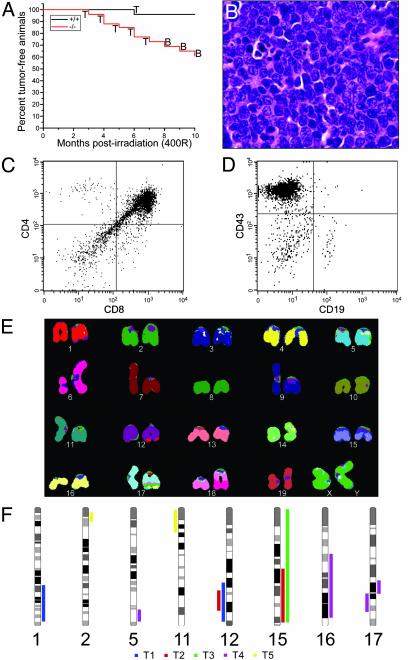
Accelerated Lymphomagenesis in Bad-Deficient Mice After Ionizing Radiation. To further assess the potential role of BAD as a tumor suppressor, we subjected Bad+/+ and Bad–/– mice to a sublethal dose of 400 rad (4 Gy) at 4 weeks of age. By 10 months after γ-irradiation, 40% of Bad–/– mice developed lymphoma as compared with 4% of Bad+/+ controls (P = 0.003) (Fig. 6A). Histologic analysis revealed a high-grade lymphoblastic leukemia/lymphoma with a high mitotic rate (Fig. 6B). The immunophenotype of the lymphomas in mice ≤7 months postirradiation was characteristic of an early thymocyte stage, CD4+CD8+ double positive, or one even less mature (Fig. 6C). Irradiated Bad-deficient mice developed B cell lineage malignancies at ≥8 months postirradiation. Immunophenotype analysis indicated pre-/pro-B cell-stage, high-grade lymphomas (Fig. 6 A and D). Spectral karyotyping and array CGH were performed on T cell lymphoblastic lymphomas. Metaphase spreads from a representative lymphoma displayed multiple chromosomal translocations including a t(6;18) and t(1;12), indicating the clonal origin of the tumor and providing evidence for genomic instability (Fig. 6E). Array CGH analysis of five γ-irradiation-induced T cell lymphoblastic lymphomas also revealed genomic aberrations, including regions of deletion and amplification (Fig. 6F).
Fig. 6.
γ-Irradiation-induced tumors in Bad-deficient mice. (A) Kaplan–Meier plot of tumor-free survival after 400 rad (4 Gy) of γ-irradiation at 4 weeks of age for Bad+/+ and Bad–/– mice. T and B represent thymocyte-origin and B cell-origin tumors, respectively. (B) Hematoxylin/eosin staining of representative pre-T cell lymphoblastic lymphoma (×40). (C and D) Cell surface marker expression of representative pre-T cell lymphoma (C) and pre-B cell lymphoma (D) is shown. Cells in D were electronically gated for B220+ events. (E) Spectral karyotyping (SKY) of Bad–/– γ-irradiation of T cell lymphoblastic lymphoma. Classification-colored chromosomes are shown. Tumor displays a t(6;18) and t(1;12), as well as a possible t(16;17). (F) Summary of array CGH analysis of five Bad–/– γ-irradiation-induced T cell lymphomas (T1–T5). Bars on the right and left sides of the chromosome ideograms represent gain and loss of genetic material, respectively. Only affected chromosomes are shown.
Discussion
This study explored the singular roles for BAD, a BH3-only apoptotic regulator that operates in survival factor pathways. Bad-deficient mice develop an increased incidence of hematopoietic malignancy principally attributable to diffuse large B cell lymphoma (DLBCL). There are relatively few mouse models that progress to DLBCL (23), and Bad-deficient mice provide a model without a clearly antecedent cellular expansion. The 5-fold-increased, ≈20% incidence is similar to the ≈15% incidence of B cell lymphomas that develop after follicular hyperplasia in BCL-2-Ig or Eu-Bcl-2 mice that overexpress an antiapoptotic binding partner of BAD (18, 24). Mice transgenic for antiapoptotic Mcl-1 or Tcl-1, which activates AKT, display cellular hyperplasia, which can progress to various lymphomas, including some DLBCLs (25). Transgenic mice expressing activated AKT (myr-AKT) in T cells also develop lymphoma, where AKT would be expected to inactivate BAD as well as other apoptotic substrates (26). In addition, mice heterozygous for PTEN, the critical inhibitory phosphatase in the phosphatidylinositol 3-kinase (PI3K) pathway, have been reported to develop lymphomas (27, 28). The immunophenotype of B cell tumors in Bad-deficient mice indicates they are uniformly mature and often express BCL-6, testifying to their traversal of the germinal center (29). The prominent involvement of mesenteric lymph nodes suggests these tumors may result from enteric antigen-driven B cell activation. Activated B cells within germinal centers undergo intense proliferation coupled with Ig heavy-chain class switching, as well as somatic hypermutation (30). Diffuse large cell lymphoma is thought to represent immortalization of this population of B cells (31). Thus, the Bad-deficient mice provide a needed model of de novo development of DLBCL.
A more generalized role for BAD in suppressing oncogenesis was provided by the emergence of earlier stage pre-T and pro-/pre-B cell lymphoblastic leukemia/lymphoma after γ-irradiation. Irradiation induces genomic instability and, secondarily, can activate B cell ecotropic retroviruses as a consequence of genetic recombination between endogenous eco- and xenotropic retroviruses in the genesis of lymphoma (32). Mice defective in p53, which induces an apoptotic response to double-stranded DNA breaks, demonstrate enhanced susceptibility to irradiation-induced tumors. PTEN+/– and GADD45–/– mice also demonstrate increased irradiation-induced tumors (26, 33, 34). A possible connection recently has been reported where p53 can regulate the transcription of PTEN, which might result downstream in activated BAD (35). As an initial assessment of whether the loss of BAD increased the frequency of chromosomal aberrations in premalignant cells, we examined metaphases from activated B or T cells obtained from mice 12–15 months after γ-irradiation (400 rad). The number of aberrations was no greater in Bad-deficient than in WT lymphocytes (Table 2, which is published as supporting information on the PNAS web site).
BAD is inactivated by phosphorylation or, reciprocally, is activated by dephosphorylation. The Bad-deficient mouse provides a critical loss-of-function test indicating that, although BAD contributes to cell death in several survival factor pathways, the absence of BAD never confers 100% protection from factor withdrawal. However, IGF-1 and EGF-1 improved the survival of cells exposed to a death signal only if BAD was present. These loss-of-function comparisons are consistent with data obtained by using BH3 domain peptides (8) and support a model in which BAD is a sensitizing BH3-only molecule that enables apoptosis mediated in cooperation with other activating BH3-only members. Of note, Bid-deficient mice, which lack an activating BH3-only member, also progress to malignancy, in this instance chronic myelomonocytic leukemia (36). BAD, although not solely sufficient to kill cells, would, on its dephosphorylation, occupy the pocket of antiapoptotic BCL-2, thus lowering the threshold for other activating BH3-only members to trigger BAX, BAK and to kill cells. Conversely, cells exposed to survival factors would elevate their apoptotic threshold by phosphorylating and inactivating BAD, which restores antiapoptotic BCL-2. Recently, a third approach generated a constitutively active BAD, which could not be phosphorylated because the three regulatory serines (Ser-112, -136, and -155) were converted to alanines in the germ line of a “knockin” mouse (37). Consistent with the observations here, most cell types in Bad3SA/3SA mice are viable, yet they demonstrate a decreased apoptotic threshold with enhanced susceptibility to otherwise sublethal levels of death signals. Thus, data from all three systems, knockout, knockin, and BH3 peptides, are remarkably coordinate in support of a model where BAD is a sensitizing intermediate through which survival factors set the threshold of susceptibility to apoptosis. Moreover, this single BH3-only molecule, which operates upstream in a signal-specific and lineage-restricted fashion, nonetheless is required to suppress lymphoid tumorigenesis.
Supplementary Material
Acknowledgments
We thank R. Bronson and J. Aster for histologic evaluations; L. Russell for evaluation of defects in spermatogenesis; D. Neuberg and S. I. Li for statistical analysis; P. Zhang for interpretation of CGH data; S. Chen-Kiang and R. Do for work on the CD40 B cell differentiation system; S. Horning for in situ hybridizations; E. Robertson and B. Patel for karyotyping; S. Wade and J. Fisher for animal care; and E. Smith for manuscript preparation. This work was supported in part by National Institutes of Health Grants P01 CA92625 and U01 CA84221. A.M.R. is the Irvington Institute Edmond J. Safra Foundation Fellow.
Abbreviations: IGF, insulin-like growth factor; MEF, murine embryonic fibroblast; CGH, comparative genomic hybridization; BADS, BAD short protein; BADL, BAD long protein; EGF, epidermal growth factor.
References
- 1.Wang, K., Yin, X. M., Chao, D. T., Milliman, C. L. & Korsmeyer, S. J. (1996) Genes Dev. 10, 2859–2869. [DOI] [PubMed] [Google Scholar]
- 2.Yang, E., Zha, J., Jockel, J., Boise, L. H., Thompson, C. B. & Korsmeyer, S. J. (1995) Cell 80, 285–291. [DOI] [PubMed] [Google Scholar]
- 3.Wei, M. C., Zong, W. X., Cheng, E. H., Lindsten, T., Panoutsakopoulou, V., Ross, A. J., Roth, K. A., MacGregor, G. R., Thompson, C. B. & Korsmeyer, S. J. (2001) Science 292, 727–730. [DOI] [PMC free article] [PubMed] [Google Scholar]
- 4.Scorrano, L., Oakes, S. A., Opferman, J. T., Cheng, E. H., Sorcinelli, M. D., Pozzan, T. & Korsmeyer, S. J. (2003) Science 300, 135–139. [DOI] [PubMed] [Google Scholar]
- 5.Cheng, E. H., Wei, M. C., Weiler, S., Flavell, R. A., Mak, T. W., Lindsten, T. & Korsmeyer, S. J. (2001) Mol. Cell 8, 705–711. [DOI] [PubMed] [Google Scholar]
- 6.Yin, X. M., Wang, K., Gross, A., Zhao, Y., Zinkel, S., Klocke, B., Roth, K. A. & Korsmeyer, S. J. (1999) Nature 400, 886–891. [DOI] [PubMed] [Google Scholar]
- 7.Bouillet, P., Purton, J. F., Godfrey, D. I., Zhang, L. C., Coultas, L., Puthalakath, H., Pellegrini, M., Cory, S., Adams, J. M. & Strasser, A. (2002) Nature 415, 922–926. [DOI] [PubMed] [Google Scholar]
- 8.Letai, A., Bassik, M. C., Walensky, L. D., Sorcinelli, M. D., Weiler, S. & Korsmeyer, S. J. (2002) Cancer Cell 2, 183–192. [DOI] [PubMed] [Google Scholar]
- 9.Zha, J., Harada, H., Yang, E., Jockel, J. & Korsmeyer, S. J. (1996) Cell 87, 619–628. [DOI] [PubMed] [Google Scholar]
- 10.Datta, S. R., Katsov, A., Hu, L., Petros, A., Fesik, S. W., Yaffe, M. B. & Greenberg, M. E. (2000) Mol. Cell 6, 41–51. [PubMed] [Google Scholar]
- 11.Datta, S. R., Dudek, H., Tao, X., Masters, S., Fu, H., Gotoh, Y. & Greenberg, M. E. (1997) Cell 91, 231–241. [DOI] [PubMed] [Google Scholar]
- 12.del Peso, L., Gonzalez-Garcia, M., Page, C., Herrera, R. & Nunez, G. (1997) Science 278, 687–689. [DOI] [PubMed] [Google Scholar]
- 13.Harada, H., Becknell, B., Wilm, M., Mann, M., Huang, L. J., Taylor, S. S., Scott, J. D. & Korsmeyer, S. J. (1999) Mol. Cell 3, 413–422. [DOI] [PubMed] [Google Scholar]
- 14.Harada, H., Andersen, J. S., Mann, M., Terada, N. & Korsmeyer, S. J. (2001) Proc. Natl. Acad. Sci. USA 98, 9666–9670. [DOI] [PMC free article] [PubMed] [Google Scholar]
- 15.Bonni, A., Brunet, A., West, A. E., Datta, S. R., Takasu, M. A. & Greenberg, M. E. (1999) Science 286, 1358–1362. [DOI] [PubMed] [Google Scholar]
- 16.Shimamura, A., Ballif, B. A., Richards, S. A. & Blenis, J. (2000) Curr. Biol. 10, 127–135. [DOI] [PubMed] [Google Scholar]
- 17.McDonnell, T. J., Deane, N., Platt, F. M., Nunez, G., Jaeger, U., McKearn, J. P. & Korsmeyer, S. J. (1989) Cell 57, 79–88. [DOI] [PubMed] [Google Scholar]
- 18.McDonnell, T. J. & Korsmeyer, S. J. (1991) Nature 349, 254–256. [DOI] [PubMed] [Google Scholar]
- 19.Ranger, A. M., Malynn, B. A. & Korsmeyer, S. J. (2001) Nat. Genet. 28, 113–118. [DOI] [PubMed] [Google Scholar]
- 20.Kitada, S., Krajewska, M., Zhang, X., Scudiero, D., Zapata, J. M., Wang, H. G., Shabaik, A., Tudor, G., Krajewski, S., Myers, T. G., et al. (1998) Am. J. Pathol. 152, 51–61. [PMC free article] [PubMed] [Google Scholar]
- 21.Gilmore, A. P., Valentijn, A. J., Wang, P., Ranger, A. M., Bundred, N., O'Hare, M. J., Wakeling, A., Korsmeyer, S. J. & Streuli, C. H. (2002) J. Biol. Chem. 277, 27643–27650. [DOI] [PubMed] [Google Scholar]
- 22.Do, R. K., Hatada, E., Lee, H., Tourigny, M. R., Hilbert, D. & Chen-Kiang, S. (2000) J. Exp. Med. 192, 953–964. [DOI] [PMC free article] [PubMed] [Google Scholar]
- 23.Morse, H. C., III, Anver, M. R., Fredrickson, T. N., Haines, D. C., Harris, A. W., Harris, N. L., Jaffe, E. S., Kogan, S. C., MacLennan, I. C., Pattengale, P. K. & Ward, J. M. (2002) Blood 100, 246–258. [DOI] [PubMed] [Google Scholar]
- 24.Strasser, A., Harris, A. W. & Cory, S. (1993) Oncogene 8, 1–9. [PubMed] [Google Scholar]
- 25.Zhou, P., Levy, N. B., Xie, H., Qian, L., Lee, C. Y., Gascoyne, R. D. & Craig, R. W. (2001) Blood 97, 3902–3909. [DOI] [PubMed] [Google Scholar]
- 26.Malstrom, S., Tili, E., Kappes, D., Ceci, J. D. & Tsichlis, P. N. (2001) Proc. Natl. Acad. Sci. USA 98, 14967–14972. [DOI] [PMC free article] [PubMed] [Google Scholar]
- 27.Podsypanina, K., Ellenson, L. H., Nemes, A., Gu, J., Tamura, M., Yamada, K. M., Cordon-Cardo, C., Catoretti, G., Fisher, P. E. & Parsons, R. (1999) Proc. Natl. Acad. Sci. USA 96, 1563–1568. [DOI] [PMC free article] [PubMed] [Google Scholar]
- 28.Suzuki, A., de la Pompa, J. L., Stambolic, V., Elia, A. J., Sasaki, T., del Barco Barrantes, I., Ho, A., Wakeham, A., Itie, A., Khoo, W., et al. (1998) Curr. Biol. 8, 1169–1178. [DOI] [PubMed] [Google Scholar]
- 29.Cattoretti, G., Chang, C. C., Cechova, K., Zhang, J., Ye, B. H., Falini, B., Louie, D. C., Offit, K., Chaganti, R. S. & Dalla-Favera, R. (1995) Blood 86, 45–53. [PubMed] [Google Scholar]
- 30.Rajewsky, K. (1996) Nature 381, 751–758. [DOI] [PubMed] [Google Scholar]
- 31.Kuppers, R., Klein, U., Hansmann, M. L. & Rajewsky, K. (1999) N. Engl. J. Med. 341, 1520–1529. [DOI] [PubMed] [Google Scholar]
- 32.Lieberman, M., Hansteen, G. A., McCune, J. M., Scott, M. L., White, J. H. & Weissman, I. L. (1987) J. Exp. Med. 166, 1883–1893. [DOI] [PMC free article] [PubMed] [Google Scholar]
- 33.Hollander, M. C., Sheikh, M. S., Bulavin, D. V., Lundgren, K., Augeri-Henmueller, L., Shehee, R., Molinaro, T. A., Kim, K. E., Tolosa, E., Ashwell, J. D., et al. (1999) Nat. Genet. 23, 176–184. [DOI] [PubMed] [Google Scholar]
- 34.Kemp, C. J., Wheldon, T. & Balmain, A. (1994) Nat. Genet. 8, 66–69. [DOI] [PubMed] [Google Scholar]
- 35.Stambolic, V., MacPherson, D., Sas, D., Lin, Y., Snow, B., Jang, Y., Benchimol, S. & Mak, T. W. (2001) Mol. Cell 8, 317–325. [DOI] [PubMed] [Google Scholar]
- 36.Zinkel, S. S., Ong, C. C., Ferguson, D. O., Iwasaki, H., Akashi, K., Bronson, R. T., Kutok, J. L., Alt, F. W. & Korsmeyer, S. J. (2003) Genes Dev. 17, 229–239. [DOI] [PMC free article] [PubMed] [Google Scholar]
- 37.Datta, S. R., Ranger, A. M., Lin, M. Z., Sturgill, J. F., Ma, Y., Cowan, C., Dikkes, P., Korsmeyer, S. J. & Greenberg, M. E. (2002) Dev. Cell 3, 631–643. [DOI] [PubMed] [Google Scholar]
Associated Data
This section collects any data citations, data availability statements, or supplementary materials included in this article.


