Abstract
The genetic architecture underlying heat resistance remains partly unclear despite the well-documented involvement of heat shock proteins (Hsps). It was previously shown that factors besides Hsps are likely to play an important role for heat resistance. In this study, gene expression arrays were used to make replicate measurements of gene expression before and up to 64 hours after a mild heat stress treatment, in flies selected for heat resistance and unselected control flies, to identify genes differentially expressed in heat resistance–selected flies. We found 108 genes up-regulated and 10 down-regulated using the Affymetrix gene expression platform. Among the up-regulated genes, a substantial number are involved in the phototransduction process. Another group of genes up-regulated in selected flies is characterized by also responding to heat shock treatment several hours after peak induction of known Hsps revert to nonstress levels. These findings suggest phototransduction genes to be critically involved in heat resistance, and support a role for components of the phototransduction process in stress-sensing mechanisms. In addition, the results suggest yet-uncharacterized genes responding to heat stress several hours after treatment to be involved in heat stress resistance. These findings mark an important increase in the understanding of heat resistance.
INTRODUCTION
High temperature is an important environmental factor that has a significant impact on reproduction and survival of organisms. Heat thus influences the distribution and abundance of species in time and space (Cossins and Bowler 1987). In most organisms, heat resistance can be improved by a mild heat hardening, which is mainly due to the induction of heat shock proteins (Hsps), whose protective role in heat resistance has been demonstrated, eg, in Drosophila melanogaster overexpressing Hsp70 (Feder et al 1996; Krebs and Feder 1998) and Hsp22 (Morrow et al 2004). Less understood is the genetic basis underlying variations in basal (ie, noninduced) heat resistance as observed both across species and within species. Although Hsps may also contribute to such variations, it is clear that the protective effects associated with Hsps come with a cost in terms of detrimental effects on growth, fertility, development, and survival (Krebs and Feder 1997; Krebs and Loeschcke 1994; Williams et al 2003). Moreover, studies performed on Drosophila indicate that the protective effect of heat hardening is sustained long after Hsp70 expression returns to prestress level (Krebs and Feder 1997; Dahlgaard et al 1998), suggesting that factors other than Hsps may contribute to protection against heat. Indications of connections between stress in general and low metabolic rate (Hoffmann and Parsons 1991) and the stress theory of aging (Parsons 1995) support this view, and it is thus likely that genes involved in basal and induced heat resistance are not necessarily the same.
D. melanogaster is a particular suitable model organism to study heat resistance, because there is a long tradition for investigation of thermal stress (Hoffmann et al 2003) and a vast amount of genetic information associated with this species. Global gene expression studies in flies have proven successful for providing new insights in various biological processes, mostly based on response to treatments, but recently also based on differences in complex phenotypic traits between selection and control lines (Toma et al 2002; Pedra et al 2004; Kristensen et al 2005, 2006). The aim of the present study has been to increase the understanding of basal heat resistance in D. melanogaster and in particular to describe characteristic changes occurring at the level of gene expression. Based on the previous findings mentioned above, it is assumed that genes other than Hsps will respond to heat resistance selection by differential regulation. Here, we have used Affymetrix Genechips to measure gene expression in flies selected for heat resistance and control flies arising from the same background population. Heat resistance was significantly increased in the selected flies as measured by survival rate following heat shock (Bubliy and Loeschcke 2005). Using 5 replicate measurements of selected vs control flies, we have found 108 genes to be up-regulated and 10 genes to be down-regulated following selection for heat resistance. These findings are supported by reanalysis of a different time series experiment (Sørensen et al 2005) with measurements taken before and after heat stress treatment in selected and control flies. Here, approximately 16% of all genes showed differential expression following selection. The results show that a substantial number of genes involved in the phototransduction process respond to heat stress selection by up-regulation. Furthermore, we point to the existence of a set of genes, induced by heat stress treatment several hours after Hsps return to prestress levels, that also respond to heat resistance selection by up-regulation. This study thus demonstrate the usefulness of investigating heat resistance using global gene expression technology and contribute significantly to the understanding of heat resistance.
MATERIALS AND METHODS
Origin of experimental flies
The selection and control lines used in this experiment originated from a mass population of D. melanogaster from different geographical regions and background that were mixed in order to increase the genetic diversity in the starting material. The mass population was created in September 2002 by mixing 600–700 flies from each of several pre-existing stocks from the laboratory. The origin of flies and the set up of the mass population is described in more detail (Bubliy and Loeschcke 2005). The population was maintained as 1 interbreeding population for 4 generations after which a number of selection regimens were established. Here, flies from 2 regimens were used (control and heat selection). Independent replicate lines were established for each selection regimen and maintained at population sizes of 300 pairs. Flies were kept under standard laboratory conditions at 25°C and a 12/ 12 hour light/dark cycle on standard agar-sugar-yeast-oatmeal medium. Flies from the heat resistance–selected regimen were heat shocked every second generation when 5 days of age. The flies were hardened for 30 minutes at 36°C and after 1-hour recovery heat-shocked for 1 hour at 38°C. The heat shock temperature was gradually increased to 38.5°C for 65 minutes between selection events to maintain selection intensity (50%) as the lines improved the resistance due to the selection. For the array experiment, the lines had passed 20 generations, ie, 10 selected generations. The flies were allowed 1 generation without selection before flies were sampled for the experiment.
Experiment design
The experiment was composed of 2 sets: set A with focus on heat resistance selection and set B with focus on heat-induced genes. In set A, gene expression was measured in 5 independent heat resistance–selected replicate lines and 5 control lines without treatment (2 × 5 chips). In set B (for further details, see Sørensen et al 2005), gene expression was measured before (−1 hour) and after (0.25, 1, 2, 4, 8, 16, 32, and 64 hours) a 36°C heat treatment for 1 hour (from −1 to 0 hour) in 2 independent heat resistance–selected replicate lines and in 2 control lines (2 × 2 × 9 chips, 4 of these chips (those at −1 hour) overlap with the measurements of set A). The data has been submitted to the Gene Expression Omnibus database with series records GSE5146 and GSE5147. Both sets were processed simultaneously, ie, flies from set B at −1 hour were frozen simultaneously with flies from set A. Each sample, consisting of 10 female flies collected from a mix of several bottles within each line and raised under standard conditions, was flash-frozen in liquid nitrogen and stored at −80°C until ribonucleic acid (RNA) extraction.
RNA extraction and hybridization
Flies from each sample were homogenized and RNA extraction and cRNA labeling was performed as described (Sørensen et al 2005). Briefly, double-stranded cDNA was prepared from 5 μg of total RNA using the SuperScript Choice System (Life Technologies), according to the manufacturer's instructions, except using an oligo-dT primer containing a T7 RNA polymerase promoter site. Biotin-labeled cRNA was prepared using the BioArray High Yield RNA Transcript Labelling Kit (Enzo). Unincorporated nucleotides were removed using RNeasy columns (Qiagen). Labeled cRNA was hybridized to Affymetrix Drosophila Genechips (version 1) as described (Dyrskjøt et al 2003). The 2 replicates of the full time series were, for capacity reasons, hybridized in 2 rounds, which was taken into account in the paired analysis, ie, measurements from 1 hybridization were not paired with measurements of the other hybridization.
Statistical analysis
Raw data was GC-RMA normalized using the Bioconductor application for R (Gentleman et al 2004). We used unpaired (set A) or paired (set B) SAM (Tusher et al 2001) on full datasets to identify differentially expressed genes. The SAM approach uses the t-test–derived statistical parameter d, which for paired data is defined as follows:
 |
where j(k) and j(−k) denote the pairing of measurements. In the present analysis, heat-selected and control flies were paired for the same hybridization group at the same time points. K denotes total number of pairings, 18 in this case, and s0 is a calculated factor set to minimize the coefficient of variation of d.
Analyses were done using the multi-experiment viewer TMeV (Saeed et al 2003). We used the EASE application (Hosack et al 2003) to correlate differentially expressed genes with functional categories defined by the Gene Ontology (GO) consortium (Ashburner et al 2000).
RESULTS
Identification of genes differentially expressed in heat resistance–selected flies
Gene expression was measured in flies selected for heat resistance and nonselected control flies using Affymetrix high-density oligo arrays. It was shown previously that selection of these flies significantly increased the survival rate following heat shock from 0.16 in control flies to 0.66 in selected flies (Bubliy and Loeschcke 2005). The experimental setup (Table 1) consists of 2 sets of measurements. Set A represents 5 replicates each of heat resistance–selected flies and nonselected control flies, and set B represents a time series experiment in 2 replicates with measurements taken before and after a mild heat stress treatment (36° for 1 h) at several time points in heat resistance–selected flies and control flies. The data represented in set B were previously analyzed for the effect of heat shock treatment on gene expression (Sørensen et al 2005) and are reanalyzed here with respect to selection effects.
Table 1.
Experiment design

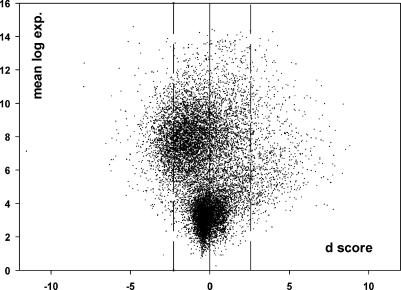
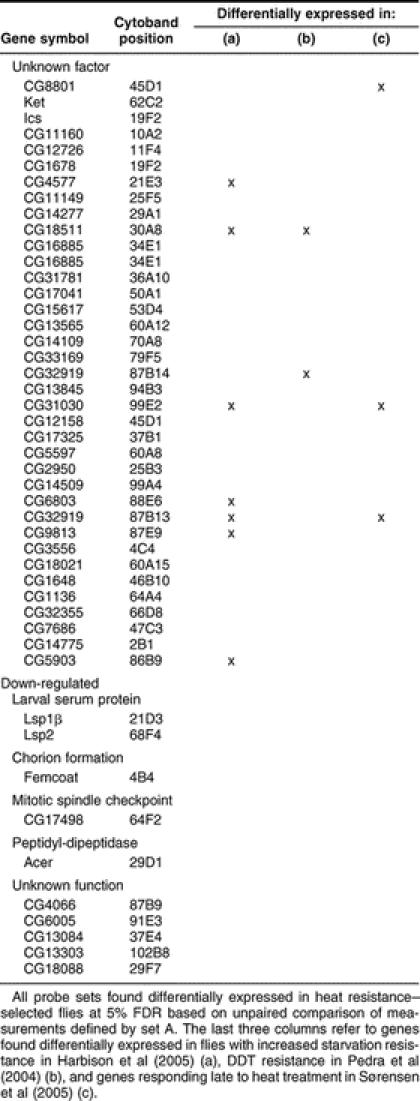
To identify genes differentially expressed in the heat resistance–selected flies, statistical analysis was applied to the data defined by set A using the SAM approach (Tusher et al 2001) which allows control of the false discovery rate (FDR). At a 5% FDR, 120 probe sets corresponding to 118 genes were differentially expressed, 108 genes were up-regulated, and 10 genes were down-regulated (Table 2). A paired SAM analysis of the measurements defined by set B confirmed this for 96 of the 108 up-regulated genes and for 6 of the 10 down-regulated genes. The much higher power obtained by the 18 paired comparisons arising from the measurements in set B (2 replicates of 9 time points measured in control and selected lines) yielded 888 up-regulated probe sets and 1333 down-regulated probe sets at a 1% FDR, corresponding to approximately 16% of all genes present on the array. Despite this, the distribution of the test statistic d of the SAM algorithm supports the finding of more up-regulated than down-regulated genes in the analysis of set A, because down-regulated probe sets have a tendency to lie much closer to the 1% FDR limit than up-regulated genes (Fig 1).
Table 2.
Genes differentially expressed in heat resistance-selected flies
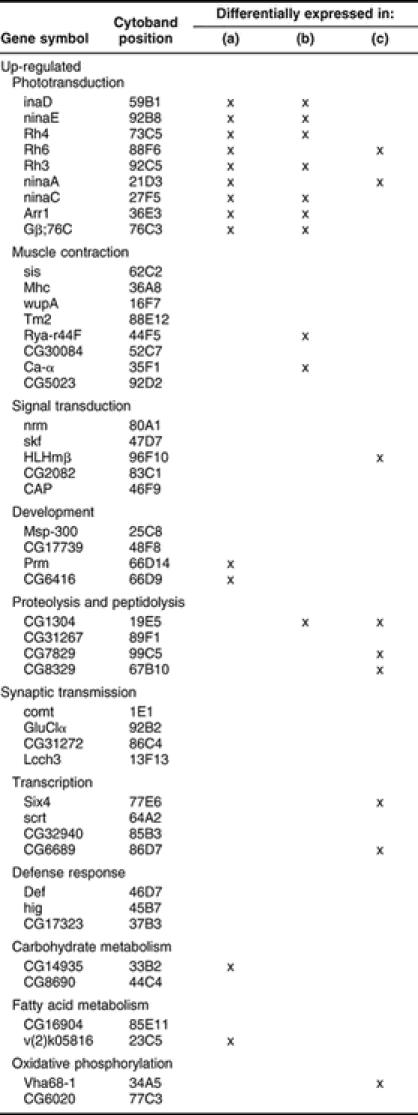
Fig 1.
Distribution of d scores for all genes. The plot presents normalized average expression values plotted against the d values obtained by the SAM algorithm (Tusher et al 2001) for all genes on the array. Each dot represents the statistical summary, based on the 18 paired comparisons of set B, for 1 gene. Dots on the outside of the 2 broken lines (d score, 2.56 and −2.28) represent genes that are considered differentially expressed at a 1% FDR level
The high confidence seen from the FDR was not associated with a dramatic increase or decrease in gene expression in the heat resistance–selected flies. Rather, most significant genes responded to the selection with minute changes of less than 2-fold magnitude. Both up and down regulated genes are located randomly throughout the genome (not shown).
Phototransduction genes are up-regulated in selected flies
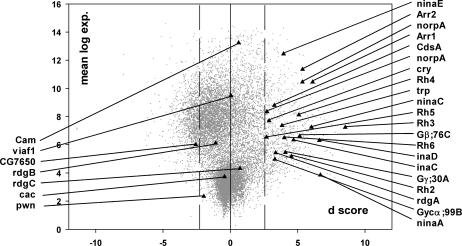
The differentially expressed genes defined by set A fall into a diverse set of functional categories (Table 2). By focusing on groups of functionally related genes as defined by the GO consortium (Ashburner et al 2000), we used the EASE application (Hosack et al 2003) to identify GO categories that have an overrepresentation of genes among the differentially regulated genes. The most overrepresented categories are related to vision, with phototransduction having the relatively highest number of significantly overexpressed genes. Nine of 27 genes in the phototransduction GO category are up-regulated in the heat resistance–selected flies (Table 2). The probability of finding this number of genes or more based on random selection of 27 genes among all genes represented on the array is less than 3 × 10⁻¹⁰ as calculated by Fisher's exact test, indicating that the phototransduction process has responded to the selection by up-regulation. For the paired analysis of set B, we found 20 phototransduction genes to lie within the 1% FDR limit of up-regulated genes (Fig 2 and supplemental Table 3). A similar low P value of 9 × 10⁻⁶ was found for muscle contraction genes of which 8 were found up-regulated (Table 2).
Fig 2.
Phototransduction genes. Gray dots represent the background of all genes as illustrated in Figure 1. Phototransduction genes are marked with black triangles and listed as gene symbols
A number of other studies have identified differentially expressed genes in response to stress inducing treatments (Zinke et al 2002; Landis et al 2004; Harbison et al 2005) and in flies with increased stress resistance (Pedra et al 2004; Harbison et al 2005). When comparing those genes with the genes identified in this study (supplemental Table 3), we find that the number of phototransduction genes differentially regulated in flies selected for dichlorodiphenyltrichloroethane (DDT) resistance (Pedra et al 2004) and in flies with increased starvation resistance (Harbison et al 2005) is remarkably high (9 of 158 and 14 of 477, respectively) (Table 2 and supplemental Table 3), whereas the same is not the case for genes responding to stress-inducing treatments (Zinke et al 2002; Landis et al 2004; Harbison et al 2005).
Genes responding late to heat treatment are up-regulated in selected flies
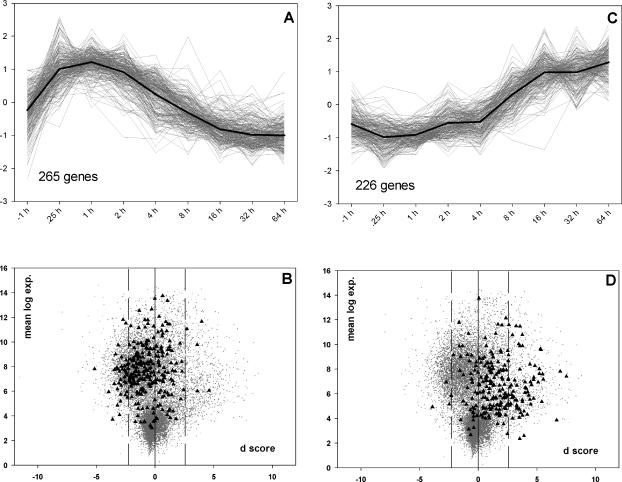
We recently identified genes responding to heat shock treatment using the time series data represented by set B (Sørensen et al 2005). Two major clusters containing 265 genes up-regulated early after heat stress and 226 genes up-regulated late after heat stress (Fig 3A,C) were prominent (Sørensen et al 2005). None of the 265 early up-regulated genes, which includes most known heat-responsive Hsps (not shown), were among the 118 genes found to be differentially regulated following heat resistance selection. However, among the 226 late up-regulated genes, we found 13 genes to be up-regulated following heat resistance selection (Table 2). This trend was even more pronounced in plots of SAM d values based on the paired analysis of data represented by set B, where bias towards higher d values of late up-regulated genes is evident (Fig 3D).
Fig 3.
Expression profiles and distributions of d scores for heat responsive genes. Profile of genes responding early (A) and late (C) to heat stress treatment (36°C for 1 hour). Profiles represent normalized average expression values of the measurements defined by set B (Table 1). Distributions of SAM d values for the early (B) and late (D) heat-responsive genes (black triangles). Gray dots represent the background of all genes as illustrated in Figure 1. Panels A and C are modified from Sørensen et al (2005)
DISCUSSION
The data presented in the present study identify genes that are differentially expressed in D. melanogaster subjected to 10 instances of heat resistance selection taking place every second generation compared to control flies from the same population background. Two parallel setups led to identification of a total of 118 and 2221 differentially expressed genes, respectively, of which 102 genes appeared in both analyses. Although all of these genes were found to be significantly differentially expressed at 5% and 1% FDR level, in general the differences were small, usually showing less than 2-fold change. The finding of more up-regulated genes in the analysis of set A combined with a tendency for the d value of up-regulated genes to deviate more from the overall d value distribution than that of down-regulated genes in the analysis of set B (Fig 1), suggests that up-regulated genes are more consistently differentially expressed, and could indicate that selection pressure has been more severe on these genes, ie, alleles resulting in higher expression of these genes are more frequently present in selected flies.
We found an extensive overrepresentation of genes involved in the phototransduction process among the up-regulated genes, indicating that the heat selection pressure has favored up-regulation of this process. This was observed in both sets, but more pronounced in set B where 21 of 28 phototransduction genes were up-regulated. As for all genes, the up-regulation level was low for most phototransduction genes, but approaching 2-fold for some. In general, the effect of heat selection on phototransduction genes was comparable in magnitude to changes found as the result of light-induced day and night cycles (McDonald and Rosbash 2001). Phototransduction in Drosophila is initiated by light-induced isomerization of rhodopsins and mediated through G protein– dependent activation of phospholipase C (norpA gene), leading to the formation of diacyl glycerol and inositol 1,4,5-trisphosphate. Subsequently, members of the transient receptor potential family of light sensitive cation channels (TRP and TRPL) are activated by an unknown mechanism (Hardie and Raghu 2001). The channels are coordinated in the INAD signaling complex also including INAD, protein kinase C (inaC gene), rhodopsins, myosin III (ninaC gene), and calmodulin (Cam gene) (Montell 2003). Several of these key components are up-regulated in the heat resistance–selected flies (Table 2 and Fig 2). A functional link between heat stress resistance and phototransduction is unclear. However, it was recently shown in flies that the TRP and TRPL channels are activated by metabolic stress, anoxia, and ATP depletion (Agam et al 2000). Another finding that provides a link between heat and TRP channels was the isolation of a TRP homolog in mouse that is activated by temperatures above 43°C and by the vanilloid capsaicin known to be responsible for the “heat” associated with chili peppers (Caterina et al 1997). Several other TRP channels have later been shown to be temperature activated in mouse (Peier et al 2002; Smith et al 2002; Xu et al 2002), and recently 2 TRP homologs in Drosophila, painless (Tracey et al 2003) and ANKTM1 (Viswanath et al 2003), have been demonstrated to be activated by heat. In addition to TRP and TRPL, the painless gene is found on the 1% FDR list of up-regulated genes (see supplemental Table 3). It is thus possible that TRP channels could be involved in yet-unrecognized stress-sensing pathways.
As pointed out above, 2 other studies on gene expression in stress-resistant D. melanogaster found a marked overrepresentation of phototransduction genes (Pedra et al 2004; Harbison et al 2005). A similar overrepresentation of differentially regulated phototransduction genes was not observed in studies investigating gene expression following stress-inducing treatments (Zinke et al 2002; Landis et al 2004; Harbison et al 2005). Notably, it was found that 4 phototransduction genes are up-regulated in response to heat stress several hours after the treatment (Sørensen et al 2005), ie, although late, some phototransduction genes also respond to heat treatment. Moreover, phototransduction genes were also found differentially expressed in flies calorie restricted for several days (Pletcher et al 2002). Thus, in summary, these findings strongly indicate that phototransduction gene expression, and thus the phototransduction process, is tightly connected to general resistance to a number of stress factors like heat (Sørensen et al 2005), starvation (Pletcher et al 2002; Harbison et al 2005), and oxidative stressors (Pedra et al 2004).
None of the Hsp genes known to be induced by heat treatment was found among the differentially expressed genes despite the indisputable importance of these genes for heat resistance. This could signify that the cost of maintaining alleles leading to a higher basal expression of Hsps may be too high in most natural environments (Sørensen et al 2003), as has been indicated in experiments with genetically modified flies (Feder et al 1996; Krebs and Feder 1998; Morrow et al 2004). Thus, genes acting as a driving force for evolution of basal heat resistance in natural populations are likely to include genes different from the Hsps, of which the present study provides a number of candidates. This view is supported by the finding of a general overlap between genes responding to heat treatment after several hours and genes responding to heat resistance selection by up-regulation (Fig 3D). The existence of such genes is suspected, because we (Dahlgaard et al 1998; Sørensen et al 2005) and others (Krebs and Feder 1997) have previously found that the protective effect of heat hardening in flies lasts far beyond the induction of known Hsps. Consequently, we expect that further investigations of these genes will provide new insights into mechanisms of stress resistance in general and heat resistance in particular.
This study demonstrates the effect of combining the suitability of D. melanogaster in selection experiments with validated full genome expression platforms to investigate complex traits. Such methods combined with developments in bioinformatics are important tools in the process of clarifying genetic architectures underlying these traits and efficiently complement conventional genetic methods such as QTL mapping. The unmatched possibilities for genetic experiments in publicly available stocks of D. melanogaster further enhance this process and will be a powerful supplemental tool for characterizing candidate genes found in the present study.
Table 2.
Continued
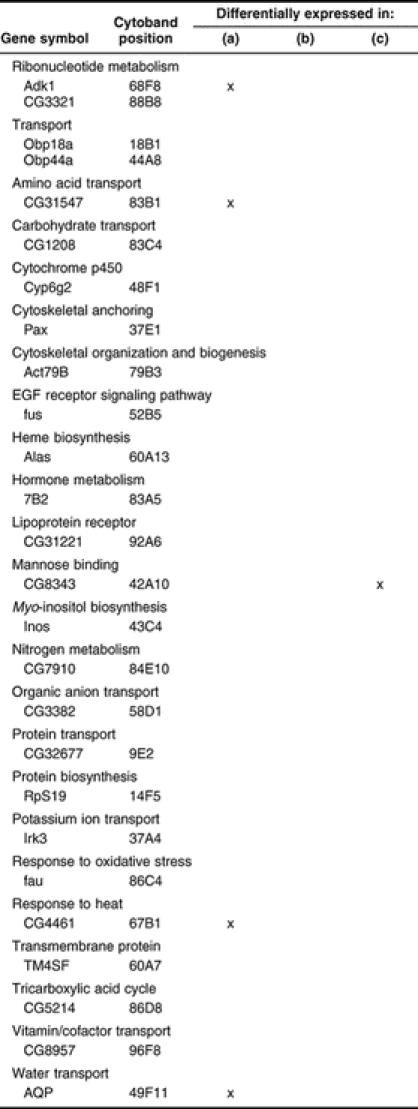
Table 2.
Continued
Acknowledgments
We are grateful to Doth Andersen, Mia Skov Jensen, and Bente Devantié for excellent technical assistance, to Jens Ledet Jensen for helpful discussion of statistics, and to Torsten N. Kristensen for helpful suggestions on the manuscript. We thank Hinnerk Boris for many discussions during the planning phase of the experiment. We acknowledge helpful suggestions from 2 anonymous reviewers. The work was supported by the Danish Natural Sciences Research Council by a Centre grant.
REFERENCES
- Agam KM, Levy S, and Ben-Ami HC. et al. 2000 Metabolic stress reversibly activates the Drosophila light-sensitive channels TRP and TRPL in vivo. J Neurosci. 20:5748–5755. [DOI] [PMC free article] [PubMed] [Google Scholar]
- Ashburner M, Ball CA, and Blake JA. et al. 2000 Gene ontology: tool for the unification of biology. The Gene Ontology Consortium. Nat Genet. 25:25–29. [DOI] [PMC free article] [PubMed] [Google Scholar]
- Bubliy OA, Loeschcke V. Correlated responses to selection for stress resistance and longevity in a laboratory population of Drosophila melanogaster. J Evol Biol. 2005;18:789–803. doi: 10.1111/j.1420-9101.2005.00928.x.1010-061X(2005)018[0789:CRTSFS]2.0.CO;2 [DOI] [PubMed] [Google Scholar]
- Caterina MJ, Schumacher MA, and Tominaga M. et al. 1997 The capsaicin receptor: a heat-activated ion channel in the pain pathway. Nature. 389:816–824. [DOI] [PubMed] [Google Scholar]
- Cossins AR, Bowler K 1987 Temperature Biology of Animals. Chapman and Hall, New York. [Google Scholar]
- Dahlgaard JV, Loeschcke V, Michalak P, Justesen J. Induced thermotolerance and associated expression of the heat-shock protein Hsp70 in adult Drosophila melanogaster. Funct Ecol. 1998;12:786–793.0269-8463(1998)012[0786:ITAAEO]2.0.CO;2 [Google Scholar]
- Dyrskjøt L, Thykjær T, and Kruhøffer M. et al. 2003 Identifying distinct classes of bladder carcinoma using microarrays. Nat Genet. 33:90–96. [DOI] [PubMed] [Google Scholar]
- Feder M, Cartano ENV, Milos L, Krebs RA, Lindquist SL. Effect of engineering Hsp70 copy number on Hsp70 expression and tolerance of ecologically relevant heat shock in larvae and pupae of Drosophila melanogaster. J Exp Biol. 1996;199:1837–1844. doi: 10.1242/jeb.199.8.1837.0022-0949(1996)199[1837:EOEHCN]2.0.CO;2 [DOI] [PubMed] [Google Scholar]
- Gentleman RC, Carey VJ, and Bates DM. et al. 2004 Bioconductor: open software development for computational biology and bioinformatics. Genome Biol. 5:R80. [DOI] [PMC free article] [PubMed] [Google Scholar]
- Harbison ST, Chang S, Kamdar KP, Mackay TF. Quantitative genomics of starvation stress resistance in Drosophila. Genome Biol. 2005;6:R36. doi: 10.1186/gb-2005-6-4-r36.1465-6914(2005)006[R36:QGOSSR]2.0.CO;2 [DOI] [PMC free article] [PubMed] [Google Scholar]
- Hardie RC, Raghu P. Visual transduction in Drosophila. Nature. 2001;413:186–193. doi: 10.1038/35093002.1476-4687(2001)413[0186:VTID]2.0.CO;2 [DOI] [PubMed] [Google Scholar]
- Hoffmann AA, Parsons PA 1991 Evolutionary Genetics and Environmental Stress. Oxford University Press, New York. [Google Scholar]
- Hoffmann AA, Sørensen JG, Loeschcke V. Adaptation of Drosophila to temperature extremes: bringing together quantitative and molecular approaches. J Therm Biol. 2003;28:175–216.0306-4565(2003)028[0175:AODTTE]2.0.CO;2 [Google Scholar]
- Hosack DA, Dennis GJ, Sherman BT, Lane HC, Lempicki RA. Identifying biological themes within lists of genes with EASE. Genome Biol. 2003;4:R70. doi: 10.1186/gb-2003-4-10-r70.1465-6914(2003)004[R70:IBTWLO]2.0.CO;2 [DOI] [PMC free article] [PubMed] [Google Scholar]
- Krebs RA, Feder ME. Deleterious consequences of Hsp70 overexpression in Drosophila melanogaster larvae. Cell Stress Chaperones. 1997;2:60–71. doi: 10.1379/1466-1268(1997)002<0060:dcohoi>2.3.co;2.1466-1268(1997)002[0060:DCOHOI]2.0.CO;2 [DOI] [PMC free article] [PubMed] [Google Scholar]
- Krebs RA, Feder ME. Hsp70 and larval thermotolerance in Drosophila melanogaster: how much is enough and when is more too much? J Insect Physiol. 1998;44:1091–1101. doi: 10.1016/s0022-1910(98)00059-6.0022-1910(1998)044[1091:HALTID]2.0.CO;2 [DOI] [PubMed] [Google Scholar]
- Krebs RA, Loeschcke V. Response to environmental change: genetic variation and fitness in Drosophila buzzatti following temperature stress. Exs. 1994;68:309–321. doi: 10.1007/978-3-0348-8510-2_24.0071-335X(1994)068[0309:RTECGV]2.0.CO;2 [DOI] [PubMed] [Google Scholar]
- Kristensen TN, Sørensen P, Kruhøffer M, Pedersen KS, Loeschcke V. Genome-wide analysis on inbreeding effects on gene expression in Drosophila melanogaster. Genetics. 2005;171:157–167. doi: 10.1534/genetics.104.039610.0016-6731(2005)171[0157:GAOIEO]2.0.CO;2 [DOI] [PMC free article] [PubMed] [Google Scholar]
- Kristensen TN, Sørensen P, Kruhøffer M, Pedersen KS, and Loeschcke V 2006 Inbreeding by environment interactions affect gene expression in Drosophila melanogaster. Genetics, 173: 1329–1336. [DOI] [PMC free article] [PubMed] [Google Scholar]
- Landis GN, Abdueva D, and Skvortsov D. et al. 2004 Similar gene expression patterns characterize aging and oxidative stress in Drosophila melanogaster. Proc Natl Acad Sci USA. 101:7663–7668. [DOI] [PMC free article] [PubMed] [Google Scholar]
- McDonald MJ, Rosbash M. Microarray analysis and organization of circadian gene expression in Drosophila. Cell. 2001;107:567–578. doi: 10.1016/s0092-8674(01)00545-1.0092-8674(2001)107[0567:MAAOOC]2.0.CO;2 [DOI] [PubMed] [Google Scholar]
- Montell C. The venerable inveterate invertebrate TRP channels. Cell Calcium. 2003;33:409–417. doi: 10.1016/s0143-4160(03)00053-8.0143-4160(2003)033[0409:TVIITC]2.0.CO;2 [DOI] [PubMed] [Google Scholar]
- Morrow G, Samson M, Michaud S, Tanguay RM. Overexpression of the small mitochondrial Hsp22 extends Drosophila life span and increases resistance to oxidative stress. FASEB J. 2004;18:598–599. doi: 10.1096/fj.03-0860fje.0892-6638(2004)018[0598:OOTSMH]2.0.CO;2 [DOI] [PubMed] [Google Scholar]
- Parsons PA. Inherited stress resistance and longevity: a stress theory of ageing. Heredity. 1995;75:216–221. doi: 10.1038/hdy.1995.126.0018-067X(1995)075[0216:ISRALA]2.0.CO;2 [DOI] [PubMed] [Google Scholar]
- Pedra JH, McIntyre LM, Scharf ME, Pittendrigh BR. Genome-wide transcription profile of field- and laboratory-selected dichlorodiphenyltrichloroethane (DDT)-resistant Drosophila. Proc Natl Acad Sci USA. 2004;101:7034–7039. doi: 10.1073/pnas.0400580101.1091-6490(2004)101[7034:GTPOFA]2.0.CO;2 [DOI] [PMC free article] [PubMed] [Google Scholar]
- Peier AM, Moqrich A, and Hergarden AC. et al. 2002 A TRP channel that senses cold stimuli and menthol. Cell. 108:705–715. [DOI] [PubMed] [Google Scholar]
- Pletcher SD, Macdonald SJ, and Marguerie R. et al. 2002 Genome-wide transcript profiles in aging and calorically restricted Drosophila melanogaster. Curr Biol. 12:712–723. [DOI] [PubMed] [Google Scholar]
- Saeed AI, Sharov V, and White J. et al. 2003 TM4: a free, open-source system for microarray data management and analysis. Biotechniques. 34:374–378. [DOI] [PubMed] [Google Scholar]
- Smith GD, Gunthorpe MJ, and Kelsell RE. et al. 2002 TRPV3 is a temperature-sensitive vanilloid receptor-like protein. Nature. 418:186–190. [DOI] [PubMed] [Google Scholar]
- Sørensen JG, Kristensen TN, Loeschcke V. The evolutionary and ecological role of heat shock proteins. Ecol Lett. 2003;6:1025–1037.1461-023X(2003)006[1025:TEAERO]2.0.CO;2 [Google Scholar]
- Sørensen JG, Nielsen MM, Kruhøffer M, Justesen J, Loeschcke V. Full genome gene expression analysis of the heat stress response in Drosophila melanogaster. Cell Stress Chaperones. 2005;10:312–328. doi: 10.1379/CSC-128R1.1.1466-1268(2005)010[0312:FGGEAO]2.0.CO;2 [DOI] [PMC free article] [PubMed] [Google Scholar]
- Toma DP, White KP, Hirsch J, Greenspan RJ. Identification of genes involved in Drosophila melanogaster geotaxis, a complex behavioral trait. Nat Genet. 2002;31:349–353. doi: 10.1038/ng893.1061-4036(2002)031[0349:IOGIID]2.0.CO;2 [DOI] [PubMed] [Google Scholar]
- Tracey WD, Wilson RI, Laurent G, Benzer S. painless, a Drosophila gene essential for nociception. Cell. 2003;113:261–273. doi: 10.1016/s0092-8674(03)00272-1.0092-8674(2003)113[0261:PADGEF]2.0.CO;2 [DOI] [PubMed] [Google Scholar]
- Tusher VG, Tibshirani R, Chu G. Significance analysis of microarrays applied to the ionizing radiation response. Proc Natl Acad Sci USA. 2001;98:5116–5121. doi: 10.1073/pnas.091062498.1091-6490(2001)098[5116:SAOMAT]2.0.CO;2 [DOI] [PMC free article] [PubMed] [Google Scholar]
- Viswanath VG, Story M, and Peier AM. et al. 2003 Opposite thermosensor in fruitfly and mouse. Nature. 423:822–823. [DOI] [PubMed] [Google Scholar]
- Williams KD, Helin AB, Posluszny J, Roberts SP, Feder ME. Effect of heat shock, pretreatment and hsp70 copy number on wing development in Drosophila melanogaster. Mol Ecol. 2003;12:1165–1177. doi: 10.1046/j.1365-294x.2003.01771.x.0962-1083(2003)012[1165:EOHSPA]2.0.CO;2 [DOI] [PubMed] [Google Scholar]
- Xu H, Ramsey IS, and Kotecha SA. et al. 2002 TRPV3 is a calcium-permeable temperature-sensitive cation channel. Nature. 418:181–186. [DOI] [PubMed] [Google Scholar]
- Zinke I, Schutz CS, Katzenberger JD, Bauer M, Pankratz MJ. Nutrient control of gene expression in Drosophila: microarray analysis of starvation and sugar-dependent response. EMBO J. 2002;21:6162–6173. doi: 10.1093/emboj/cdf600.1460-2075(2002)021[6162:NCOGEI]2.0.CO;2 [DOI] [PMC free article] [PubMed] [Google Scholar]


