Abstract
The murine Fv1 gene restricts infection by N- or B-tropic murine leukemia viruses at a postentry, preintegration stage. The Fv1-sensitive viruses previously used for the study of Fv1 encode an ecotropic envelope gene and thus only infect rodent cells. Consequently, the study of Fv1 restriction has been carried out solely in mice and murine cell lines. By infection with retroviral vectors containing N- or B-tropic core and pantropic vesicular stomatitis virus-G envelope protein, we now demonstrate that cell lines derived from various mammalian species, including humans, have an Fv1-like retrovirus restriction function, preventing N-tropic vector infection. Like Fv1, restriction is directed at amino acid 110 of the viral capsid protein. In contrast to Fv1, the novel restriction is characterized by the absence of reverse-transcribed viral DNA. We speculate that these activities have been selected for by retroviral epidemics in the distant past.
During evolution, a number of host genes to limit retroviral replication have arisen, apparently in response to a continuing process of infection. Best characterized in mice, these genes act by both immunologic (1) and nonimmunologic (2) mechanisms. One example of the latter class is the Fv1 gene, which acts to restrict murine leukemia virus (MLV) replication at a stage after virus entry into the target cell but before integration of reverse-transcribed viral DNA (3, 4). Fv1 restriction can be demonstrated both in vivo and in vitro (5, 6).
Fv1 has two major restricting alleles, which allow the division of MLVs into N-tropic viruses, which infect NIH 3T3 cells, B-tropic viruses, which infect BALB/c cells, or NB-tropic viruses, which infect both. The viral determinants for N- and B-tropism have been shown to be present in the capsid (CA) protein with an arginine at amino acid position 110 specifying N-tropism and a glutamate B-tropism (7). Fv1 is codominant because cells from heterozygous Fv1n/b animals are not infected by either N- or B-tropic viruses (8) and mixed virus particles containing N and B CA molecules are restricted by either allele (9). Fv1 restriction is not absolute but results in a 50- to 1,000-fold reduction in virus replication (10).
The Fv1 gene has been cloned (11); it is derived from an endogenous retrovirus unrelated to MLV (12, 13). The isolation of the Fv1 gene allowed the search for similar genes in other species, but no closely related sequences were found in rat, cat, or human DNA samples using Southern hybridization analysis (11). Furthermore, the equivalent chromosomal position in humans was found to have no Fv1-specific sequences (S. Ellis and J.P.S. unpublished data). Nevertheless, a few tantalizing clues suggest the presence of postentry, preintegration restriction mechanisms in nonmurine cells (14, 15). To explore the possibility of Fv1-like restriction in such cells, we have carried out the following study.
Materials and Methods
Virus Preparations.
Virus was prepared either by transfection of 2 × 10⁶ 293T cells, which previously had been transduced with LNCX (CLONTECH) encoding enhanced green fluorescent protein (eGFP), on a 10-cm plate with 10 μg of gag-pol expression vector (pCIG3 N or B) (16) and 5 μg of vesicular stomatitis virus G protein (VSV-G) expression vector pMDG (17) using polyethylenimine (Sigma) at a DNA/polyethylenimine ratio of 1:2.5 as described (18) or by simultaneous transfection of 293T cells with gag-pol, VSV-G and eGFP, enhanced yellow fluorescent protein (eYFP), or β-galactosidase (β-gal) encoding plasmids as described (16). Chimeric N- plus B-tropic viruses were prepared by the former method using 9:1, 4:1, 1:1, 1:4, and 1:9 weight ratios of pCIG3 N and pCIG3 B. Virus preparations were titrated on Fv1-null (19) Mus dunni cells.
Mutant gag-pol expression vectors were made by PCR site-directed mutagenesis using PfuTurbo polymerase (Stratagene) according to the manufacturer's protocol. The template for PCR was either N or B pCIG3 plasmid, and oligonucleotides were as follows:
NB at position CA109/110: forward primer GT62 5′-GATTACACCACCCAAGAAGGTAGGAACC-3′, reverse GT63 5′-GGTTCCTACCTTCTTGGGTGGTGTAATC-3′; BN at position CA109/110: forward GT64 5′-GATTACACCACTACAAGAGGTAGGAACC-3′, reverse GT65 5′-GGTTCCTACCTCTTGTAGTGGTGTAATC-3′; N at position CA159: forward GT70 5′-GAGAGACTCAAGGAAGCCTATCGCAG-3′, reverse GT71 5′-CTGCGATAGGCTTCCTGGAGTCTCTC-3′; B at position CA159: forward GT72 5′-GAGAGACTCAAGGGAGCCTATCGCAG-3′, reverse GT73 5′-CTGCGATAGGCTCCCTTGAGTCTCTC-3′; N at position PR41 forward GT66 5′-CACTCCGTGCTGACTCAAAATCCTGGG-3′, reverse GT67 5′-CCCAGGATTTTGAGTCAGCACGGAGTG-3′; B at position PR41 forward GT68 5′-CACTCCGTGCTGATTCAAAATCCTGGG-3′, reverse GT69 5′-CCCAGGATTTTGAATCAGCACGGAGTG-3′. The sequences of the mutant gag-pol cDNAs were verified by sequencing.
Virus Assays.
Cells were generally plated at 5 × 10⁴ per well in 12-well plates and infected overnight in the presence of 5 mg/ml Polybrene. Numbers of infected cells were determined by measurement of eGFP expression by fluorescence-activated cell sorting (FACS) using a FACScan and CELL QUEST software (Becton Dickinson) or by enumeration of β-gal-positive cells (16). The cells used and their growth conditions have been described (20).
PCR Analysis of Viral DNA.
Cells were plated at 3 × 10⁵ per well in 6-well plates 24 h before infection. They were then infected with N-tropic or B-tropic viruses encoding eYFP for 2 h, washed once with PBS, and incubated in normal medium for a further 4 h. Total cellular DNA was prepared by using the Dneasy Tissue Kit (Qiagen, Chatsworth, CA). DNA concentrations were determined by measuring OD at 260 nm; 400-ng samples were used for PCR. Synthesis of viral DNA was detected by using primers to eYFP (MB17 5′-ATGGTGAGCAAGGGCGACGA-3′ and MB18 5′-CTTGTACAGCTCGTCCATGC-3′; 30 cycles of 30 sec at 94°C, 30 sec at 55°C, and 1 min at 72°C), and circular DNA formation was detected by using long terminal repeat primers 4091 and 5784 (21), (40 cycles of 30 sec at 94°C, 30 sec at 57°C, and 45 sec at 72°C).
Results
N-Tropic Virus Is Restricted in Some Nonmurine Lines.
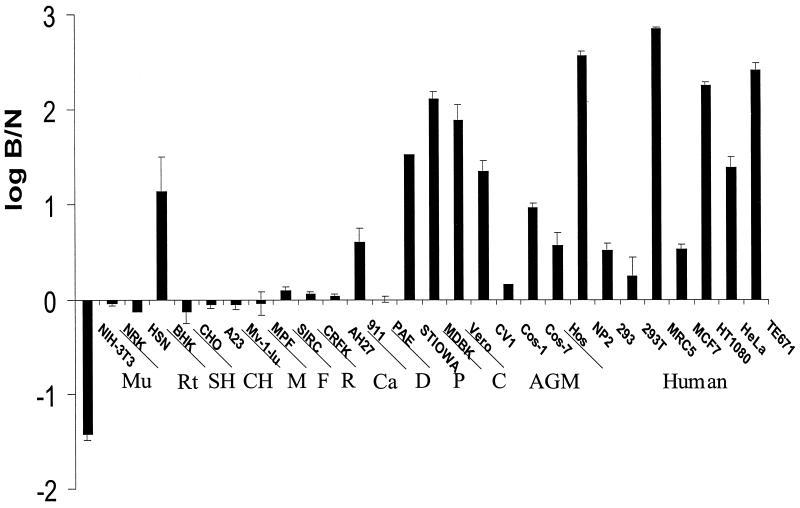
We prepared N- and B-tropic pseudotype viruses enveloped with VSV-G to make virus capable of infecting cells of a wide range of species (17). Using a retroviral vector encoding eGFP to detect infection, we tested cell lines from different species for the presence of a restriction activity. A variety of dog, pig, cow, African green monkey, and human cell lines could be infected with B-tropic virus 10–1,000 times more efficiently than N-tropic virus (Fig. 1). Similar data were obtained in titration experiments using β-gal as the indicator for virus infection (data not shown). This restriction effect was not attributable to the VSV-G envelope because vectors prepared with amphotropic MLV envelope (22) gave identical results (data not shown). It should be noted that within a given species the level of restriction varied from cell line to cell line; we assume that this reflects differences in expression level of the responsible gene. Interestingly, in earlier studies of the host range of murine mink cell focus-inducing viruses, most but not all of which would be expected to carry the N-tropic determinant, significant variation was seen between different cell lines of nonmurine origin (23, 24). These results were ascribed to differences in receptor binding, but in light of our data, these studies may need reinterpretation.
Figure 1.
Fv1-like restriction to N-tropic virus infection in nonmurine cells. Cells were infected with equal titers of N- and B-tropic virus. Twenty-four hours later, the numbers of infected cells were determined by FACS analysis. Log B/N values were obtained by dividing the percentage of cells infected with N-tropic virus by the percentage cells infected with B-tropic virus and calculating the log value. Cells with Fv1n-like phenotype therefore have negative values and those with Fv1b-like phenotype have positive values. Values close to zero represent Fv1-null lines. Errors are standard error. Mu, mouse; Rt, rat; SH, Syrian hamster; CH, Chinese hamster; M, mink; F, ferret; R, rabbit; Ca, cat; D, dog, P, pig; C, cow; AGM, African green monkey.
Position 110 of CA Defines Specificity in All Cells Tested.
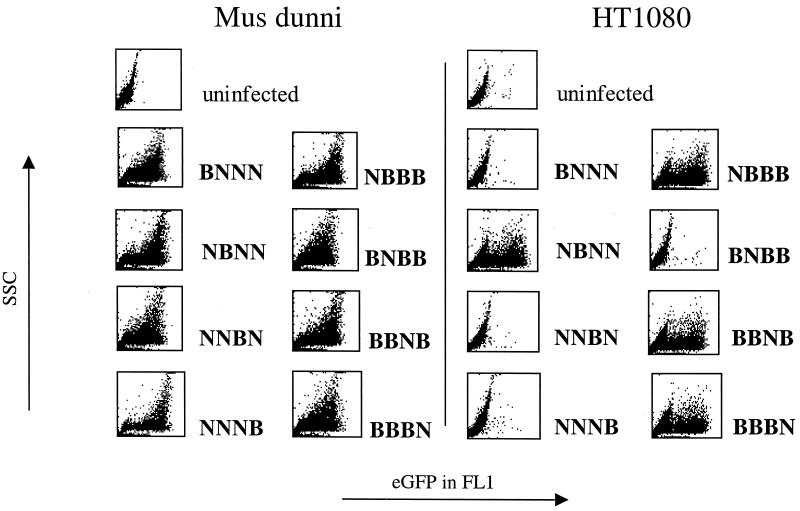
In murine cells, Fv1 tropism is determined by the nature of the amino acid at position 110 in CA (7). Our N- and B-tropic constructs differ at three additional positions (CA109, CA159, and PR41) (25). To test which of these determinants is important in nonmurine cells, we made a series of viruses with single amino acid changes at these positions. These changes had no effect on virus growth in Fv1-null M. dunni cells. These viruses were then tested for their ability to transduce human HT1080 cells (Fig. 2). As is the case for Fv1 restriction, tropism in HT1080 cells is determined by the amino acid at position CA110, where the substitution of arginine for glutamate allowed infection. To examine whether this single change would allow the N virus to infect all of the nonmurine lines showing restriction, we tested the ability of this mutant (NBNN) to transduce the lines shown in Fig. 1. We found that all of the lines showing Fv1b-like restriction were infected with this mutant (data not shown), demonstrating identical tropism determinants in these unrelated species and suggesting a conserved mechanism of restriction.
Figure 2.
Viral determinants of the Fv1-like restriction. Human HT1080 cells were infected with equal titers of viruses carrying reciprocal mutations at the four positions distinguishing pCIG3 N and B. FACS profiles (side scatter versus eGFP fluorescent intensity) were measured 1 day later.
Presence of a Restriction Factor in Human Cells.
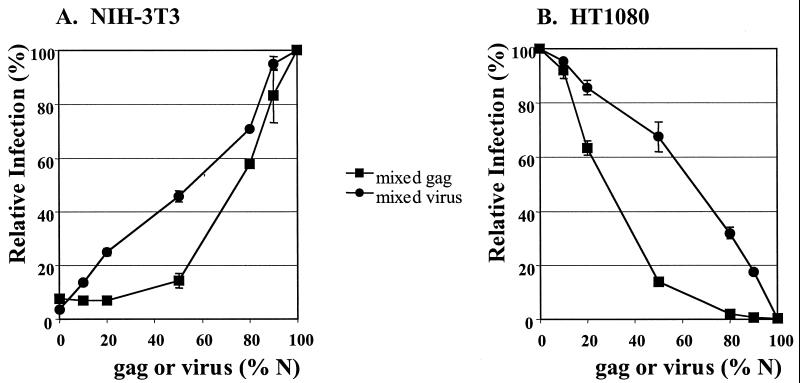
Formally, reduced virus infection might result from the activity of a restricting factor, like Fv1, or from the absence of a specific factor required for infection. To distinguish between these possibilities, we used an approach similar to one taken in the study of Fv1, in which it was shown that viruses containing mixed N- and B-tropic CA molecules were equally restricted in cells carrying either the n or b alleles of Fv1 (9). We prepared chimeric viruses containing different ratios of N- and B-tropic CA by cotransfection of N- and B-tropic gag-pol expression vectors. We then tested virus infection on human HT1080 cells and murine NIH 3T3 cells (Fig. 3). The drop in titer on HT1080 cells mirrors that seen with authentic Fv1 in NIH 3T3 cells. We also tested N- and B-tropic viruses mixed in the same proportions. In all cases, chimeric viruses were inhibited to a much greater extent than was seen with a mixture of viruses containing pure N- or B-tropic CA molecules. This result suggests that these human cells express a restriction factor that acts like the dominant Fv1 gene product seen in mice. Similar results were seen when infection was followed by either eGFP or β-gal expression in both human HT1080 cells and African green monkey Vero cells (data not shown).
Figure 3.
Dominant restriction of virus particles containing both N- and B-tropic gag-pol. NIH 3T3 cells (A) and HT1080 cells (B) were infected with equal amounts of chimeric vectors containing different ratios of N- and B-tropic CA molecules within the same virions (squares) or mixtures of N- and B-tropic virus (circles). Twenty-four hours later, the number of eGFP-positive cells was determined by FACS analysis. y axis values were calculated by setting the % infected cells at 100% for neat nonrestricted virus. x axis values were calculated by expressing the amount of N-tropic (gag or virus) as a percentage of the total. Errors are standard error.
Restriction in Human and Monkey Cells Is at the Level of Reverse Transcription.
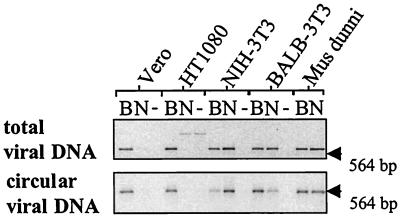
To define more precisely the stage at which restriction occurs, we examined the appearance of linear (newly synthesized plus integrated) and circular (a dead-end product indicative of nuclear entry) (26) viral DNA in cells 6 h after infection. In murine cells exhibiting Fv1 restriction, as shown previously (27, 28), equal levels of freshly synthesized DNA but reduced levels of circular DNA were detected, implying a block in nuclear entry and therefore integration (Fig. 4). In contrast, in human and monkey cells, little or no linear DNA was seen in restricted infection, implying an earlier block in replication reminiscent of an induced mutation in rat cells (29). Similar results were obtained with later time points (data not shown), indicating a block in the synthesis or accumulation of viral DNA in restricted cells.
Figure 4.
Inhibition of viral DNA synthesis in newly infected cells. Mus dunni, BALB 3T3, NIH 3T3, HT1080, and Vero cells were infected with equal amounts of N- and B-tropic virus. Six hours later, total cellular DNA was extracted and tested by PCR for linear (Upper) and circular (Lower) forms of viral DNA. Products of PCR were run out on 1% (Upper) or 1.5% (Lower) agarose gels and visualized by ethidium bromide staining. Lanes labeled −− contain products of PCR from uninfected cells. The position of the 564-bp λ/HindIII marker is indicated with an arrow. The presence of a 1.6-kb band in HT1080 extracts that do not contain viral product was consistently observed. The nature of this product is unknown.
Discussion
These data demonstrate the ability of cells from a range of mammals to restrict infection by MLV in a manner reminiscent of the murine Fv1 gene. We propose calling the human gene encoding this activity resistance factor 1 (REF1). The precise mechanism of action of Fv1 is poorly understood; it appears to act after viral reverse transcription but before integration and is believed to involve a direct interaction between the Fv1 gene product and the viral CA protein (30). The fact that residue 110 of the CA protein determines the restricted phenotype in both murine and human cells implies that similar interactions exist for REF1. Consistently, both restrictions appear dominant in particles of mixed restricted and nonrestricted gag. Yet our measurement of the amount of viral DNA in restrictive human cells suggests that REF1 acts at a step before reverse transcription. This apparent discrepancy with the Fv1-associated restriction can be explained if in both cases, the interaction with the viral core after its entry into the cell results in its destabilization and elimination. Depending on the efficiency of this process, more or less reverse-transcribed viral genomes will have the opportunity to accumulate in the infected cell.
The murine Fv1 gene appears to be derived from the gag gene of an endogenous retroviral sequence selected for during the last 10 million years by virtue of its protective properties (11, 19). Despite the lack of detectable homology—other than within the major homology region (12)—with the CA protein of MLV, it seems possible that the Fv1 protein is gag-like and shares some similarity to its target, allowing binding and therefore restriction. There are hundreds of endogenous retroviruses present in all mammals with greater similarity to MLV than Fv1 and it seems entirely possible that REF1 is derived from one of these elements. Alternatively, the region around CA amino acid position 110, for structural or functional reasons, may make a particularly inviting target for restriction by an unrelated gene. Resolution of this issue awaits the cloning of REF1.
The identical specificity of restriction in mice, in which Fv1-sensitive ecotropic viruses cause disease, and in higher organisms, in which currently they do not cause disease, raises the possibility that higher organisms have encountered Fv1-sensitive viruses in the past and that those protected by restriction have been selected for survival. It is interesting to note that all of the restrictions we have found are against N-tropic virus rather than B-tropic virus, raising the possibility that these species are survivors of N-tropic viral epidemics. It is a matter of speculation whether these restrictions demonstrate the role of lethal viral epidemics in mammalian evolution or whether they represent a more subtle interplay between virus and host. It is remarkable that mammals have at least twice independently obtained restriction genes of identical specificity that control the postentry, preintegration stage of retrovirus infection. Further study of the mechanism of restriction by REF1 will provide information on this essential, and poorly understood, stage in the retrovirus life cycle.
Acknowledgments
We thank all our colleagues, particularly J. C. Pages, R. A. Weiss, and M. K. L. Collins, for helpful discussions and E. Callouet for sequencing. Association Française Contre les Myopathies, the United Kingdom Biotechnology and Biological Sciences Research Council and the United Kingdom Medical Research Council funded this work.
Abbreviations
- β-gal
β-galactosidase
- CA
capsid
- eGFP
enhanced green fluorescent protein
- eYFP
enhanced yellow fluorescent protein
- FACS
fluorescence-activated cell sorting
- MLV
murine leukemia virus
- REF1
resistance factor 1
- VSV-G
vesicular stomatitis virus G protein
Footnotes
This paper was submitted directly (Track II) to the PNAS office.
Article published online before print: Proc. Natl. Acad. Sci. USA, 10.1073/pnas.200286297.
Article and publication date are at www.pnas.org/cgi/doi/10.1073/pnas.200286297
References
- 1.Hasenkrug K J, Chesebro B. Proc Natl Acad Sci USA. 1997;94:7811–7816. doi: 10.1073/pnas.94.15.7811. [DOI] [PMC free article] [PubMed] [Google Scholar]
- 2.Steeves R, Lilly F. Annu Rev Genet. 1977;11:277–296. doi: 10.1146/annurev.ge.11.120177.001425. [DOI] [PubMed] [Google Scholar]
- 3.Jolicoeur P. Curr Top Microbiol Immunol. 1979;86:67–122. doi: 10.1007/978-3-642-67341-2_3. [DOI] [PubMed] [Google Scholar]
- 4.Stoye J P. Rev Sci Tech. 1998;17:269–277. doi: 10.20506/rst.17.1.1080. [DOI] [PubMed] [Google Scholar]
- 5.Pincus T, Hartley J W, Rowe W P. J Exp Med. 1971;133:1219–1233. doi: 10.1084/jem.133.6.1219. [DOI] [PMC free article] [PubMed] [Google Scholar]
- 6.Pincus T, Rowe W P, Lilly F. J Exp Med. 1971;133:1234–1241. doi: 10.1084/jem.133.6.1234. [DOI] [PMC free article] [PubMed] [Google Scholar]
- 7.Kozak C A, Chakraborti A. Virology. 1996;225:300–306. doi: 10.1006/viro.1996.0604. [DOI] [PubMed] [Google Scholar]
- 8.Rowe W P, Hartley J W. J Exp Med. 1972;136:1286–1301. doi: 10.1084/jem.136.5.1286. [DOI] [PMC free article] [PubMed] [Google Scholar]
- 9.Rein A, Kashmiri S V S, Bassin R H, Gerwin B I, Duran-Troise G. Cell. 1976;7:373–379. doi: 10.1016/0092-8674(76)90166-5. [DOI] [PubMed] [Google Scholar]
- 10.Hartley J W, Rowe W P, Huebner R J. J Virol. 1970;5:221–225. doi: 10.1128/jvi.5.2.221-225.1970. [DOI] [PMC free article] [PubMed] [Google Scholar]
- 11.Best S, Le Tissier P, Towers G, Stoye J P. Nature (London) 1996;382:826–829. doi: 10.1038/382826a0. [DOI] [PubMed] [Google Scholar]
- 12.Bénit L, de Parseval N, Casella J-F, Callebaut I, Cordonnier A, Heidmann T. J Virol. 1997;71:5652–5657. doi: 10.1128/jvi.71.7.5652-5657.1997. [DOI] [PMC free article] [PubMed] [Google Scholar]
- 13.Cordonnier A, Casella J-F, Heidmann T. J Virol. 1995;69:5890–5897. doi: 10.1128/jvi.69.9.5890-5897.1995. [DOI] [PMC free article] [PubMed] [Google Scholar]
- 14.Balachandran R, Singh M K, Gupta P. J Gen Virol. 1996;77:1083–1088. doi: 10.1099/0022-1317-77-5-1083. [DOI] [PubMed] [Google Scholar]
- 15.Williams L M, Cloyd M W. Virology. 1991;184:723–728. doi: 10.1016/0042-6822(91)90442-e. [DOI] [PubMed] [Google Scholar]
- 16.Bock M, Bishop K N, Towers G, Stoye J P. J Virol. 2000;74:7422–7430. doi: 10.1128/jvi.74.16.7422-7430.2000. [DOI] [PMC free article] [PubMed] [Google Scholar]
- 17.Yee J K, Miyanohara A, LaPorte P, Bouic K, Burns J C, Friedmann T. Proc Natl Acad Sci USA. 1994;91:9564–9568. doi: 10.1073/pnas.91.20.9564. [DOI] [PMC free article] [PubMed] [Google Scholar]
- 18.Towers G J, Stockholm D, Labrousse-Najburg V, Carlier F, Danos O, Pages J G. J Gene Med. 1999;1:352–359. doi: 10.1002/(SICI)1521-2254(199909/10)1:5<352::AID-JGM57>3.0.CO;2-I. [DOI] [PubMed] [Google Scholar]
- 19.Qi C F, Bonhomme F, Buckler-White A, Buckler C, Orth A, Lander M R, Chattopadhyay S K, Morse H C., III Mamm Genome. 1998;9:1049–1055. doi: 10.1007/s003359900923. [DOI] [PubMed] [Google Scholar]
- 20.Takeuchi Y, Patience C, Magre S, Weiss R A, Banerjee P J, Le Tissier P, Stoye J P. J Virol. 1998;72:9986–9991. doi: 10.1128/jvi.72.12.9986-9991.1998. [DOI] [PMC free article] [PubMed] [Google Scholar]
- 21.Smith C M, Potts W B, Smith J S, Roth M J. Virology. 1997;229:437–446. doi: 10.1006/viro.1997.8454. [DOI] [PubMed] [Google Scholar]
- 22.Danos O, Mulligan R C. Proc Natl Acad Sci USA. 1988;85:6460–6464. doi: 10.1073/pnas.85.17.6460. [DOI] [PMC free article] [PubMed] [Google Scholar]
- 23.Cloyd M W, Thompson M M, Hartley J W. Virology. 1985;140:239–248. doi: 10.1016/0042-6822(85)90362-9. [DOI] [PubMed] [Google Scholar]
- 24.Loiler S A, DiFronzo N L, Holland C A. J Virol. 1997;71:4825–4828. doi: 10.1128/jvi.71.6.4825-4828.1997. [DOI] [PMC free article] [PubMed] [Google Scholar]
- 25.Ou C-Y, Boone L R, Koh C-K, Tennant R W, Yang W K. J Virol. 1983;48:779–784. doi: 10.1128/jvi.48.3.779-784.1983. [DOI] [PMC free article] [PubMed] [Google Scholar]
- 26.Telesnitsky A, Goff S P. In: Retroviruses. Coffin J M, Hughes S H, Varmus H E, editors. Plainview, NY: Cold Spring Harbor Lab Press; 1997. pp. 121–160. [Google Scholar]
- 27.Jolicoeur P, Rassart E. J Virol. 1980;33:183–195. doi: 10.1128/jvi.33.1.183-195.1980. [DOI] [PMC free article] [PubMed] [Google Scholar]
- 28.Yang W K, Kiggans J O, Yang D-M, Ou C-Y, Tennant R W, Brown A, Bassin R H. Proc Natl Acad Sci USA. 1980;77:2994–2998. doi: 10.1073/pnas.77.5.2994. [DOI] [PMC free article] [PubMed] [Google Scholar]
- 29.Gao G, Goff S P. Mol Biol Cell. 1999;10:1705–1717. doi: 10.1091/mbc.10.6.1705. [DOI] [PMC free article] [PubMed] [Google Scholar]
- 30.Goff S P. Cell. 1996;86:691–693. doi: 10.1016/s0092-8674(00)80141-5. [DOI] [PubMed] [Google Scholar]


