Abstract
Conventional cooperative protein folding invokes discrete ensembles of native and denatured state structures in separate free-energy wells. Unimodal noncooperative (“downhill”) folding, however, proposes an ensemble of states occupying a single free-energy well for proteins folding at ≥4 × 10⁴ s−1 at 298 K. It is difficult to falsify unimodal mechanisms for such fast folding proteins by standard equilibrium experiments because both cooperative and unimodal mechanisms can present the same time-averaged structural, spectroscopic, and thermodynamic properties when the time scale used for observation is longer than for equilibration. However, kinetics can provide the necessary evidence. Chevron plots with strongly sloping linear refolding arms are very difficult to explain by downhill folding and are a signature for cooperative folding via a transition state ensemble. The folding kinetics of the peripheral subunit binding domain POB and its mutants fit to strongly sloping chevrons at observed rate constants of >6 × 10⁴ s−1 in denaturant solution, extrapolating to 2 × 10⁵ s−1 in water. Protein A, which folds at 105 s−1 at 298 K, also has a well-defined chevron. Single-molecule fluorescence energy transfer experiments on labeled Protein A in the presence of denaturant demonstrated directly bimodal distributions of native and denatured states.
Keywords: BBL, denaturation, kinetics, T jump
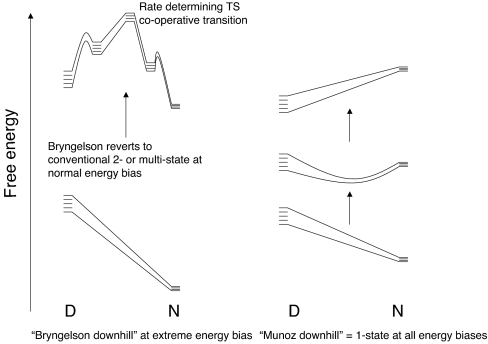
A currently controversial subject in protein folding is unimodal “downhill” versus classical cooperative folding. It is generally accepted that proteins fold on a free-energy landscape in which there are ensembles of states separated by free-energy barriers (1). Accordingly, there are cooperative transitions between those ensembles of states, as, for example, the native N and denatured D ensembles, which have a bimodal distribution of properties. However, when there is an extreme energetic bias toward the native state, the protein may fold “downhill,” without an energy barrier (1). This conventional (“chemical”) view of folding has been challenged by Muñoz and colleagues (2, 3), who claim that for a protein NapBBL, a truncated and naphthylalanine-labeled derivative of the BBL peripheral subunit binding domain (PSBD) from Escherichia coli, in particular, and for all proteins that fold faster than 40,000 s−1 at 298 K (4), the D and N states are not separated by an energy barrier, but slowly merge into each other with changing conditions; Muñoz and colleagues (2) call this mechanism “downhill” folding (Fig. 1). We use the term noncooperative or unimodal (5) for this downhill folding. Various criteria derived from equilibrium experiments have been proposed to be signatures of unimodal folding (2, 6). Downhill folding is proposed to be important, in particular as a means for the PSBDs to adjust their sizes as “molecular rheostats,” and in general because it is suggested (2, 4, 7) that it opens up the exciting prospect of examining the whole pathway of folding from equilibrium spectroscopic observations.
Fig. 1.
Free-energy profiles for two-state (Left) and unimodal (Muñoz) downhill (Right) folding. The reaction coordinate is arbitrary. Two-state folding almost certainly has high-energy intermediates in most cases that are insignificantly occupied. Each state consists of an ensemble of structures.
Until recently, the proteins that were studied folded slowly compared with the time scales of observation by spectroscopy, and it was easy to show cooperative folding transitions because separate D and N states could be directly observed. NMR studies on the denaturation of such slow folding proteins clearly show two sets of spectra, corresponding to the D and N states that are in slow exchange (8). For example, NMR-monitored kinetics of refolding of the two proteins barnase and chymotrypsin inhibitor 2 (CI2), show the signals of the denatured state disappearing concomitantly with the cooperative formation of the native state (9). A single-molecule FRET experiment demonstrates the distinct ensembles of denatured and native states for CI2 (10). The two-state folding of cold shock protein B, a relatively fast folder (11), is seen by single-molecule FRET studies to have a bimodal distribution (12). The problem of mechanistic distinction resides with the new generation of fast folding proteins that equilibrate on a rapid time scale relative to NMR spectroscopy or single-molecule studies (13–19, ¶).
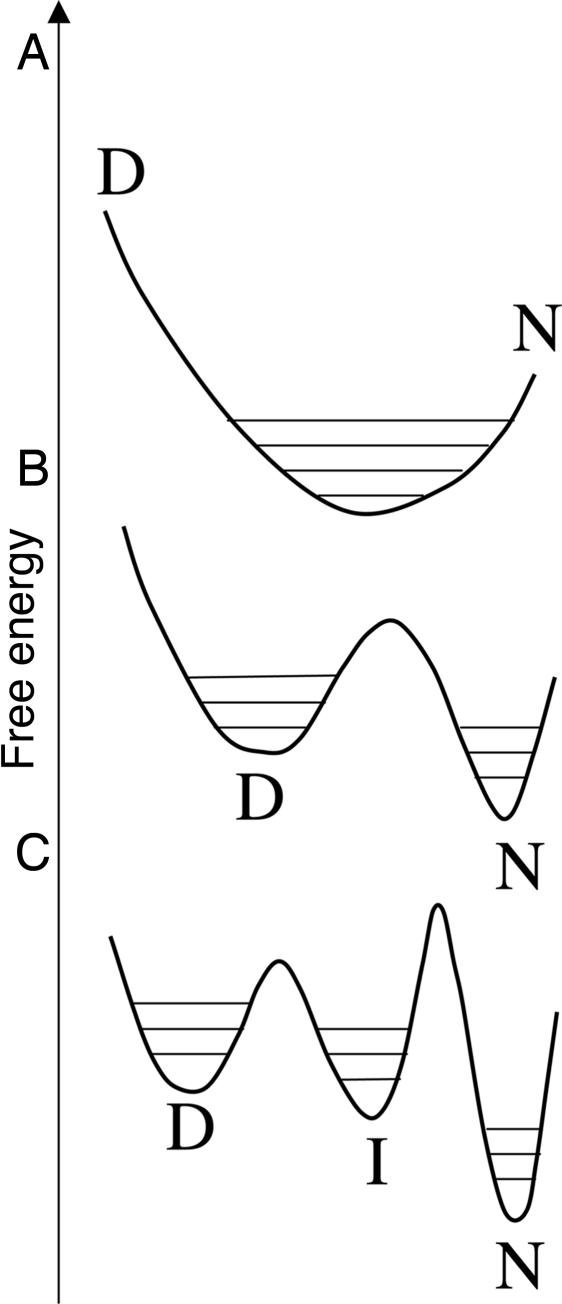
There are two fundamental problems in falsifying the uni- and multimodal mechanisms for fast folding proteins; one inherent in the very nature of proteins, the other a problem of mechanistic equivalence. First, the quantitative biophysical analysis of protein structure and energetics is particularly difficult because all of the states involved are dynamic ensembles of structures that can change according to conditions (Fig. 2). The denatured state is a very loose ensemble of structures, the compactness of which varies considerably from protein to protein under conditions that favor folding. Folding intermediates have more restricted ensembles. However, even native structures have a rich variety of dynamic processes that can lead to small or larger changes in structure with changing conditions (20–22). Accordingly, all states are ensembles, occupying a range of conformations and free-energy levels within their wells. Thus, there is the basic problem of distinguishing one set of conformations occupying a very broad free-energy well from two sets of conformations in two adjacent free-energy wells, one of which is broad and the other narrower (Fig. 2). This situation is further complicated when there are folding intermediates. Second, rapid equilibration between states leads to a classical mechanistically equivalent situation, which often occurs in spectroscopy: if the time scale of observation is much longer than that of the interconversion, then it is very difficult, and usually impossible, to determine whether there are separate states or a just single one that has the weighted average properties of the individual states. Thus, it is inherently problematic to prove for rapidly folding and unfolding proteins whether there are separate N and D states that are in rapid equilibrium or a single unimodal species that has the weighted mean properties of N and D. For example, if the changes in enthalpy and specific heat of the unimodal system are linearly related to the change in spectral signal that is used to monitor the system, then it may be shown that the unimodal system will appear to undergo cooperative thermal denaturation (unpublished data). Similarly, if during chemical denaturation, the change in free-energy and the solvent accessible surface area (SASA) of the unimodal system are linearly related to its change in spectral signal, then it will appear to undergo cooperative unfolding. Accordingly, it is very difficult to falsify downhill folding from equilibrium experiments that make macroscopic measurements on ensembles of molecules. Alternatively, discrepancies from two-state behavior can generally be accounted for by assuming the presence of on- or off-pathway folding intermediates, and so cooperative folding is difficult to falsify.
Fig. 2.
Free-energy wells for different mechanisms. (A) Unimodal folding. (B) Two-state with N and D states in broad wells. (C) Three-state with an intermediate.
In principle, one can distinguish between cooperative and unimodal folding by NMR-monitored studies of the behavior of individual residues during thermal unfolding (23). The finding of coincident melting curves for individual side sides, as found for the full-length BBL PSBD (23, 24), is strong, if not conclusive, evidence for a cooperative transition. However, the finding of a spread of Tm values, as recently reported for NapBBL, is not necessarily proof of a noncooperative transition for several reasons. (i) The calculation of an accurate value of Tm requires a large range of temperature for the adequate determination of the slopes of the base lines, and this is not possible for proteins with a low enthalpy of denaturation (discussed at length in ref. 25). (ii) The change in structure and dynamics of the protein within the separate free-energy wells of Fig. 2 may perturb the apparent values of Tm, as will also the intrusion of intermediates or residual structure in the denatured state. (iii) The changes in ionization state of histidine and other residues during thermal denaturation may perturb the chemical shifts of neighboring residues. Because of these effects, it is very difficult to distinguish between a genuine spread of Tm values during thermal denaturation and an error distribution due to experimental uncertainties and structural changes in native states and intermediates. For example, although it has recently been reported that NapBBL unfolds with a range of values of Tm for individual side chains (3), the data fit adequately well to a cooperative transition with a fundamentally single value of Tm that has a distribution of experimental errors and normal structural perturbations from dynamics and changes of pKa with temperature (26). In view of the ambiguities of standard equilibrium measurements, we here attempt to distinguish between the mechanisms using kinetics and single-molecule studies.
Results and Discussion
Chevron Plots.
A way of distinguishing between downhill and barrier-limited folding is the use of kinetics. Individual rate constants for folding and unfolding of two-state proteins under conditions of chemical denaturation follow the equations
where [Den] is the concentration of denaturant, m‡-N and m‡-D are proportional to the change of SASA between the transition state and the native or denatured states, respectively (27), and kfold is the rate constant for folding, etc. Usually, both m‡-N and m‡-D are significant, although in extreme examples m‡-N can be very low, but as a consequence, m‡-D is high. Linearity in the plots can break down if there is a change of rate determining step over the range of [Den] (28) or there is a movement in the transition or denatured state structures (29–31).
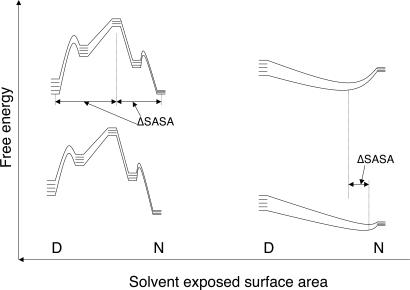
In a relaxation kinetics experiment that is used for fast folding proteins, the observed rate constant for relaxation for apparent two-state kinetics is given by kobs = kfold + kunfold. A plot of lnkobs versus [Den] gives the so-called chevron plot. Simulations suggest that cooperativity is required to generate a chevron plot with linear unfolding and refolding arms (32). We now argue from basic principles that the chevron with one or two steep linear arms is the hallmark of a cooperative transition. In classical cooperative refolding, there is a large value of m‡-D because there is a large change in SASA between the D and transition states (Fig. 3). Cooperative folding invokes a step-function large change in structure between the transition state and least one of the ground states, and so there has to be at least one large change in SASA. In a series of relaxation experiments where there are temperature jumps made over a range of denaturant concentrations, lnkfold will vary significantly with [Den] for at least one limb of the chevron, usually the refolding limb, because of the large value of m‡-D. However, for a unimodal system, there is not a discrete jump in SASA via a different state, but merely a small movement of the ensemble of structures at the lower temperature to a slightly less native-like content at the higher temperature. Accordingly, there is just a small increase in the SASA, and so the denaturant will have just a small effect on the kinetics. The relaxation rate constant for an incremental change in a single well of downhill folding will generate a relatively flat chevron. Thus, the finding of a steep refolding limb in a chevron plot is inconsistent with downhill folding. The chevron test can be applied to the BBL homologs.
Fig. 3.
Comparison of relaxation kinetics of a two-state reaction, which always involves a significant change in SASA, with a relaxation in a single well, which is accompanied by only incremental changes in SASA on small perturbations of the system, as done for small temperature jumps.
Members of the BBL family have acceptable chevron plots and fit cooperative denaturation profiles, with BBL having a very narrow spread of individual-residue Tm values monitored for the 15 well resolved NMR chemical shifts with good baselines for curve fitting (23, 24, 33). Other residues of BBL could not be followed because of problems of exchange and spectral overlap, even when using isotope-filtered NMR experiments. The PSBD Phe166Trp mutant E3BD from Bacillus stearothermophilus (14, 34) folds strictly according to two-state criteria (23, 24), with a long linear arm in its refolding chevron, reaching a refolding rate constant of 27,500 s−1 with no roll-over (33).
Naganathan et al. (4) claim that, by analyzing the shapes of differential scanning calorimetric thermograms, they can measure the barrier heights to folding. Application to wild-type E3BD predicts that it folds with a zero free-energy barrier and is a pure downhill folder. [The rate constant used in that analysis for its folding was, in fact, measured by an NMR line broadening procedure that assumed two separate states in intermediate exchange (14).] Naganathan et al. (4) incorrectly extrapolated the rate constant for folding of the Phe166Trp mutant of E3BD in their analyses and claimed it deviated from their plots. In fact, the surface mutation of Phe to Trp has minimal effects on structure (23, 35) and stability (23) and its folding rate constant fits on their plots as being a downhill folder. However, its excellent chevron with straight arms is inconsistent with unimodal folding but consistent with a cooperative transition.
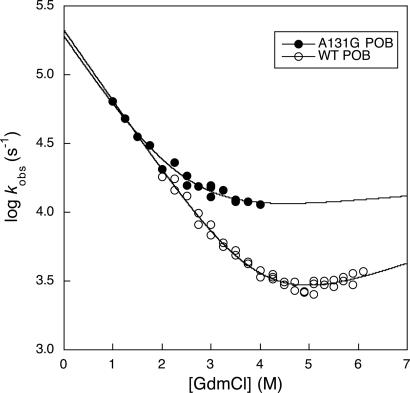
The PSBD from Pyrobaculum aerophilum, POB, folds faster still (23). The chevron of wild-type POB can be followed down to 2 M GdmCl, with an observed rate constant of 18,000 s−1 at 298 K, extrapolating to 2 × 10⁵ s−1 in water (23). Measurements below 2 M were not feasible because the protein is too stable and too little denatured form is produced on a temperature jump to be detected with our equipment. However, we have now found that the less-stable mutant A131G has a good sloping chevron down to 1 M GdmCl, with an observed value of 64,000 s−1 (Fig. 4). Thus, full-length PSBDs fold according to a classical cooperative transition at rate constants well in excess of the predicted transition to unimodal downhill folding (4).
Fig. 4.
Chevron plot for the folding of the BBL homologue Ala131Gly and wild-type POB PSBD at 298 K (wild-type data from ref. 34).
Single-Molecule Experiments.
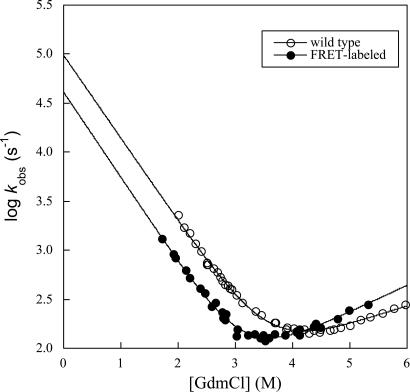
Single-molecule experiments can give conclusive answers. The B domain of Protein A (BDPA) is an ultrafast folding protein (17, 36, 37). Its refolding rate constant at 298 K in water is 105 s−1 (24). A Φ-analysis using multiple optical probes shows that it folds cooperatively (38). BDPA is an excellent model to distinguish between unimodal folding and conventional bimodal folding because it folds ultrarapidly in water and so falls into predicted unimodal downhill folding time range (>40,000 s−1; ref. 4). The FRET-labeled derivative prepared here folds at 40,000 s−1 (Fig. 5). However, its D–N relaxation rate in GdmCl slows down to ≈200 s−1 between 2 and 4 M GdmCl, which is in the single-molecule detection time range of ms. This feature allows the direct observation of the conformational distribution at single molecule level.
Fig. 5.
Chevron plot for the folding of wild-type and double-labeled protein A at 298 K.
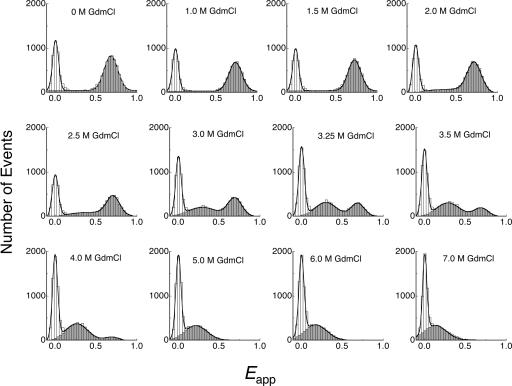
The single-molecule FRET studies showed directly that there is a bimodal distribution of native and denatured states for a suitable double-labeled sample of BDPA that folds at a similar rate to wild type (Fig. 6). There was only one peak with high FRET efficiency (centered at Eapp ≈ 0.7) in the histogram at 0 M GdmCl, corresponding to the native state of BDPA. With increasing of GdmCl concentration, another peak corresponding to the denatured state centred at Eapp ≈ 0.3 appeared. This peak had a much lower FRET efficiency and suggests a very expanded ensemble. Although the relative population of the native ensemble decreased with GdmCl concentration, the native peak does not shift obviously across the whole range of GdmCl concentration. A very slight shift was observed, which is due to the change of fluorescence quantum yield and refractive index. The invariant peak position of the native peak implies a constant native state, not changing with environment. In contrast, the denatured peak shifted from Eapp ≈ 0.3 to <0.2, indicating a more expanded denatured ensemble at higher concentration of GdmCl, which is consistent with previous reports (39). The single molecule FRET experiments show the existence of two distinct ensembles that are separated by a considerable free-energy barrier, which is inconsistent with unimodal folding.
Fig. 6.
Single molecule histogram of apparent FRET efficiency (Eapp) for the double-labeled BDPA. The solid line is the Gaussian fit of the histogram, with the “zero” peak included in feint.
For proteins folding faster than milliseconds under denaturing conditions, for example BBL, better time resolution will be required to distinguish between bimodal and unimodal folding mechanisms. Although it is extremely difficult to falsify downhill folding by equilibrium measurements, single-molecule studies and kinetics strongly imply that a genuine example of unimodal or downhill folding has yet to be found.
In conclusion, the experimental data reported so far for the destabilized, chemically labeled truncated PSBD, NapBBL, are ambiguous and do not adequately distinguish between cooperative and unimodal folding. The full-length PSBDs E3BD, BBL, and POB fold cooperatively with barrier-limited kinetics faster than that predicted for the onset of downhill folding. The sets of proteins that we have studied with rate constants of up to 105 s−1, as exemplified by the PSBDs and BBPA, may be adequately analyzed by conventional kinetics and are suitable for Φ-analysis. A 35-residue subdomain of the chicken villin headpiece folds by barrier-limited kinetics at ≈106 s−1 (40), suggesting that the onset of downhill folding may be far higher still than that predicted.
Experimental Methods
Protein Labeling.
Two cysteine residues were introduced into Protein A at position 10 and 59, respectively, and purified as described (38). The labeling reaction was carried out in Tris buffer (pH 7.4, 50 mM Tris and 100 mM NaCl) with protein concentration of 100 μM, 4-fold excess of dye, and 2-fold excess of Tris(2-carboxyethyl)phosphine hydrochloride (TCEP). Cys-59 was labeled with Alexa Fluor 488. To achieve site-specific labeling, 2-fold excess of IgG was applied to protect Cys-10, which is at the binding site of Protein A-IgG complex (41). Single-labeled protein was purified on HPLC and followed by labeling of Cys-10 with Alexa Fluor 647.
Single-Molecule FRET Measurements.
A home-built dual-channel confocal fluorescence microscope was used to detect freely diffusing single molecules (42). FRET pair (Alexa Fluor 488/Alexa Fluor 647) labeled Protein A sample was excited by an Argon ion laser (Model 35LAP321–230; Melles Griot, Didam, The Netherlands) with 50 μW at 488 nm. The donor and acceptor fluorescence were collected simultaneously through an oil-immersion objective (Apochromat × 60, numerical aperture 1.45; Nikon, Surrey, U.K.) as the protein molecules diffuse through the laser focus, separated by a dichroic mirror (585DRLP; Omega Optical, Brattleboro, VT), filtered by long-pass and bandpass filters and detected separately by two photon-counting modules (SPCM-AQR14; PerkinElmer, Fremont, CA). The output of the two detectors was recorded by two computer-implemented multichannel scalar cards (MCS-PCI; EG&G, Quebec, QC, Canada). Sample solutions of 50–100 pM diluted in ≈1 μM unlabelled Protein A in PBS buffer (pH 7.4, 10 mM phosphate and 100 mM NaCl) were used to achieve single-molecule detection while reducing surface adsorption. All experiments were carried out at 20°C. A threshold of 30 counts per ms bin for the sum of the donor and acceptor fluorescence signals was used to differentiate single molecule bursts from the background. Because we use Alexa-647 as the acceptor, direct excitation of the acceptor is negligible. Apparent FRET efficiencies, Eapp, of each burst were calculated according to Eapp = nA/(nA + nD), where nA and nD are the background corrected acceptor and donor counts, respectively. Measurements were repeated at different denaturant concentrations and single molecule FRET histograms were built accordingly.
Single-molecule experiments at different excitation laser power proved that the “zero” peak in the apparent FRET histogram is predominantly due to the photobleaching (photoisomerization) of the FRET acceptor Alexa Fluor 647. Donor-only labeled protein shows that the “zero” peak disappears at Eapp > 0.2.
Kinetics.
Temperature jump studies were performed at 298 K as described for protein A (38, 43). Chevron data for POB Y166W (pseudo wild-type POB) and POB Y166W A131G (POB A131G) were acquired by using a modified Hi-Tech PTJ-64 temperature-jump apparatus with a 3 mm by 3 mm or 5 mm by 5 mm cell. Solutions of 300–600 μM protein in 50 mM sodium acetate (pH 5.7, ionic strength adjusted to 150 mM, with appropriate concentrations of denaturant), were degassed with stirring for ≈40 min before the experiment. Temperature jumps of 1–3.5 K to a final temperature of 298 K were used, and folding was monitored by fluorescence emission at >335 nm. Twenty to forty traces were acquired and averaged for each measurement, data from within the heating time of the instrument was discarded, and the resulting transient was fitted to a single exponential function. The dependence of rate constant on concentration of denaturant was fitted to a modified two-state chevron equation (23) with the denaturation midpoint constrained to the value from equilibrium chemical denaturation (for POB wild-type) or the value calculated from equilibrium thermal stability and the average equilibrium m value for 20 mutants (for POB A131G, where the equilibrium chemical denaturation had a truncated native baseline). The fits for protein A had no constraints. In all cases, there was excellent agreement between the kinetic and equilibrium m values, as is required for two-state kinetics (44).
Acknowledgments
L.Y. is a recipient of a Biotechnology and Biological Sciences Research Council David Phillips Research Fellowship.
Abbreviations
- PSBD
peripheral subunit binding domain
- SASA
solvent accessible surface area
- BDPA
B domain of Protein A.
Footnotes
The authors declare no conflict of interest.
Brewer, S. H., Vu, D. M., Tang, Y. F., Raleigh, D. P., Dyer, R. B., Franzen, S. (2005) Biophys J 88:561A (abstr.).
References
- 1.Bryngelson JD, Onuchic JN, Socci ND, Wolynes PG. Proteins. 1995;21:167–195. doi: 10.1002/prot.340210302. [DOI] [PubMed] [Google Scholar]
- 2.Garcia-Mira MM, Sadqi M, Fischer N, Sanchez-Ruiz JM, Muñoz V. Science. 2002;298:2191–2195. doi: 10.1126/science.1077809. [DOI] [PubMed] [Google Scholar]
- 3.Sadqi M, Fushman D, Muñoz V. Nature. 2006;442:317–321. doi: 10.1038/nature04859. [DOI] [PubMed] [Google Scholar]
- 4.Naganathan AN, Sanchez-Ruiz JM, Muñoz V. J Am Chem Soc. 2005;127:17970–17971. doi: 10.1021/ja055996y. [DOI] [PubMed] [Google Scholar]
- 5.Knott M, Chan HS. Proteins. 2006;65:373–391. doi: 10.1002/prot.21066. [DOI] [PubMed] [Google Scholar]
- 6.Naganathan AN, Perez-Jimenez R, Sanchez-Ruiz JM, Muñoz V. Biochemistry. 2005;44:7435–7449. doi: 10.1021/bi050118y. [DOI] [PubMed] [Google Scholar]
- 7.Naganathan AN, Doshi U, Fung A, Sadqi M, Muñoz V. Biochemistry. 2006;45:8466–8475. doi: 10.1021/bi060643c. [DOI] [PMC free article] [PubMed] [Google Scholar]
- 8.Zeeb M, Balbach J. Methods. 2004;34:65–74. doi: 10.1016/j.ymeth.2004.03.014. [DOI] [PubMed] [Google Scholar]
- 9.Killick TR, Freund SMV, Fersht AR. FEBS Lett. 1998;423:110–112. doi: 10.1016/s0014-5793(98)00075-1. [DOI] [PubMed] [Google Scholar]
- 10.Deniz AA, Laurence TA, Beligere GS, Dahan M, Martin AB, Chemla DS, Dawson PE, Schultz PG, Weiss S. Proc Natl Acad Sci USA. 2000;97:5179–5184. doi: 10.1073/pnas.090104997. [DOI] [PMC free article] [PubMed] [Google Scholar]
- 11.Jacob M, Holtermann G, Perl D, Reinstein J, Schindler T, Geeves MA, Schmid FX. Biochemistry. 1999;38:2882–2891. doi: 10.1021/bi982487i. [DOI] [PubMed] [Google Scholar]
- 12.Schuler B, Lipman EA, Eaton WA. Nature. 2002;419:743–747. doi: 10.1038/nature01060. [DOI] [PubMed] [Google Scholar]
- 13.Huang GS, Oas TG. Proc Natl Acad Sci USA. 1995;92:6878–6882. doi: 10.1073/pnas.92.15.6878. [DOI] [PMC free article] [PubMed] [Google Scholar]
- 14.Spector S, Raleigh DP. J Mol Biol. 1999;293:763–768. doi: 10.1006/jmbi.1999.3189. [DOI] [PubMed] [Google Scholar]
- 15.Mayor U, Johnson CM, Daggett V, Fersht AR. Proc Natl Acad Sci USA. 2000;97:13518–13522. doi: 10.1073/pnas.250473497. [DOI] [PMC free article] [PubMed] [Google Scholar]
- 16.Myers JK, Oas TG. Annu Rev Biochem. 2002;71:783–815. doi: 10.1146/annurev.biochem.71.110601.135346. [DOI] [PubMed] [Google Scholar]
- 17.Dimitriadis G, Drysdale A, Myers JK, Arora P, Radford SE, Oas TG, Smith DA. Proc Natl Acad Sci USA. 2004;101:3809–3814. doi: 10.1073/pnas.0306433101. [DOI] [PMC free article] [PubMed] [Google Scholar]
- 18.Kubelka J, Hofrichter J, Eaton WA. Curr Opin Struct Biol. 2004;14:76–88. doi: 10.1016/j.sbi.2004.01.013. [DOI] [PubMed] [Google Scholar]
- 19.Zhu Y, Alonso DOV, Maki K, Huang CY, Lahr SJ, Daggett V, Roder H, DeGrado WF, Gai F. Proc Natl Acad Sci USA. 2003;100:15486–15491. doi: 10.1073/pnas.2136623100. [DOI] [PMC free article] [PubMed] [Google Scholar]
- 20.Fersht A. Structure and Mechanism in Protein Science: A Guide to Enzyme Catalyis and Protein Folding. New York: Freeman; 1998. [Google Scholar]
- 21.Korzhnev DM, Salvatella X, Vendruscolo M, Di Nardo AA, Davidson AR, Dobson CM, Kay LE. Nature. 2004;430:586–590. doi: 10.1038/nature02655. [DOI] [PubMed] [Google Scholar]
- 22.Karplus M, McCammon JA. Nat Struct Biol. 2002;9:646–652. doi: 10.1038/nsb0902-646. [DOI] [PubMed] [Google Scholar]
- 23.Ferguson N, Sharpe TD, Schartau PJ, Sato S, Allen MD, Johnson CM, Rutherford TJ, Fersht AR. J Mol Biol. 2005;353:427–446. doi: 10.1016/j.jmb.2005.08.031. [DOI] [PubMed] [Google Scholar]
- 24.Ferguson N, Schartau PJ, Sharpe TD, Sato S, Fersht AR. J Mol Biol. 2004;344:295–301. doi: 10.1016/j.jmb.2004.09.069. [DOI] [PubMed] [Google Scholar]
- 25.Religa TL, Markson JS, Mayor U, Freund SMV, Fersht AR. Nature. 2005;437:1053–1056. doi: 10.1038/nature04054. [DOI] [PubMed] [Google Scholar]
- 26.Ferguson N, Sharpe TDS, Johnson CM, Schartau PJ, Fersht AR. Nature. 2006 in press. [Google Scholar]
- 27.Tanford C. Adv Prot Chem. 1970;24:1–95. [PubMed] [Google Scholar]
- 28.Matouschek A, Kellis JT, Serrano L, Bycroft M, Fersht AR. Nature. 1990;346:440–445. doi: 10.1038/346440a0. [DOI] [PubMed] [Google Scholar]
- 29.Matouschek A, Fersht AR. Proc Natl Acad Sci USA. 1993;90:7814–7818. doi: 10.1073/pnas.90.16.7814. [DOI] [PMC free article] [PubMed] [Google Scholar]
- 30.Shen TY, Hofmann CP, Oliveberg M, Wolynes PG. Biochemistry. 2005;44:6433–6439. doi: 10.1021/bi0500170. [DOI] [PubMed] [Google Scholar]
- 31.Schatzle M, Kiefhaber T. J Mol Biol. 2006;357:655–664. doi: 10.1016/j.jmb.2005.12.081. [DOI] [PubMed] [Google Scholar]
- 32.Kaya H, Liu ZR, Chan HS. Biophys J. 2005;89:520–535. doi: 10.1529/biophysj.104.057471. [DOI] [PMC free article] [PubMed] [Google Scholar]
- 33.Ferguson N, Sharpe TD, Johnson CM, Fersht AR. J Mol Biol. 2006;356:1237–1247. doi: 10.1016/j.jmb.2005.12.016. [DOI] [PubMed] [Google Scholar]
- 34.Spector S, Young P, Raleigh DP. Biochemistry. 1999;38:4128–4136. doi: 10.1021/bi982915k. [DOI] [PubMed] [Google Scholar]
- 35.Allen MD, Broadhurst RW, Solomon RG, Perham RN. FEBS J. 2005;272:259–268. doi: 10.1111/j.1432-1033.2004.04405.x. [DOI] [PubMed] [Google Scholar]
- 36.Arora P, Oas TG, Myers JK. Protein Sci. 2004;13:847–853. doi: 10.1110/ps.03541304. [DOI] [PMC free article] [PubMed] [Google Scholar]
- 37.Vu DM, Myers JK, Oas TG, Dyer RB. Biochemistry. 2004;43:3582–3589. doi: 10.1021/bi036203s. [DOI] [PubMed] [Google Scholar]
- 38.Sato S, Religa TL, Fersht AR. J Mol Biol. 2006;360:850–864. doi: 10.1016/j.jmb.2006.05.051. [DOI] [PubMed] [Google Scholar]
- 39.Kuzmenkina EV, Heyes CD, Nienhaus GU. Proc Natl Acad Sci USA. 2005;102:15471–15476. doi: 10.1073/pnas.0507728102. [DOI] [PMC free article] [PubMed] [Google Scholar]
- 40.Kubelka J, Chiu TK, Davies DR, Eaton WA, Hofrichter J. J Mol Biol. 2006;359:546–553. doi: 10.1016/j.jmb.2006.03.034. [DOI] [PubMed] [Google Scholar]
- 41.Nakanishi T, Miyazawa M, Sakakura M, Terasawa H, Takahashi H, Shimada I. J Mol Biol. 2002;318:245–249. doi: 10.1016/S0022-2836(02)00018-9. [DOI] [PubMed] [Google Scholar]
- 42.Ying L, Green JJ, Li H, Klenerman D, Balasubramanian S. Proc Natl Acad Sci USA. 2003;100:14629–14634. doi: 10.1073/pnas.2433350100. [DOI] [PMC free article] [PubMed] [Google Scholar]
- 43.Sato S, Religa TL, Dagget V, Fersht AR. Proc Natl Acad Sci USA. 2004;101:6952–6956. doi: 10.1073/pnas.0401396101. [DOI] [PMC free article] [PubMed] [Google Scholar]
- 44.Jackson SE, Fersht AR. Biochemistry. 1991;30:10428–10435. doi: 10.1021/bi00107a010. [DOI] [PubMed] [Google Scholar]


