

Abstract
Objective.
Stimulus-driven salience is determined involuntarily, and by the physical properties of a stimulus. It has recently been theorized that neural coding of this variable involves oscillatory activity within cortical neuron populations at beta frequencies. This was tested here through experimental manipulation of inter-stimulus interval (ISI).
Methods.
Non-invasive neurophysiological measures of event-related gamma (30-50 Hz) and beta (12-20 Hz) activity were estimated from scalp-recorded evoked potentials. Stimuli were presented in a standard “paired-stimulus” sensory gating paradigm, where the S1 (conditioning) stimulus was conceptualized as long-ISI, or “high salience,” and the S2 (test) stimulus as short-ISI, or “low salience.” Three separate studies were conducted: auditory stimuli only (N=20 participants), somatosensory stimuli only (N=20), and a cross-modal study for which auditory and somatosensory stimuli were mixed (N=40).
Results.
Early (20-150 ms) stimulus-evoked beta activity was more sensitive to ISI than temporally-overlapping gamma band activity, and this effect was seen in both auditory and somatosensory studies. In the cross-modal study, beta activity was significantly modulated by the similarity (or dissimilarity) of stimuli separated by a short ISI (0.5 s); a significant cross-modal gating effect was nevertheless detected.
Conclusions.
With regard to the early sensory-evoked response recorded from the scalp, the interval between identical stimuli especially modulates beta oscillatory activity.
Significance.
This is consistent with developing theories regarding the different roles of temporally-overlapping oscillatory activity within cortical neuron populations at gamma and beta frequencies, particularly the claim that the latter is related to stimulus-driven salience.
Keywords: Attention, Electrophysiology, Event-related potential, Event-related oscillations, Perception, Stimulus salience
1. Introduction
Stimulus-driven salience, a property that reflects an unexpected sensory element′s relative importance to an individual, is automatically (i.e., involuntarily) determined by the physical features of that stimulus (James, 1890; Naatanen, 1992; Treisman and Gelade, 1980). The specific stimulus properties that confer salience in a stimulus-driven manner have been documented in the autonomic orienting literature (Sokolov, 1963) and include stimulus intensity (Edwards, 1974; James and Hughes, 1969), stimulus novelty (Berlyne et al., 1963; Siddle et al., 1983), and the degree of contrast between a stimulus and its sensory background (Ben-Shakhar et al., 2000; Lyytinen et al., 1992). Another property that confers stimulus-driven salience, and the focus of the present report, is inter-stimulus interval (ISI) which is related to a stimulus′ rarity (Gatchel and Lang, 1974; Graham, 1973). In general, “stimulus-driven” salience is to be distinguished from “task-driven” salience, the latter being voluntarily assigned by an individual′s top-down allocation of selective attention (Kastner and Ungerleider, 2000; Schneider and Shiffrin, 1977; Theeuwes, 1994; van Zoest and Donk, 2004).
It has recently been proposed that bottom-up processing of stimulus-driven salience by cortical neuron populations corresponds to oscillatory neural activity within specific separable frequency bands. Using in vitro preparations and computer simulations, Traub et al. (1999) have shown that neuron populations respond to stimulation with action potential bursts that recur at a gamma rhythm (30-100 Hz). When the stimulation was relatively intense, the action potential bursts subsequently transitioned to a beta rhythm (10-25 Hz). This transition did not occur after stimulation at lower stimulus intensities, although the gamma rhythm was still observed. Scalp-recorded electroencephalographic measures of neuron population activity in the intact human brain have been shown to exhibit a similar pattern of response to stimulus-driven salience: Haenschel et al. (2000) demonstrated that an evoked gamma band response was followed by a robust beta band response, but only when the auditory stimulus suddenly changed from the ongoing acoustic background. This apparent gamma-to-beta transition occurred within 150 ms of stimulus onset in response to these high salience stimuli. Thus, although Traub et al. (1999) and Haenschel et al. (2000) employed substantively different neurophysiological measures of neuron population activity, and although they operationalized “salience” differently, they both highlighted the sensitivity of evoked beta band activity to stimulus-driven salience.
The outcome of these and other investigations led to the hypotheses that event-related neural activity in the gamma band reflects obligatory processing of sensory stimulus features (Clementz and Blumenfeld, 2001; Karakas and Basar, 1998), and the subsequent beta activity “flags” a stimulus as salient (Traub et al., 1999) and thus a candidate for subsequent involuntary attention switching (Whittington et al., 1997). Further supporting evidence includes the finding that gamma oscillations are generally localized to specific sensory cortical regions (Barth and MacDonald, 1996; Pantev et al., 1991; Pantev, 1995) whereas beta activity exhibits more widespread expression across cortex and more robust synchronization between cortical regions including association areas (Roelfsema et al., 1997; von Stein et al., 1999). Nevertheless, applicability of this theory to a general neural model of stimulus-driven salience processing requires empirical demonstrations that other relevant properties, such as novelty and ISI, also appropriately modulate oscillatory neuron population activity, especially in the beta band.
Through the use of non-invasive neurophysiological measures of event-related oscillatory neural activity, the present study was designed to test predictions of the gamma-to-beta transition theory, specifically for experimental manipulation of stimulus-driven salience in the form of ISI. If gamma activity corresponds to obligatory stimulus processing and beta activity to a subsequent salience signal, then a differential pattern of modulation by ISI should be observed for neural activity within these two frequency bands. For example, if a stimulus were presented at two different ISIs, “long” and “short,” amplitude of the event-related beta response should be larger to the long-ISI stimulus (i.e., the stimulus of higher salience) than to the short-ISI stimulus (i.e., the stimulus of lower salience). By contrast, amplitude of the gamma response, corresponding to elementary processing of the stimulus itself, should exhibit relatively little sensitivity to ISI. Further, if this model applies generally to cortical processing of stimulus-driven salience, then the predictions should hold for multiple sensory modalities (e.g., auditory and somatosensory). However, when stimuli from different modalities follow each other at short ISIs, the event-related beta response should be significantly larger than when stimuli from the same modality follow each other. This can be understood by considering that stimulus-driven salience reflects not only ISI, but also the identity of the particular stimulus. In other words, changing the identity of a stimulus (in this case from an auditory stimulus to a somatosensory stimulus, or vice versa) should lead to an apparent “dishabituation” pattern for the evoked beta response at short ISI (Dawson et al., 1989; Siddle and Jordan, 1993). If such a pattern were not observed, it would be difficult to rule out the possibility that reduced amplitude beta response as a function of reduced ISI simply reflects global cortical refractoriness. We did not expect this more trivial explanation for dependence of beta response on ISI to be applicable here: within-modality changes in stimulus identity (e.g., a change in the frequency of auditory tones), even at fixed ISI, has been shown to produce increased beta response amplitude (Haenschel et al., 2000). A similarly robust dishabituation of event-related gamma-band activity by changing stimulus identity at short ISI was not expected here: even when stimuli are presented at short ISI, obligatory stimulus processing should not depend upon the physical match or mismatch to the preceding stimulus.
Neural processing of ISI has commonly been investigated with a “sensory gating” paradigm (Adler et al., 1998; Boutros and Belger, 1999; Braff and Geyer, 1990; Kisley et al., 2004). The paradigm involves the presentation of an unchanging sensory stimulus, but at varied intervals between presentations (e.g., 0.5 and 9 s). This has been described as a paired-stimulus paradigm, where stimuli separated by 0.5 s represent a “pair,” and the 9 s interval is considered the “inter-pair interval.” For the present study the stimuli were instead analyzed individually and characterized by the ISI preceding them, either short (0.5 s) or long (9 s), corresponding to “low” and “high” stimulus-driven salience respectively. Comparing this conceptualization to previous literature, a long-ISI stimulus corresponds to the “conditioning” or S1 stimulus, and the short-ISI stimulus corresponds to the “test” or S2 stimulus. Most commonly investigated in auditory sensory gating studies are broadband event-related potential (ERP) components P1 (“ P50”) and N1 (“ N100”), both of which are typically larger in response to stimuli of higher salience (i.e., longer ISI) and both of which exhibit maximal deflection before about 125 ms post-stimulus. Here, by contrast, the analysis of neural activity was focused on event-related oscillatory activity in the gamma and beta bands (see also Clementz and Blumenfeld, 2001; Crawford et al., 2002; Hong et al., 2004; Johannesen et al., 2005; Muller et al., 2001). Although sensory gating has previously been studied in both auditory and somatosensory domains (Arnfred et al., 2001b), the present investigation included a “cross-modal” condition where auditory and somatosensory stimuli were presented during a single recording session, and were separated by a short ISI.
Although estimation of both “evoked” and “induced” oscillations are possible from non-invasive neurophysiological measures of cortical activity, the primary focus here was on the relatively early evoked (i.e., phase-locked) activity. Whereas in vitro studies have typically investigated oscillations that are not necessarily phase-locked to a stimulus (i.e., induced), Haenschel et al. (2000) found that only the early (20-150 ms) phase-locked oscillations exhibit the expected gamma-to-beta transition pattern in response to high salience stimuli for scalp-recorded measures of intact human brain activity. Later (200-400 ms) induced oscillations were detected in that study, but beta activity preceded gamma activity in that latency window. Also, stimulus-induced gamma oscillations in this latency range are generally thought to relate to conscious perception and cognitive processing of a stimulus (Herrmann et al., 2004; Muller et al., 2000; Tallon-Baudry and Bertrand, 1999), and thus were not expected to be significantly modulated by ISI for task-irrelevant (i.e., ignored) stimuli here. A final reason for focusing on early, stimulus-locked activity was that we wanted to compare our findings to more standard, ERP-based studies of sensory gating. These studies have employed stimulus-locked time-domain averaged waveforms, which highlight only phase-locked oscillations, whereas non-phase-locked oscillations are averaged out (Kalcher and Pfurtscheller, 1995; Klimesch et al., 1998). Nevertheless, and for the sake of completeness, analysis of stimulus-induced oscillations has been included in the present report, but without specific predictions regarding their relationship to stimulus-driven salience.
Based on the theorized roles of neural activity within gamma and beta frequency bands, the following hypotheses were tested for non-invasively measured early (20-150 ms), phase-locked (“ evoked”) activity: 1) amplitude of the evoked beta response will be modulated by ISI, but the amplitude of the evoked gamma response will be significantly less sensitive to ISI; 2) this will be true for any sensory modality tested; 3) the similarity (or dissimilarity) of stimuli separated by a short interval will significantly modulate amplitude of the evoked beta response, but not necessarily the evoked gamma response. These hypotheses were tested by within-subjects, repeated-measures design. Differences in the sensitivity of event-related beta and gamma activity to manipulated variables were detected as interaction effects. Post hoc, and to allow a preliminary comparison to the sensory gating literature that typically employs measurement of broadband ERPs, the modulation of auditory evoked responses by ISI were compared between oscillatory responses and ERP components P1 and N1.
2. Methods
Procedures were approved by the University of Colorado at Colorado Springs Institutional Review Board. Participants gave written informed consent before participating, and received monetary compensation or academic extra credit upon completion of the study.
2.1. Participants
Healthy adults between 18 and 36 years of age participated in three separate studies involving either auditory-only stimulation, somatosensory-only stimulation, or combined auditory and somatosensory stimulation. Exclusion criteria for all subjects (based on self-report) included current diagnosis of psychiatric or neurological illness, current psychoactive drug use, and past traumatic brain injury. Hearing was tested at 1000 Hz (Interacoustics Audiometer AS208) and subjects were excluded if they exhibited greater than 15 dB hearing loss in either ear. Only those participants that completed a study and yielded useful data (i.e., stayed awake for the entire study and had a recording free from excessive artifact) were included. Data collection continued until the targeted number of participants was reached for each study: for the auditory-only study this was 20 participants (8 male), mean age 23.7 years (SD = 5.0); for the somatosensory-only study, 20 participants (7 male), mean age 22.6 years (SD = 4.9); for the combined auditory/somatosensory study, 40 participants (16 male) mean age 21.9 years (SD = 4.7). A larger sample was targeted for the combined study because the anticipated statistical interaction effect involved 3 variables (as opposed to 2 variables for each of the single-modality studies). Before exclusion for study completion and recording problems, the total number of participants was 23, 22 and 46 for auditory, somatosensory and combined studies respectively. No individual participated in more than one study.
Because nicotine′s demonstrated modulatory effect on sensory gating lasts less than 60 minutes (Adler et al., 2001; Adler et al., 1992), recordings were not conducted until at least 1 hour after any participant had smoked. None of the smokers were recorded during a withdrawal period that exceeded normal daily routine (number of smokers = 5, 4, and 8 for auditory, somatosensory and combined studies respectively).
2.2 Stimuli and tasks
Ongoing electroencephalographic activity was recorded while participants sat in a reclining chair watching a silent, closed-captioned movie. Because stress can modulate sensory gating (Johnson and Adler, 1993; White and Yee, 1997) all movies were selected for minimal arousal-value by the subjective criterion of being appropriate for young children. Stimulus paradigms were programmed and presented with Eprime (Psychology Software Tools, Inc.; Pittsburg, PA). Auditory clicks (0.2 ms white-noise burst) were presented binaurally through headphones at 60 dB above hearing threshold (determined by method of limits, both ears simultaneously) against a silent acoustic background. Somatosensory stimuli consisted of electrical stimulation (0.2 ms square-wave pulse) applied to the right median nerve at the wrist, 2.5 times sensation threshold (determined by method of limits) through a bipolar stimulating electrode (Arnfred et al., 2001a; Misulis and Fakhoury, 2001).
All stimulus paradigms involved trains of stimuli, alternately presented at short and long-ISIs (i.e., long, short, long, short, etc.). Following the sensory gating literature, short-ISI was 0.5 s, and long-ISI was 9 s (e.g., see Kisley et al., 2004). In the present conceptualization, each stimulus is thus defined by the ISI that precedes it. For the auditory task, only clicks were presented, and the recording lasted approximately 30 minutes (180 each of short and long ISI stimuli). For the somatosensory task, also 30 minutes in duration, only electrical stimuli applied to the median nerve were presented. For the combined task, both types of stimuli were presented in random order, and two 30 minute recordings were conducted with an intervening 5 minute break. The electrophysiological data collected from these two combined-stimulation recordings were appended and analyzed as a single recording (total stimuli count was 180 each of short-ISI auditory, long-ISI auditory, short-ISI somatosensory, long-ISI somatosensory). For this paradigm, “cross-modal” pairings were considered to occur when a short-ISI stimulus followed a stimulus of another modality (e.g., an auditory stimulus followed a somatosensory stimulus, or vice-versa). To eliminate the potential influence of the participants′ acclimatization to the recording condition, the first 5 min of recording were excluded from analysis for all studies (Kisley et al., 2004).
2.3. Electrophysiology
Electrophysiological activity was recorded with a NuAmps multi-channel amplifier system and Scan 4.2 software (Neuroscan; Sterling, VA). Before recording began, disposable Ag/Ag-Cl electrodes (Vermed; Bellows Falls, VT) were affixed at Cz, Fz, right and left mastoids, directly superior and lateral to the left eye, and the tip of the nose. Ground was affixed to the forehead. During recording, signals were amplified 5000 times, filtered between 0.05 and 100 Hz, and sampled at 1000 Hz. All electrodes were Vertical and lateral electrooculogram (EOG) signals were used for rejection of eye-movement and blink artifacts. The lateral EOG was also inspected after each recording to make sure the participant was reading the movie closed captions (evidenced by continuing rapid deflections on this channel). The mastoid signals were recorded to allow for the possibility of re-referencing signals to these locations, but this analysis was not performed here. Site Cz is routinely used for sensory gating studies, and auditory evoked potentials recorded from this electrode typically show the greatest sensitivity to ISI (Nagamoto et al., 1991). Although C3′ is commonly employed for measurement of somatosensory potentials, Cz was used here across all conditions (including somatosensory and combined) in order to allow for comparison of response between modalities (see also Arnfred et al., 2001a). Electrode Fz was included because Haenschel et al. (2000) showed that stimulus-evoked oscillatory activity is strongly modulated by stimulus-driven salience across fronto-central sites. Although originally included in the analyses, Fz was dropped from the current presentation because there was not substantial difference between activity - including modulation of activity by ISI - at this electrode and the nearby Cz site. This also reduced statistical complexity for the repeated-measures analyses.
2.4. Analysis of stimulus-evoked activity
For all stimuli, the evoked response at electrode Cz was epoched from 300 ms before to 700 ms after stimulus onset, and subject to artifact rejection: if the signal on any channel exceeded ±75 μV during an epoch, that trial was excluded from further analysis. Only participants with at least 50 artifact-free single trials of each stimulus type were analyzed further. Average waveforms were then computed from the remaining single trials (mean number of trials remaining = 116 long-ISI and 114 short-ISI trials for auditory-only, 102 long-ISI and 105 short-ISI for somatosensory-only, and 104 long-ISI and 100 short-ISI for combined study), and subject to analysis of event-related band amplitude (details provided below). We a priori restricted gamma activity to be 30-50 Hz, and beta activity to be 12-20 Hz (i.e., the “beta 1” band): the latter band was shown to exhibit the strongest modulation by stimulus-driven salience in the intact nervous system as assessed through non-invasive means (Haenschel et al., 2000). Because the analysis described here was performed on average evoked potentials, only phase-locked oscillations contributed to the resulting waveforms. Analysis of non-phase-locked activity from single trial epochs is described in a separate sub-section below.
Event-related band amplitude, which provides a time-series estimate of the amount of stimulus-related activity within a selected frequency band, was computed with a commercially-available analysis routine (Neuroscan, Scan 4.2 software, Edit module) that employs complex demodulation and band-pass filtering. During execution of this routine, the evoked response was separately multiplied, point-by-point, with cosine and sine functions that both oscillate at the frequency which is the center of a selected band (i.e., 40 hz for the 30-50 Hz band; 16 Hz for the 12-20 Hz band) producing real and imaginary component waveforms respectively. The resulting waves were low-pass filtered at corresponding half-bandwidths (e.g., 10 Hz for a band that is 20 Hz wide). Time-varying, band-evoked amplitude was then computed as the absolute value of the resulting complex waveform that was the linear combination of the real and imaginary component waveforms (i.e., amplitude was computed as the square root of the sum of squares of the real and imaginary parts). For the purpose of comparison to existing literature it should be pointed out that time-series waveforms generated by the present analysis provide similar, though non-identical information to those obtained by convolution with a short “wavelet” of a selected frequency (Gurtubay et al., 2001; Herrmann, 2003; Makinen et al., 2004; Tallon-Baudry and Bertrand, 1999). Also, the present method collapses activity across a specified frequency band, selected a priori, whereas wavelet approaches separate activity into discrete frequency channels.
The first and last 200 ms of the resulting time-series waveforms were removed (these regions were often found to exhibit artifactual “border” effects), leaving the interval -100 to 500 ms post-stimulus. The stimulus-evoked responses were then baseline corrected for mean prestimulus activity (i.e., the 100 ms preceding stimulus-onset). Thus, the resulting waveform quantifies the stimulus-locked change in neural activity within a select frequency band compared to the ongoing, prestimulus activity in that band. An example broad-band (0.05-100 Hz) evoked potential and corresponding transformed estimates of stimulus-evoked neural activity in gamma (30-50 Hz) and beta 1 (12-20 Hz) bands is shown in Figure 1.
Fig. 1.

Example waveforms used for analysis of early, stimulus-locked activity. The broadband response, at left, is an average evoked potential (electrode Cz referenced to nose) elicited by a long-ISI auditory stimulus for one individual. This waveform was transformed through complex demodulation and band-pass filtering into two separate frequency bands, producing the time-varying estimates of stimulus-locked activity within gamma (30-50 Hz) and beta (12-20 Hz) bands shown at right. Note that these functions represent the absolute value of response amplitude, whereas a band-passed ERP waveform would exhibit both positive and negative deflections. The response was quantified for each frequency band as the latency and amplitude of the peak response between 20 and 150 ms post-stimulus.
For each stimulus-type (auditory or somatosensory), each ISI (short or long), and each frequency band (gamma or beta), responses were quantified as the latency and amplitude of peak (maximal) response that occurred between 20 and 150 ms post-stimulus (Haenschel et al., 2000).
2.5. Analysis of stimulus-induced activity
Stimulus-induced oscillatory activity (i.e., non-phase-locked oscillatory activity) was assessed similarly, but with the following important changes: event-related band amplitude was calculated by the method of complex demodulation described above, but for single trial waveforms rather than for the average waveforms. For this analysis, the trial-to-trial variance in oscillatory activity was computed (Kalcher and Pfurtscheller, 1995; Klimesch et al., 1998). This approach effectively removes the contribution of phase-locked activity that is reflected in the average ERP waveform. Like the computation of stimulus-evoked activity described above, the stimulus-induced oscillation amplitude was computed for the interval -100 ms to 500 ms post-stimulus. However, the latency range of analysis (i.e., the determination of peak activity) for the stimulus-induced activity was restricted to a range of 200-400 ms post-stimulus, as this window typically contains significant stimulus-induced oscillation in both gamma (Tallon-Baudry and Bertrand, 1999) and beta (Haenschel et al., 2000) frequency bands. Although induced activity has also been demonstrated after 600 ms (see also Kranczioch et al., 2006), we did not assess this because the neural response elicited by the short-ISI stimuli presented here (i.e., 500 ms) would overlap with this window.
2.6. Statistical analysis
Response latency and amplitude were analyzed by within-subjects repeated-measures ANOVA. The degrees of freedom for all analyses were adjusted by the method of Greenhouse and Geisser (1959). For auditory-only and somatosensory-only studies, independent variables were frequency band of neural response (gamma or beta) and ISI (short or long). In order to reduce statistical complexity for the combined study, only the short-ISI responses were included in the repeated-measures ANOVA, leaving a total of 3 factors: frequency band, stimulus modality (auditory or somatosensory) and whether a stimulus followed another stimulus of the same modality (intra-modal) or the other modality (cross-modal). All significance tests were two-tailed at the .05 level.
2.7. Post-hoc analysis of broadband ERPs
ERP components P1 and N1 were computed by further analyzing the average, unfiltered stimulus-evoked broadband waveforms described above (section 2.4). This procedure has been described in detail elsewhere (Kisley et al., 2004). Briefly, the average waveforms were bandpass filtered between 10 and 75 Hz to isolate component P1, or between 1 and 30 Hz to isolate component N1. Component P1 was defined as the largest positive peak between 45 and 75 ms post-stimulus, and peak amplitude was measured relative to a 100 ms prestimulus baseline. Component N1 was defined as the largest negative trough between 75 and 125 ms post-stimulus, again with amplitude measured relative to the prestimulus baseline. Comparison to stimulus-evoked oscillatory responses was carried out by computing Pearson′s correlation coefficients between peak amplitude responses, and between the magnitude of response reduction caused by a decrease in ISI from the long- to short-ISI stimulus (i.e., peak amplitude evoked by the long-ISI stimulus minus peak amplitude evoked by the short-ISI stimulus). These analyses were performed for the auditory-only condition because the majority of past sensory gating studies are restricted to that sensory domain.
3. Results
3.1. Auditory-only study
The pattern of oscillatory activity evoked by the auditory clicks was consistent with the expected temporal ordering of gamma and beta responses. Grand-averaged evoked waveforms demonstrating this general pattern are shown in Figure 2. A repeated-measures ANOVA on response latency with ISI (long: 9s; short: 0.5s) and frequency band (gamma: 30-50 Hz; beta: 12-20 Hz) as factors revealed a main effect of frequency band, F(1,19)=26.4, p<.001, with the gamma response peaking earlier (marginal M = 68.0 ms) than the beta response (98.5 ms). There was no effect of ISI, and no frequency-by-ISI interaction, suggesting that the latency of evoked responses did not change as a function of ISI (see also bottom-left panel of Figure 2).
Fig. 2.

Auditory-only condition: Inter-stimulus interval (ISI) between auditory clicks modulated peak response amplitude. The grand-average (N=20) evoked amplitude for both long (9 s) and short (0.5 s) ISI stimuli is shown separately for gamma (top left) and beta (top right) bands. Note especially the strong response reduction in the beta band when ISI was shortened. The beta response peaked significantly later than the gamma response (bottom left), and the sensitivity of the beta response to ISI was greater than the sensitivity of the gamma response (bottom right). Symbols represent mean values; vertical lines represent standard errors.
Manipulation of the ISI between auditory clicks was found to modulate amplitude of the evoked response, and this effect differed between the two frequency bands studied. A repeated-measures ANOVA of response amplitude with ISI and frequency band as factors revealed a main effect of ISI, F(1,19)=16.95, p<.001, where marginal mean response amplitude was 0.92 μV for long -ISI, and 0.40 μV for short -ISI. However, there was also a significant ISI-by-frequency interaction, F(1,19)=6.78, p<.05, because the reduction in mean response amplitude from long- to short-ISI was larger for the beta response (from 1.15 μV to 0.35 μV) than for the gamma response (from 0.70 μV to 0.51 μV). This effect is presented graphically in the lower-right panel of Figure 2. The grand average waveforms (top panels of Figure 2) also show this response reduction as a function of shortened ISI, particularly strong for the beta band.
3.2. Somatosensory-only study
In general, the pattern of findings was similar when only somatosensory stimuli were presented at short- and long-ISIs. Electrical stimulation of the median nerve elicited gamma and subsequent beta waveforms (Figure 3). Again, a significant effect of frequency band was found for peak response latency, F(1,19)=7.23, p<.05, where the gamma response (marginal M = 68.8 ms) preceded the beta response (93.3 ms). This effect was not dependent upon ISI (lower-left panel of Figure 3).
Fig. 3.

Somatosensory-only condition: Inter-stimulus interval (ISI) modulated peak response amplitude. In the grand-average waveforms (N=20) note the strong response reduction in the beta band when ISI was shortened (top right). The sensitivity of the beta response to ISI was greater than the sensitivity of the gamma response (bottom right). Also note the expected latency differences between the responses in the separate frequency bands, where the gamma response peaks before the beta response regardless of ISI (bottom left).
Regarding response amplitude, again a significant effect of ISI was found, F(1,19)=18.95, p<.001, and also an ISI-by-frequency interaction, F(1,19)=6.88, p<.05. As with the auditory-only study, this interaction was due to a larger decrease in response amplitude for the beta band (from 1. to 0.64 μV) when comparing long- to short-ISI responses. The grand average waveforms and the graph in the lower-right panel of Figure 3 demonstrate this interaction.
3.3. Combined auditory-somatosensory study
This paradigm involved presentation of auditory and somatosensory stimuli at both long- and short-ISIs. Based on random chance, a given stimulus either followed a preceding stimulus of the same sensory modality (intra-modal) or a stimulus of the other modality (cross-modal). Analysis of only intra-modal long- and short-ISI responses thus allows for a potential replication of the results from the auditory-only and somatosensory-only studies presented above. The novel cross-modal effects are presented below after the replication analyses.
Results of an analysis for response amplitude for only the intra-modal auditory stimuli replicated those presented above including a significant effect of ISI, F(1,39)=7.53, p<.001, and a significant ISI-by-frequency interaction, F(1,39)=10.73, p<.01. The latter occurred because the beta response amplitude was substantially more reduced from long- to short-ISI (from 1.21 to 0.52 μV) than the gamma response was (from 0.65 μV to 0.47 μV). Unlike the results presented above for the auditory-only condition, a significant main effect of frequency band was also detected, F(1,39)=11.39, p<.01, where the beta response was larger (marginal M 0.86 μV) than the gamma response (0.56 μV). This likely occurred because the combined study involved a larger sample size (N=40) than the auditory-only study (N=20), providing greater statistical power to uncover this effect. Finally, a main effect of frequency was found for peak response latency, F(1,39)=8.91, p<.01, where the gamma response (marginal M = 69.7ms) peaked earlier than the beta response (96.6 ms).
Analysis of the intra-modal somatosensory responses also replicated the somatosensory-only study presented above. Specifically, for evoked response amplitude, a main effect of ISI was found, F(1,39)=11.98, p<.001, and also an ISI-by-frequency interaction, F(1,39)=2.14, p<.05. The latter reflects a relatively large reduction in beta response amplitude from long- to short-ISI (from 1.10 μV to 0.45 μV) compared to the reduction in gamma response amplitude (from 0.71 μV to 0.52 μV). A main effect of frequency was found for peak response latency, F(1,39)=11.15, p<.01, where the gamma response (marginal M = 69.9 ms) peaked earlier than the beta response (98.09 ms).
Analysis of cross-modal effects was conducted only for the short-ISI stimuli. In other words, only those stimuli that followed a preceding stimulus by 0.5 s were subject to repeated-measures ANOVA. The factors for this analysis were thus frequency band (gamma or beta), modality of the stimulus (auditory or somatosensory), and whether the stimulus was intra-modal or cross-modal compared to the preceding stimulus. A main effect was found for the intra/cross-modal stimulation factor, F(1,39)=10.10, p<.01, because mean response amplitude was smaller when a stimulus followed one of the same modality (marginal M = 0.49 μV) than when a stimulus followed one of a different modality (0.69 μV). This implies that response reduction as a function of shortened ISI does not simply reflect ISI, but also stimulus identity. However, this finding did not apply generally to both frequency bands because there was also a intra/cross-by-frequency interaction, F(1,39)=5.75, p<.05. This effect arose because only the amplitude of the beta band response exhibited a significant difference between intra- and cross-modal responses (marginal M from 0.49 to 0.78 μV, respectively). By contrast the gamma response amplitude showed little differentiation of this parameter (from 0.52 to 0.59 μV, respectively). Figure 4 graphically illustrates these results separately for the auditory and somatosensory responses to short-ISI stimuli.
Fig. 4.
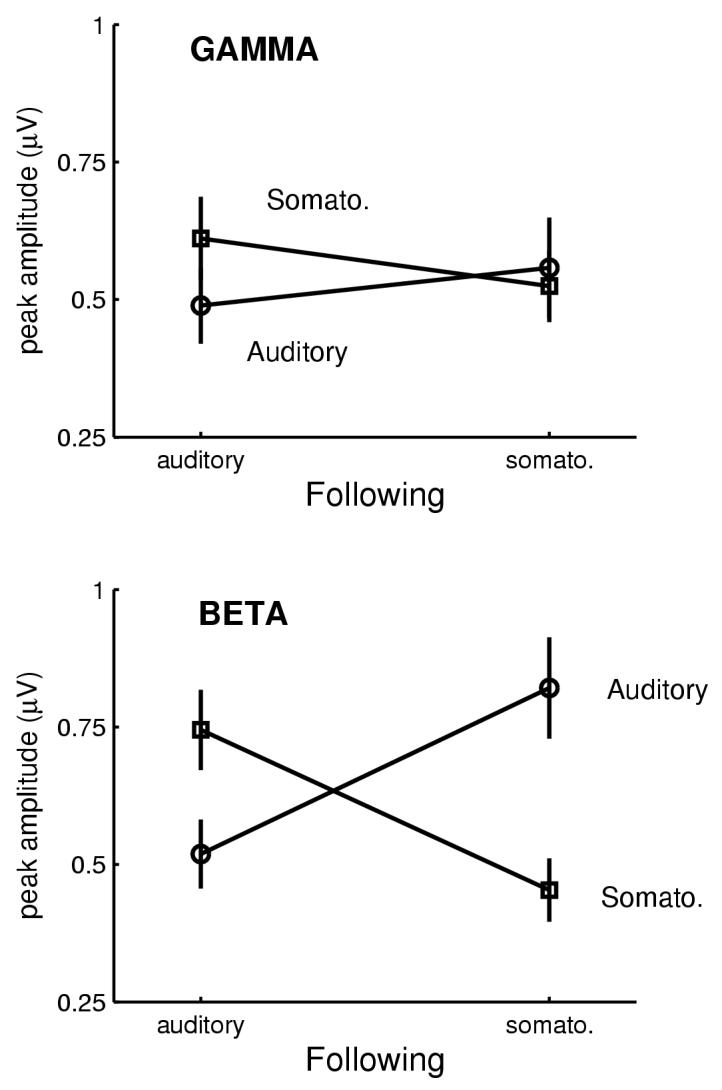
Combined auditory and somatosensory condition: Only the beta band response elicited by the short-ISI stimulus was sensitive to the modality of the preceding stimulus. Shown are the mean response amplitudes (+/-standard errors) to the short-ISI stimuli in either the auditory or somatosensory domains. These responses are sorted according to whether the preceding stimulus was auditory or somatosensory. For example, at left in the BETA plot (bottom), it can be seen that the response to an auditory stimulus following an auditory stimulus was significantly smaller than the response to a somatosensory stimulus following an auditory stimulus. Following the diagonal line from bottom left to top right in this same BETA plot, the auditory-following-somatosensory response was significantly larger than the auditory-following-auditory response. The same general pattern applies to responses to the somatosensory stimuli presented at short-ISI. A similar separation of response amplitudes was not detectable for the gamma band response (top).
Inspection of beta band response amplitudes for short-ISI, cross-modal stimulation (marginal M = 0.78 μV) and long-ISI, intra-modal stimulation (1.16 μV) suggests that these values are different. Indeed, a direct comparison of these variables revealed a significant difference for both auditory, F(1,39)=11.81, p<.01, and somatosensory stimuli, F(1,39)=7.12, p<.05. In both cases the short-ISI, cross-modal response was significantly smaller than the long-ISI, intra-modal response. This can be seen in Figure 5, which shows grand-averaged responses in the beta band to intra-modal short- and long-ISI stimuli compared to cross-modal short-ISI stimuli. This pattern of results suggests that there is in fact some reduction in amplitude caused simply by shortened ISI, independent of stimulus modality (i.e., whether the stimulus followed an intra- or cross-modal stimulus).
Fig. 5.
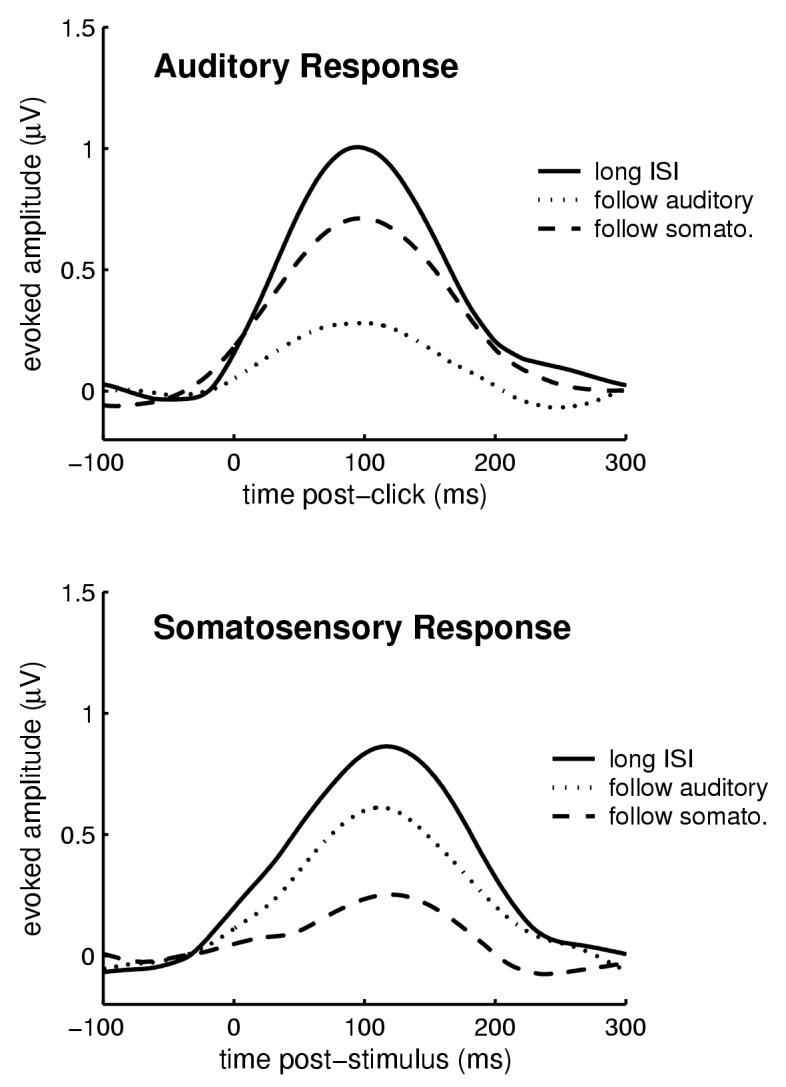
The beta response exhibited a cross-modal sensory gating effect. Grand-averaged (N=40) peak beta activity in response to a short ISI cross-modal stimulation was larger than short-ISI intra-modal stimulation, but smaller than long-ISI stimulation for both auditory (top) and somatosensory (bottom) stimuli. Thus, although the beta response dishabituated when the stimulus modality changed, it did not recover to the original long-ISI response amplitude.
3.4. Stimulus-induced activity
Stimulus-induced (i.e., non phase-locked) oscillatory activity in gamma and beta bands was also measured for all paradigms described above. No clear enhancement of stimulus-induced activity was found for either band in the planned analysis window of 200 to 400 ms. This is illustrated in Figure 6 for the auditory-only condition. However, there was a small suppression (i.e., reduction in activity compared to the amplitude of ongoing, pre-stimulus activity) of stimulus-induced beta activity between about 200 and 500 ms, for both long- and short-ISI stimuli. Post-hoc, and using a modified peak-selection criterion (most negative waveform between 200 and 500 ms), no significant effects of ISI were found for peak latency (M=362.9 ms for long-ISI, 380.3 ms for short-ISI) or peak amplitude (M = -0.32 μV for long -ISI, -0.37 μV for short -ISI) of this negative-going waveform. Like the auditory-only condition, the somatosensory-only condition was characterized by a lack of detectable stimulus-induced gamma response, but a late (> 200 ms) suppression of stimulus-induced beta response that was not modulated by ISI: mean latency = 347.4 ms (SD = 110.5 ms) for long-ISI, 342.6 ms (90.2 ms) for short-ISI; mean amplitude = -0.40 μV (0.59 μV) for long-ISI, -0.36 μV (0.38 μV) for short-ISI.
Fig. 6.

Grand average stimulus-induced (non phase-locked) activity for the auditory-only condition. Based on previous studies (Haenschel et al., 2000; Tallon-Baudry and Bertrand, 1999), the planned analysis window for this activity was between 200 and 400 ms. However, as illustrated here, stimulus-induced gamma activity in that latency range was not substantially different than random noise, and stimulus-induced beta activity showed an apparent suppression (i.e., reduction below pre-stimulus levels). The earlier (20-150 ms) stimulus-induced beta activity temporally overlapped the stimulus-evoked beta activity described above, and amplitude of this relatively small response was related to ISI. Note that the vertical-axis scale was preserved from previous waveform plots to allow comparison between the relative amplitude of stimulus-evoked and stimulus-induced oscillations.
As shown in Figure 6, there was also a small non-phase-locked beta response detectable in the latency window used above for stimulus-evoked analysis (20-150 ms), and it exhibited a response pattern very similar to stimulus-evoked beta activity. For example, the mean peak response latency was 93.0 ms (SD=50.8 ms) and 100.6 ms (SD=46.5 ms) for long- and short-ISI responses respectively, and these were not significantly different. Mean response amplitude of this peak, 0.46 μV SD=0.43) for long- and 0.23 μV (SD=0.28) for short-ISI, was significantly reduced as ISI was shortened, F(1,19)=4.56, p<.05. Again, a similar effect was found for the somatosensory-only condition, F(1,19)=5.34, p<.05). For the cross-modal study, amplitude of the early (20-150 ms) stimulus-induced beta activity exhibited a short-ISI pattern that, like stimulus-evoked activity, appeared to be modulated by the intra/cross-modal manipulation. That is, the beta response amplitude to a short-ISI intra-modal stimulus (marginal M = 0.30 -ISI cross-modal stimulus (0.44 μV). However, this effect did not reach significance.
3.5 Post hoc comparison of auditory-evoked oscillatory activity to ERP components
As expected from past studies of sensory gating, auditory ERP components P1 and N1 exhibited smaller peak amplitude for short-compared to long-ISI stimulation. Mean P1 amplitude was 2.76 μV (SD=1.61) to long-ISI, 1.41 μV (SD=0.54) to short-ISI, and the difference between these values was significant, F=19.89, df=1,19, p<.001. Mean N1 amplitude was 6.48 μV (SD=3.90) to long-ISI, 2.63 μV (SD=1.74) to short-ISI, and the difference between these values was significant, F=22.09, df=1,19, p<.001.
When compared across individuals by correlation analysis, amplitudes of the ERP components were related to peak amplitude of the stimulus-evoked gamma and beta oscillatory activity. P1 amplitude evoked by the long-ISI stimulus was significantly correlated to both peak gamma activity, r=0.51, p<.05, and peak beta activity, r=.69, p<.01. N1 amplitude to the long-ISI stimulus was only significantly correlated to peak beta activity, r=0.56, p<.01.
The modulation of evoked responses by ISI (i.e., the magnitude of response reduction caused by changing from long-ISI to short-ISI stimulation) was also correlated between ERP components and evoked oscillatory activity. The decrease in P1 amplitude caused by changing from long- to short-ISI stimulation was significantly correlated to response reduction in the beta band, r=0.65, p<.01. This correlation coefficient was significantly greater than that found between P1 modulation and gamma modulation (which was non-significant: r=0.14, p=.56), tested by Hotelling′s t-test, t=2.13, df=17, p<.05. In words, modulation of P1 amplitude by ISI was significantly more correlated to modulation of beta band than to modulation of gamma band. A similar pattern of results was found for component N1: response modulation by ISI was significantly correlated to beta band modulation, r=0.48, p<.05, but not to gamma band modulation, r=0.21, p=0.38. However, unlike component P1, the difference between these correlation coefficients was not significantly different when tested by Hotelling′s t-test.
4. Discussion
The present study was designed to test whether experimental manipulation of ISI differentially modulates stimulus-evoked oscillatory neural activity in gamma and beta frequency bands. The stimulus paradigms employed were based on the standard auditory sensory gating paradigm, but with the addition of somatosensory and cross-modal conditions. It was found that stimulus-evoked (phase-locked) gamma activity peaked significantly earlier than evoked beta activity, and the amplitude of beta activity following a stimulus was related to stimulus-driven salience: specifically, long-ISI lead to a robust beta response whereas short-ISI lead to a much smaller peak beta response. Although amplitude of evoked gamma-band activity was also related to ISI, the effect was significantly less pronounced than for beta activity (as shown by an interaction effect). This general pattern of findings was shown here to apply separately for both auditory and somatosensory modalities. The present study extends a previous non-invasive neurophysiological investigation (Haenschel et al., 2000) that modeled stimulus-driven salience through stimulus deviance, or change from background, and the results are generally consistent between these two studies.
In contrast to the robust stimulus-evoked (phase-locked) effects, relatively little stimulus-induced activity was found for the gamma and beta frequency bands. There was in fact no induced gamma activity that clearly rose above noise level (see also Debener et al., 2003) and only a decrease of induced beta activity (compared to pre-stimulus levels) in the latency window of 200 to 500 ms post-stimulus. Neither of these findings depended upon ISI. The overall lack of stimulus-induced activity may reflect the absence of top-down attention directed towards the stimuli, because selective attention has been shown to strongly modulate stimulus-induced activity in this temporal window (Muller et al., 2000; Posada et al., 2003; Tallon-Baudry et al., 2005; Tallon-Baudry and Bertrand, 1999; Vernon et al., 2005). We were unable to test this hypothesis directly, however, because all recordings here were conducted during an alternate task (watching a silent video) that did not involve the stimuli. Another possible explanation for the relative lack of stimulus-induced oscillations seen in the present study is an absence of stimulus “novelty.” This variable has been shown to increase stimulus-induced gamma activity in the 200-400 ms latency window (Gruber and Muller, 2002; but see Debener et al., 2003). For the present investigation we presented the same stimuli many times during a recording, effectively making them “non-novel.”
There was a detectable stimulus-induced beta response that temporally overlapped the stimulus-evoked beta response (20-150 ms). This non phase-locked response was relatively small, but still exhibited a significant modulation by ISI: like the evoked beta response, amplitude of the induced activity was reduced in response to the short-compared to the long-ISI stimulus. This pattern of findings is consistent with the model that the early neuron population activity associated with stimulus-driven salience includes both phase-locked and non-phase-locked oscillations in the beta frequency band.
4.1. Sensory gating across modalities
The strong beta band response reduction associated with decreased ISI did not occur when a stimulus was physically different than the immediately preceding stimulus (i.e., there was a “dishabituation” effect). A similar differentiation of intra-versus cross-modal stimulus pairing at short ISI was not detectable for the gamma band response. This supports the claim that reduced stimulus-evoked beta activity as a function of shortened ISI does not simply reflect global cortical refractoriness. On the other hand, response adaptation within a specific neuron population (i.e., those neurons that responded to the long ISI stimulus) cannot be ruled out as possibly contributing to this effect. Regardless of the mechanism that actually underlies the observed effects, passive (i.e., adaptation) and active change-detection mechanisms are both plausible and potentially effective neural processes by which to identify a stimulus as salient (reviewed by Naatanen et al., 2005).
There was nevertheless a detectable cross-modal sensory gating effect for stimulus-evoked beta activity. Specifically, beta response amplitude to an auditory stimulus was significantly modulated by a preceding somatosensory stimulus, and vice-versa. This implies that there is some amount of response modulation within the neuron population that underlies scalp-recorded beta activity when a stimulus is presented at short-ISI (0.5 s), regardless of the modality of the preceding stimulus. Given the extant literature on multisensory integration, a cross-modal sensory gating effect was not unexpected here. For example, the presence of both anatomical substrates (Schroeder et al., 2001) and functional interactions (Brett-Green et al., 2004; Foxe et al., 2002) between auditory and somatosensory modalities has been demonstrated at the cortical level. The latter includes scalp-recorded neurophysiological effects on the same time-scale (<100 ms) as that observed here (Foxe et al., 2000; Murray et al., 2005). However, such functional effects have typically been studied through simultaneous presentation of auditory and somatosensory stimuli. In the present investigation, stimuli were separated by 0.5 s in order to determine whether early neural activity related to stimulus-driven salience (in this case operationalized as ISI) interacted across modalities. The finding of a significant interaction in stimulus-evoked beta activity is consistent with previous demonstrations of cross-modal covert orienting, where an unexpected cue in one modality modulates exogenous attention switches in another modality (Spence et al., 1998).
4.2. Comparison with previous studies of sensory gating
Although oscillatory neural activity has previously been measured during the sensory gating paradigm (Clementz et al., 2002; Crawford et al., 2002; Hong et al., 2004), the specific frequency bands studied have generally not been tightly constrained by the theory of gamma-to-beta transition. Nevertheless, previous findings are consistent with the present study. For example, in healthy adults the scalp-recorded evoked gamma band response has been shown to be significantly attenuated in response to short-ISI (i.e., S2 or “test” stimulus of a stimulus-pair) compared to long-ISI stimuli (i.e., S1 or “conditioning” stimulus of a stimulus-pair), but by only about 25% (Clementz and Blumenfeld, 2001; Muller et al., 2001). This can be compared to a range of about 23-27% for the current study, depending on the modality of stimulation. By contrast, response magnitude within a “low frequency” band (1-20 Hz) has previously been shown to exhibit stronger reductions (∼60%) as ISI decreases (Clementz and Blumenfeld, 2001; Johannesen et al., 2005), consistent with a greater sensitivity to ISI than the gamma band response. Although the low frequency band examined in those studies included beta activity (12-20 Hz), it did not separate this band from lower frequency contributions (<12 Hz). For the current study, response reduction with decreased ISI was found to be approximately 60-70% for stimulus-evoked beta activity.
The present results can also be compared to past studies which employed broadband measures of ERP components. To do this it is helpful to consider the differential contribution of stimulus-evoked gamma and beta activity to an average, broad-band ERP waveform (non phase-locked, induced activity is not considered here because it does not contribute to a waveform averaged from multiple single trials: Kalcher and Pfurtscheller, 1995; Klimesch et al., 1998). Figure 7 shows the results of band-pass filtering broad-band auditory-evoked waveforms by two band-pass filters: gamma (30-50 Hz) and beta 1 (12-20 Hz). Note first that the gamma-band response contributes a large positive-going wave to ERP component Pa, which corresponds to activation of the primary auditory cortex (Kraus et al., 1982; Woods et al., 1987). This is consistent with the observation that the early stimulus-evoked gamma band activity arises from sensory cortical regions (Barth and MacDonald, 1996; Pantev et al., 1991). Note that the peak amplitude of this waveform receives relatively little contribution from beta band activity, which was shown in the present study to be particularly sensitive to ISI. This suggests that the relatively modest dependence of component Pa amplitude on ISI (Erwin and Buchwald, 1986; Goldstein et al., 1972; Kisley et al., 2001) arises from a similarly modest dependence of stimulus-evoked gamma activity on ISI, as demonstrated here.
Fig. 7.

Stimulus-locked gamma (30-50 Hz) and beta 1 (12-20 Hz) activity contribute to ERP components commonly used to study cortical processing of stimulus-driven salience. Some of these components are indicated for grand averaged waveforms computed from the 20 individuals used for the auditory-only study presented here (left): Pa (“ P30”), P1 (“ P50” , “Pb”), and N1 (“ N100”). Illustrated are the responses to the long (top) and short-ISI (bottom) stimuli. In the sensory gating literature this corresponds to S1 (“ conditioning”) and S2 (“ test”) responses, respectively. Bandpass filtering of these waveforms separately for gamma and beta bands (both filters with 48 dB/oct roll-offs on both corners; filters applied forward and reverse to avoid distortion of phase) demonstrates that component Pa primarily reflects the early gamma response, P1 receives strong contributions from both frequency bands, and of these frequency bands only the beta band contributes to N1 amplitude. The majority of amplitude reduction for component P1 from long- to short-ISI stimulation (compare top left to bottom left) can be seen to result from reduced stimulus-evoked beta activity (compare top right to bottom right). The reduction in the beta band also contributes to reduced N1 amplitude evoked by the short-ISI stimulus. Note difference in scale between the broadband and bandpassed waveforms. The bandpass filtered waveforms shown here are for the purpose of comparison with previous literature; this transformation is non-identical to the complex demodulation analysis employed for the purpose of the present study.
This model also has implications for sensory gating studies that employed measurements of component P1 amplitude. In this case the gamma and beta waveform peaks are both positive-going within the typical P1 latency window (Figure 7). Thus P1 amplitude should be related to stimulus-evoked amplitude in both frequency bands. As shown in the present study, the magnitude of gamma but especially of beta activity was reduced as a function of shortened ISI. Thus, the classical sensory gating finding of P1 amplitude reduction in response to shortened ISI (i.e., an S2/S1 or test/conditioning ratio < 1) can be interpreted to result from both a modest decrease in evoked gamma activity, but a more robust decrease in beta activity. This was supported by the post hoc correlational analyses conducted here that showed P1 response reduction was correlated especially to beta band response reduction. According to the theory discussed here, gamma and beta activity correspond to obligatory stimulus processing and the neural assignment of stimulus-driven salience, respectively. In schizophrenia patients, therefore, demonstration of relatively intact sensory gating in the gamma band, but impaired sensory gating in lower frequency bands (Clementz and Blumenfeld, 2001; Johannesen et al., 2005) suggests that this population might exhibit a deficit in the neural computation of stimulus-driven salience, as opposed to dysfunction in more elementary stimulus processing at the cortical level. However, this hypothesis has not been specifically tested for stimulus-evoked oscillations within the restricted latency window typical of the P1 waveform peak.
Component N1, a negative-going waveform with maximal deflection around 100 ms, can also be considered within this model. Figure 7 demonstrates that a negative-going wave in the scalp-recorded beta signal exhibits maximal deflection within the latency range of N1. Although this band-limited (12-20 Hz) oscillation clearly cannot account for the full deflection of the broadband N1 waveform (1-75 Hz), it does make a contribution to N1 amplitude (although Figure 7 demonstrates this empirically, it′s relatively trivial from a mathematical standpoint since the frequency range 12-20 Hz lies within the range 1-75 Hz). This implies that at least part of component N1′s well-documented modulation by ISI (Alcaini et al., 1994; Boutros and Belger, 1999; Davis et al., 1966; Kisley et al., 2004) results from the beta band′s sensitivity to this variable - as support for this, ISI-modulation for component N1 was significantly correlated to ISI-modulation for the beta band in the present study. Again, the notion that beta activity is distributed across multiple cortical regions (Roelfsema et al., 1997; von Stein et al., 1999) agrees well with the known multi-component nature of N1. For example, the auditory-evoked N1 waveform receives widespread contributions that include auditory association and prefrontal cortices (Giard et al., 1994; Loveless et al., 1996; Lu et al., 1992; Naatanen and Picton, 1987).
The present results cannot be used to support the hypothesis that estimating event-related oscillatory activity is superior to, or even substantively different from, the use of broad-band ERP components P1 and N1 when measuring sensory gating. Indeed the primary difference between these approaches lies in the selection of the bandpass filters (“ narrow” in the case of oscillatory activity, “broad” in the case of ERP components). Although the discussion immediately above apparently originates from the perspective that the band-limited oscillatory activity constitutes the primary neural response to a stimulus, and the broadband ERP components correspond to a “noisier” estimation of that activity, the opposite interpretation has been argued (e.g., Makinen et al., 2005; Yeung et al., 2004). The present study, as designed, cannot inform that particular debate. The analytical approach employed here (separating responses into gamma and beta frequency bands after Haenschel et al., 2000) was selected because it is consistent with a theoretical framework, advanced by other authors (Clementz and Blumenfeld, 2001; Karakas and Basar, 1998; Traub et al., 1999), that allow for the interpretation of results obtained as a function of the experimental manipulation of stimulus-driven salience, in this case ISI.
4.3. Neural computation of stimulus-driven salience
Considered together with previous studies (Haenschel et al., 2000; Traub et al., 1999), the present results are consistent with the theory that the gamma-to-beta transition in neuron population activity is a general marker of stimulus-driven salience, regardless of the specific paradigm employed. Still untested, however, is the hypothesis that neuron population activity in the beta band is related to stimulus “novelty,” another variable that confers stimulus-driven salience. As predicted by the theoretical model, Debener et al. (2003) found that stimulus-evoked gamma activity is apparently not significantly modulated by novelty. However, beta band activity was not assessed in that study. The effect of stimulus intensity - another salience variable - on non-invasive measures of intact nervous system beta oscillations could also be tested in future investigations.
One limitation of the present study is the relatively small number of sensors used to measure neural activity. It remains possible that manipulation of ISI causes not only a generalized increase/decrease in cortical activity within the beta band, but also a change in the pattern of activity across different cortical areas that would not be discernable from a single electrode site (but see Haenschel et al., 2000). This issue is especially relevant to the study of cross-modal gating where, for example, the observed relationship between stimulus-driven salience and evoked beta activity observed at a single scalp-recorded site could potentially arise from any number of different combinations of activity in primary sensory, sensory-association and/or multi-sensory association areas. Future studies employing multiple electrode sites, and for which topographical and source-localization analyses would be more feasible, might be helpful in disentangling such effects.
It should be noted that the potential influence of controlled selective attention on the early, stimulus-evoked beta activity remains to be thoroughly investigated. We do not believe the responses measured here were modulated by top-down attention because, like standard sensory gating and MMN studies, participants were assigned an alternative task that did not involve the analyzed stimuli. Although we did not quantify task performance per se, we did check the EOG record of all participants to make sure that they were in fact reading the closed captions of the movies (evidenced by continuing rapid deflections on the lateral EOG channel). Further, a detectable influence of top-down attention on stimulus-evoked beta activity has not been found. In fact the demonstrable effect of this manipulation on non-invasive neurophysiological measures appears to be manifest in frequency bands below beta (<10 Hz: Clementz et al., 2002) or above beta (>30 Hz: Debener et al., 2003; Tiitinen et al., 1993). Considered within the model described above, and in agreement with Yamaguchi et al. (2004), this implies that top-down attention does not necessarily modify the neural computation of stimulus-driven salience. Thishypothesis remains to be more directly tested in future investigations.
Acknowledgements
For helpful discussion and suggestions the authors gratefully acknowledge Deana Davalos, Hasker Davis, Ed DeLosh, Laura Engleman, Bob Freeman, Lori James, Kelli Klebe and Tara Noecker. Technical assistance was provided by Janice Trew and Christina Burrows. This work was supported by Wallace Research Foundation, the Coleman Institute for Cognitive Disabilities, and the U.S. National Institute of Mental Health (MH 64466).
References
- Adler LE, Hoffer LJ, Griffith J, Waldo MC, Freedman R. Normalization by nicotine of deficient auditory sensory gating in the relatives of schizophrenics. Biol Psychiatry. 1992;32:607–616. doi: 10.1016/0006-3223(92)90073-9. [DOI] [PubMed] [Google Scholar]
- Adler LE, Olincy A, Cawthra E, Hoffer M, Nagamoto HT, Amass L, et al. Reversal of diminished inhibitory sensory gating in cocaine addicts by a nicotinic cholinergic mechanism. Neuropsychopharmacology. 2001;24:671–679. doi: 10.1016/S0893-133X(00)00242-6. [DOI] [PubMed] [Google Scholar]
- Adler LE, Olincy A, Waldo M, Harris JG, Griffith J, Stevens K, et al. Schizophrenia, sensory gating, and nicotinic receptors. Schizophr Bull. 1998;24:189–202. doi: 10.1093/oxfordjournals.schbul.a033320. [DOI] [PubMed] [Google Scholar]
- Alcaini M, Giard MH, Thevenet M, Pernier J. Two separate frontal components in the N1 wave of the human auditory evoked response. Psychophysiology. 1994;31:611–615. doi: 10.1111/j.1469-8986.1994.tb02354.x. [DOI] [PubMed] [Google Scholar]
- Arnfred SM, Chen AC, Eder DN, Glenthoj BY, Hemmingsen RP. A mixed modality paradigm for recording somatosensory and auditory P50 gating. Psychiatry Res. 2001a;105:79–86. doi: 10.1016/s0165-1781(01)00316-x. [DOI] [PubMed] [Google Scholar]
- Arnfred SM, Eder DN, Hemmingsen RP, Glenthoj BY, Chen AC. Gating of the vertex somatosensory and auditory evoked potential P50 and the correlation to skin conductance orienting response in healthy men. Psychiatry Res. 2001b;101:221–235. doi: 10.1016/s0165-1781(01)00226-8. [DOI] [PubMed] [Google Scholar]
- Barth DS, MacDonald KD. Thalamic modulation of high-frequency oscillating potentials in auditory cortex. Nature. 1996;383:78–81. doi: 10.1038/383078a0. [DOI] [PubMed] [Google Scholar]
- Ben-Shakhar G, Gati I, Ben-Bassat N, Sniper G. Orienting response reinstatement and dishabituation: effects of substituting, adding, and deleting components of nonsignificant stimuli. Psychophysiology. 2000;37:102–110. [PubMed] [Google Scholar]
- Berlyne DE, Craw MA, Salapatek PH, Lewis JL. Novelty, complexity, incongruity, extrinsic motivation, and the GSR. Journal of Experimental Psychology. 1963;66:560–567. doi: 10.1037/h0045767. [DOI] [PubMed] [Google Scholar]
- Boutros NN, Belger A. Midlatency evoked potentials attenuation and augmentation reflect different aspects of sensory gating. Biol Psychiatry. 1999;45:917–922. doi: 10.1016/s0006-3223(98)00253-4. [DOI] [PubMed] [Google Scholar]
- Braff DL, Geyer MA. Sensorimotor gating and schizophrenia. Human and animal model studies. Arch Gen Psychiatry. 1990;47:181–188. doi: 10.1001/archpsyc.1990.01810140081011. [DOI] [PubMed] [Google Scholar]
- Brett-Green B, Paulsen M, Staba RJ, Fifkova E, Barth DS. Two distinct regions of secondary somatosensory cortex in the rat: topographical organization and multisensory responses. J Neurophysiol. 2004;91:1327–1336. doi: 10.1152/jn.00905.2003. [DOI] [PubMed] [Google Scholar]
- Clementz BA, Barber SK, Dzau JR. Knowledge of stimulus repetition affects the magnitude and spatial distribution of low-frequency event-related brain potentials. Audiol Neurootol. 2002;7:303–314. doi: 10.1159/000064444. [DOI] [PubMed] [Google Scholar]
- Clementz BA, Blumenfeld LD. Multichannel electroencephalographic assessment of auditory evoked response suppression in schizophrenia. Exp Brain Res. 2001;139:377–390. doi: 10.1007/s002210100744. [DOI] [PubMed] [Google Scholar]
- Crawford HJ, Clain-Furmanski D, Castagnoli N, Jr., Castagnoli K. Enhancement of auditory sensory gating and stimulus-bound gamma band (40 Hz) oscillations in heavy tobacco smokers. Neurosci Lett. 2002;317:151–155. doi: 10.1016/s0304-3940(01)02454-5. [DOI] [PubMed] [Google Scholar]
- Davis H, Mast T, Yoshie N, Zerlin S. The slow response of the human cortex to auditory stimuli: recovery process. Electroencephalogr Clin Neurophysiol. 1966;21:105–113. doi: 10.1016/0013-4694(66)90118-0. [DOI] [PubMed] [Google Scholar]
- Dawson ME, Filion DL, Schell AM. Is elicitation of the autonomic orienting response associated with allocation of processing resources? Psychophysiology. 1989;26:560–572. doi: 10.1111/j.1469-8986.1989.tb00710.x. [DOI] [PubMed] [Google Scholar]
- Debener S, Herrmann cs, Kranczioch C, Gembris D, Engel AK. Top-down attentional processing enhances auditory evoked gamma band activity. Neuroreport. 2003;14:683–686. doi: 10.1097/00001756-200304150-00005. [DOI] [PubMed] [Google Scholar]
- Edwards DC. Stimulus intensity and recency contrasts and orienting response strength. Psychophysiology. 1974;11:543–547. doi: 10.1111/j.1469-8986.1974.tb01110.x. [DOI] [PubMed] [Google Scholar]
- Erwin RJ, Buchwald JS. Midlatency auditory evoked responses: differential recovery cycle characteristics. Electroencephalogr Clin Neurophysiol. 1986;64:417–423. doi: 10.1016/0013-4694(86)90075-1. [DOI] [PubMed] [Google Scholar]
- Foxe JJ, Morocz IA, Murray MM, Higgins BA, Javitt DC, Schroeder CE. Multisensory auditory-somatosensory interactions in early cortical processing revealed by high-density electrical mapping. Brain Res Cogn Brain Res. 2000;10:77–83. doi: 10.1016/s0926-6410(00)00024-0. [DOI] [PubMed] [Google Scholar]
- Foxe JJ, Wylie GR, Martinez A, Schroeder CE, Javitt DC, Guilfoyle D, et al. Auditory-somatosensory multisensory processing in auditory association cortex: an fMRI study. J Neurophysiol. 2002;88:540–543. doi: 10.1152/jn.2002.88.1.540. [DOI] [PubMed] [Google Scholar]
- Gatchel RJ, Lang PJ. Effects of interstimulus interval length and variability on habituation of autonomic components of the orienting response. J Exp Psychol. 1974;103:802–804. doi: 10.1037/h0037208. [DOI] [PubMed] [Google Scholar]
- Giard MH, Perrin F, Echallier JF, Thevenet M, Froment JC, Pernier J. Dissociation of temporal and frontal components in the human auditory N1 wave: a scalp current density and dipole model analysis. Electroencephalogr Clin Neurophysiol. 1994;92:238–252. doi: 10.1016/0168-5597(94)90067-1. [DOI] [PubMed] [Google Scholar]
- Goldstein R, Rodman LB, Karlovich RS. Effects of stimulus rate and number on the early components of the averaged electroencephalic response. J Speech Hear Res. 1972;15:559–566. doi: 10.1044/jshr.1503.559. [DOI] [PubMed] [Google Scholar]
- Graham FK. Habituation and dishabituation of responses innervated by the autonomic nervous system. In: Peeke HVS, Herz MJ, editors. Habituation: Behavioral studies and physiological substrates. Academic Press; New York: 1973. [Google Scholar]
- Greenhouse SW, Geisser S. On methods in the analysis of profile data. Psychometrika. 1959;24:95–112. [Google Scholar]
- Gruber T, Muller MM. Effects of picture repetition on induced gamma band responses, evoked potentials, and phase synchrony in the human EEG. Brain Res Cogn Brain Res. 2002;13:377–392. doi: 10.1016/s0926-6410(01)00130-6. [DOI] [PubMed] [Google Scholar]
- Gurtubay IG, Alegre M, Labarga A, Malanda A, Iriarte J, Artieda J. Gamma band activity in an auditory oddball paradigm studied with the wavelet transform. Clin Neurophysiol. 2001;112:1219–1228. doi: 10.1016/s1388-2457(01)00557-0. [DOI] [PubMed] [Google Scholar]
- Haenschel C, Baldeweg T, Croft RJ, Whittington M, Gruzelier J. Gamma and beta frequency oscillations in response to novel auditory stimuli: A comparison of human electroencephalogram (EEG) data with in vitro models. Proc Natl Acad Sci U S A. 2000;97:7645–7650. doi: 10.1073/pnas.120162397. [DOI] [PMC free article] [PubMed] [Google Scholar]
- Herrmann CS. Gamma activity in the human EEG. In: Polich J, editor. Detection of change: Event-related potential and fMRI findings. Kluwer Academic Publishers; Boston: 2003. pp. 167–183. [Google Scholar]
- Herrmann CS, Munk MH, Engel AK. Cognitive functions of gamma-band activity: memory match and utilization. Trends Cogn Sci. 2004;8:347–355. doi: 10.1016/j.tics.2004.06.006. [DOI] [PubMed] [Google Scholar]
- Hong LE, Summerfelt A, McMahon RP, Thaker GK, Buchanan RW. Gamma/beta oscillation and sensory gating deficit in schizophrenia. Neuroreport. 2004;15:155–159. doi: 10.1097/00001756-200401190-00030. [DOI] [PubMed] [Google Scholar]
- James JP, Hughes GR. Generalization of habituation of the GSR to white noise of varying intensities. Psychonomic Science. 1969;14:163–164. [Google Scholar]
- James W. The Principles of Psychology. Holt; New York: 1890. [Google Scholar]
- Johannesen JK, Kieffaber PD, O′Donnell BF, Shekhar A, Evans JD, Hetrick WP. Contributions of subtype and spectral frequency analyses to the study of P50 ERP amplitude and suppression in schizophrenia. Schizophr Res. 2005;78:269–284. doi: 10.1016/j.schres.2005.05.022. [DOI] [PubMed] [Google Scholar]
- Johnson MR, Adler LE. Transient impairment in P50 auditory sensory gating induced by a cold-pressor test. Biol Psychiatry. 1993;33:380–387. doi: 10.1016/0006-3223(93)90328-b. [DOI] [PubMed] [Google Scholar]
- Kalcher J, Pfurtscheller G. Discrimination between phase-locked and non-phase-locked event-related EEG activity. Electroencephalogr Clin Neurophysiol. 1995;94:381–384. doi: 10.1016/0013-4694(95)00040-6. [DOI] [PubMed] [Google Scholar]
- Karakas S, Basar E. Early gamma response is sensory in origin: a conclusion based on cross-comparison of results from multiple experimental paradigms. Int J Psychophysiol. 1998;31:13–31. doi: 10.1016/s0167-8760(98)00030-0. [DOI] [PubMed] [Google Scholar]
- Kastner S, Ungerleider LG. Mechanisms of visual attention in the human cortex. Annu Rev Neurosci. 2000;23:315–341. doi: 10.1146/annurev.neuro.23.1.315. [DOI] [PubMed] [Google Scholar]
- Kisley MA, Noecker TL, Guinther PM. Comparison of sensory gating to mismatch negativity and self-reported perceptual phenomena in healthy adults. Psychophysiology. 2004;41:604–612. doi: 10.1111/j.1469-8986.2004.00191.x. [DOI] [PubMed] [Google Scholar]
- Kisley MA, Olincy A, Freedman R. The effect of state on sensory gating: comparison of waking, REM and non-REM sleep. Clin Neurophysiol. 2001;112:1154–1165. doi: 10.1016/s1388-2457(01)00578-8. [DOI] [PubMed] [Google Scholar]
- Klimesch W, Russegger H, Doppelmayr M, Pachinger T. A method for the calculation of induced band power: implications for the significance of brain oscillations. Electroencephalogr Clin Neurophysiol. 1998;108:123–130. doi: 10.1016/s0168-5597(97)00078-6. [DOI] [PubMed] [Google Scholar]
- Kranczioch C, Debener S, Herrmann CS, Engel AK. EEG gamma-band activity in rapid serial visual presentation. Exp Brain Res. 2006;169:246–254. doi: 10.1007/s00221-005-0139-2. [DOI] [PubMed] [Google Scholar]
- Kraus N, Ozdamar O, Hier D, Stein L. Auditory middle latency responses (MLRs) in patients with cortical lesions. Electroencephalogr Clin Neurophysiol. 1982;54:275–287. doi: 10.1016/0013-4694(82)90177-8. [DOI] [PubMed] [Google Scholar]
- Loveless N, Levanen S, Jousmaki V, Sams M, Hari R. Temporal integration in auditory sensory memory: neuromagnetic evidence. Electroencephalogr Clin Neurophysiol. 1996;100:220–228. doi: 10.1016/0168-5597(95)00271-5. [DOI] [PubMed] [Google Scholar]
- Lu ZL, Williamson SJ, Kaufman L. Behavioral lifetime of human auditory sensory memory predicted by physiological measures. Science. 1992;258:1668–1670. doi: 10.1126/science.1455246. [DOI] [PubMed] [Google Scholar]
- Lyytinen H, Blomberg AP, Naatanen R. Event-related potentials and autonomic responses to a change in unattended auditory stimuli. Psychophysiology. 1992;29:523–534. doi: 10.1111/j.1469-8986.1992.tb02025.x. [DOI] [PubMed] [Google Scholar]
- Makinen V, Tiitinen H, May P. Auditory event-related responses are generated independently of ongoing brain activity. Neuroimage. 2005;24:961–968. doi: 10.1016/j.neuroimage.2004.10.020. [DOI] [PubMed] [Google Scholar]
- Makinen VT, May PJ, Tiitinen H. Human auditory event-related processes in the time-frequency plane. Neuroreport. 2004;15:1767–1771. doi: 10.1097/01.wnr.0000134841.48507.5a. [DOI] [PubMed] [Google Scholar]
- Misulis KE, Fakhoury T. Spehlmann′s Evoked Potential Primer. Butterworth-Heinemann; Boston: 2001. [Google Scholar]
- Muller MM, Gruber T, Keil A. Modulation of induced gamma band activity in the human EEG by attention and visual information processing. Int J Psychophysiol. 2000;38:283–299. doi: 10.1016/s0167-8760(00)00171-9. [DOI] [PubMed] [Google Scholar]
- Muller MM, Keil A, Kissler J, Gruber T. Suppression of the auditory middle-latency response and evoked gamma-band response in a paired-click paradigm. Exp Brain Res. 2001;136:474–479. doi: 10.1007/s002210000597. [DOI] [PubMed] [Google Scholar]
- Murray MM, Molholm S, Michel CM, Heslenfeld DJ, Ritter W, Javitt DC, et al. Grabbing your ear: rapid auditory-somatosensory multisensory interactions in low-level sensory cortices are not constrained by stimulus alignment. Cereb Cortex. 2005;15:963–974. doi: 10.1093/cercor/bhh197. [DOI] [PubMed] [Google Scholar]
- Naatanen R. Attention and Brain Function. Lawrence Erlbaum Associates; Hillsdale, NJ: 1992. [Google Scholar]
- Naatanen R, Jacobsen T, Winkler I. Memory-based or afferent processes in mismatch negativity (MMN): A review of the evidence. Psychophysiology. 2005;42:25–32. doi: 10.1111/j.1469-8986.2005.00256.x. [DOI] [PubMed] [Google Scholar]
- Naatanen R, Picton T. The N1 wave of the human electric and magnetic response to sound: a review and an analysis of the component structure. Psychophysiology. 1987;24:375–425. doi: 10.1111/j.1469-8986.1987.tb00311.x. [DOI] [PubMed] [Google Scholar]
- Nagamoto HT, Adler LE, Waldo MC, Griffith J, Freedman R. Gating of auditory response in schizophrenics and normal controls. Effects of recording site and stimulation interval on the P50 wave. Schizophr Res. 1991;4:31–40. doi: 10.1016/0920-9964(91)90007-e. [DOI] [PubMed] [Google Scholar]
- Pantev C. Evoked and induced gamma-band activity of the human cortex. Brain Topogr. 1995;7:321–330. doi: 10.1007/BF01195258. [DOI] [PubMed] [Google Scholar]
- Pantev C, Makeig S, Hoke M, Galambos R, Hampson S, Gallen C. Human auditory evoked gamma-band magnetic fields. Proc Natl Acad Sci U S A. 1991;88:8996–9000. doi: 10.1073/pnas.88.20.8996. [DOI] [PMC free article] [PubMed] [Google Scholar]
- Posada A, Hugues E, Franck N, Vianin P, Kilner J. Augmentation of induced visual gamma activity by increased task complexity. Eur J Neurosci. 2003;18:2351–2356. doi: 10.1046/j.1460-9568.2003.02962.x. [DOI] [PubMed] [Google Scholar]
- Roelfsema PR, Engel AK, Konig P, Singer W. Visuomotor integration is associated with zero time-lag synchronization among cortical areas. Nature. 1997;385:157–161. doi: 10.1038/385157a0. [DOI] [PubMed] [Google Scholar]
- Schneider W, Shiffrin RM. Controlled and automatic human information processing: I. detection, search, and attention. Psychological Review. 1977;84:1. [Google Scholar]
- Schroeder CE, Lindsley RW, Specht C, Marcovici A, Smiley JF, Javitt DC. Somatosensory input to auditory association cortex in the macaque monkey. J Neurophysiol. 2001;85:1322–1327. doi: 10.1152/jn.2001.85.3.1322. [DOI] [PubMed] [Google Scholar]
- Siddle D, Stephenson D, Spinks JA. Elicitation and habituation of the orienting response. In: Siddle D, editor. Orienting and Habituation: Perspectives in Human Research. John Wiley & Sons; Chichester, England: 1983. pp. 109–182. [Google Scholar]
- Siddle DA, Jordan J. Effects of intermodality change on electrodermal orienting and on the allocation of processing resources. Psychophysiology. 1993;30:429–435. doi: 10.1111/j.1469-8986.1993.tb02066.x. [DOI] [PubMed] [Google Scholar]
- Sokolov EN. Higher nervous functions; the orienting reflex. Annu Rev Physiol. 1963;25:545–580. doi: 10.1146/annurev.ph.25.030163.002553. [DOI] [PubMed] [Google Scholar]
- Spence C, Nicholls ME, Gillespie N, Driver J. Cross-modal links in exogenous covert spatial orienting between touch, audition, and vision. Percept Psychophys. 1998;60:544–557. doi: 10.3758/bf03206045. [DOI] [PubMed] [Google Scholar]
- Tallon-Baudry C, Bertrand O. Oscillatory gamma activity in humans and its role in object representation. Trends Cogn Sci. 1999;3:151–162. doi: 10.1016/s1364-6613(99)01299-1. [DOI] [PubMed] [Google Scholar]
- Tallon-Baudry C, Bertrand O, Henaff MA, Isnard J, Fischer C. Attention modulates gamma-band oscillations differently in the human lateral occipital cortex and fusiform gyrus. Cereb Cortex. 2005;15:654–662. doi: 10.1093/cercor/bhh167. [DOI] [PubMed] [Google Scholar]
- Theeuwes J. Stimulus-driven capture and attentional set: selective search for color and visual abrupt onsets. J Exp Psychol Hum Percept Perform. 1994;20:799–806. doi: 10.1037//0096-1523.20.4.799. [DOI] [PubMed] [Google Scholar]
- Tiitinen H, Sinkkonen J, Reinikainen K, Alho K, Lavikainen J, Naatanen R. Selective attention enhances the auditory 40-Hz transient response in humans. Nature. 1993;364:59–60. doi: 10.1038/364059a0. [DOI] [PubMed] [Google Scholar]
- Traub RD, Whittington MA, Buhl EH, Jefferys JG, Faulkner HJ. On the mechanism of the gamma --> beta frequency shift in neuronal oscillations induced in rat hippocampal slices by tetanic stimulation. J Neurosci. 1999;19:1088–1105. doi: 10.1523/JNEUROSCI.19-03-01088.1999. [DOI] [PMC free article] [PubMed] [Google Scholar]
- Treisman AM, Gelade G. A feature-integration theory of attention. Cognit Psychol. 1980;12:97–136. doi: 10.1016/0010-0285(80)90005-5. [DOI] [PubMed] [Google Scholar]
- van Zoest W, Donk M. Bottom-up and top-down control in visual search. Perception. 2004;33:927–937. doi: 10.1068/p5158. [DOI] [PubMed] [Google Scholar]
- Vernon D, Haenschel C, Dwivedi P, Gruzelier J. Slow habituation of induced gamma and beta oscillations in association with unreality experiences in schizotypy. Int J Psychophysiol. 2005;56:15–24. doi: 10.1016/j.ijpsycho.2004.09.012. [DOI] [PubMed] [Google Scholar]
- von Stein A, Rappelsberger P, Sarnthein J, Petsche H. Synchronization between temporal and parietal cortex during multimodal object processing in man. Cereb Cortex. 1999;9:137–150. doi: 10.1093/cercor/9.2.137. [DOI] [PubMed] [Google Scholar]
- White PM, Yee CM. Effects of attentional and stressor manipulations on the P50 gating response. Psychophysiology. 1997;34:703–711. doi: 10.1111/j.1469-8986.1997.tb02145.x. [DOI] [PubMed] [Google Scholar]
- Whittington MA, Traub RD, Faulkner HJ, Stanford IM, Jefferys JG. Recurrent excitatory postsynaptic potentials induced by synchronized fast cortical oscillations. Proc Natl Acad Sci U S A. 1997;94:12198–12203. doi: 10.1073/pnas.94.22.12198. [DOI] [PMC free article] [PubMed] [Google Scholar]
- Woods DL, Clayworth CC, Knight RT, Simpson GV, Naeser MA. Generators of middle- and long-latency auditory evoked potentials: implications from studies of patients with bitemporal lesions. Electroencephalogr Clin Neurophysiol. 1987;68:132–148. doi: 10.1016/0168-5597(87)90040-2. [DOI] [PubMed] [Google Scholar]
- Yamaguchi S, Hale LA, D′Esposito M, Knight RT. Rapid prefrontal-hippocampal habituation to novel events. J Neurosci. 2004;24:5356–5363. doi: 10.1523/JNEUROSCI.4587-03.2004. [DOI] [PMC free article] [PubMed] [Google Scholar]
- Yeung N, Bogacz R, Holroyd CB, Cohen JD. Detection of synchronized oscillations in the electroencephalogram: an evaluation of methods. Psychophysiology. 2004;41:822–832. doi: 10.1111/j.1469-8986.2004.00239.x. [DOI] [PubMed] [Google Scholar]