

Abstract
Background and aims: Nodal metastases are indisputable determinants of prognosis for colon and rectal cancer. Using classical histological criteria, many attempts to predict nodal metastasis have failed, preventing the adequate management of stage I (pT1) cancer. We investigated the role of tumour matrilysin in predicting metastatic potential, and discuss its potential use in individualising treatment of pT1 colon and rectal cancer.
Methods: The gene signature associated with nodal metastasis was investigated by cDNA array in 24 colon and rectal cancers. We studied 494 colon and rectal cancer patients to identify risk factors for nodal metastasis and evaluated the potential to predict nodal metastasis by either the logistic regression model or the Bayesian neural network model with built-in matrilysin. We then inferred possible causality of nodal metastasis from structural equation modelling.
Results: cDNA array revealed that matrilysin was maximally upregulated in the metastasis signature identified. Tumour matrilysin expression emerged as a stage independent risk factor for nodal metastasis, resulting in a similar predictive performance in receiver operating characteristic curve analysis in the two models. A Bayesian approach called automatic relevance determination identified matrilysin as one of the most relevant predictors examined. Structural equation modelling suggested possible direct causality between matrilysin and nodal metastasis.
Conclusions: We have provided evidence that tumour matrilysin expression is a promising biomarker predicting nodal metastasis of colon and rectal cancer. Analysis of tumour matrilysin expression would help clinicians achieve the goal of individualised cancer treatment based on the metastatic potential of pT1 colon and rectal cancer.
Keywords: matrilysin, Bayesian neural network, structural equation modelling, nodal metastasis, colon and rectal cancer
Combined minimally invasive and target oriented treatment, individually tailored in accordance with metastatic potential, is an ideal but still remote goal of cancer treatment, which would improve outcome and reduce medical costs for cancer patients. In the post-genomic era, cancer treatment has become increasingly target oriented1 and the many molecular targets identified by high throughput technologies encourage this trend and provide attractive candidates for clinical use.2–4 Moreover, individualised cancer treatment based on pharmacogenomics is now a real clinical possibility, while minimally invasive surgery is the current preferred approach to many cancers.5 Despite many histological studies, we still cannot assess the metastatic potential of cancer.6 Our primary purpose in this study was to assess and predict the metastatic potential of cancer, which is difficult to evaluate directly. Fortunately, locoregional nodes are almost invariably the initial site of metastatic spread of stage I (pT1) colon and rectal cancers (CRC), so the development of nodal metastasis should exactly reflect the metastatic potential of the primary tumour of stage I (pT1) CRC. Our secondary aim was to propose individualised treatment against stage I (pT1N0M0) CRC based on the metastatic potential in the clinical setting.
Matrix metalloproteinases (MMP) are promising targets for cancer therapy based on their massive upregulation in malignant tissues and their unique ability to degrade all components of the extracellular matrix.7 We and other authors reported that matrilysin (MMP-7) is exclusively produced by cancer cells and has critical implications for tumour growth, invasion, metastasis, and prognosis of gastrointestinal cancers.8,9,10,11,12,13 Although matrilysin is one of the targets transactivated by β-catenin, a key mediator in the Wnt pathway, interacting with the family of Tcf/Lef1 transcriptional factors,13–15 and is implicated directly in early tumorigenesis,9 the precise role of matrilysin in the potential for nodal metastasis is still unclear.
Neural computing and graphical modelling has recently emerged as a practical technique, with successful applications in many unrelated fields. Artificial neural networks (ANNs) are algorithms applicable to complicated non-linear statistical modelling that provide a new alternative to logistic regression which has been the most commonly used method for developing predictive models for dichotomous outcomes in medicine.16,17 Structural equation modelling (SEM) is a statistical approach to infer causality between latent factors impossible to observe directly, and selected measurable variables in social and physical phenomenon.18 However, discriminatory use of logistic regression, ANN, or SEM to produce the best possible results in the clinical decision making process is still not fully understood.
In this study, we identified that matrilysin was maximally upregulated in the metastatic gene signature in cDNA array analysis. Using a large number of CRC patients, we determined that tumour matrilysin expression is a stage independent risk factor for nodal metastasis. We then developed and evaluated two novel predictive models based on logistic regression and Bayesian ANN with built-in matrilysin. Moreover, possible causality of matrilysin in nodal metastasis was inferred from SEM. Based on these findings, we propose that tumour matrilysin measurements would refine evaluation of the metastatic potential of CRC, and endoscopic intervention combined with matrilysin measurement would be the most rational strategy against pT1 CRC, enabling individualised cancer treatment adjusted to the risk of metastasis.
MATERIALS AND METHODS
Design and participants
We obtained fresh tissues from 24 patients with CRC. All had undergone definitive surgery according to the International Union Against Cancer (UICC) guidelines. To compare gene expression profiles in CRC with nodal metastasis (n = 16) with those without nodal metastasis (n = 8), each specimen containing more than 90% tumour cells was subjected to cDNA array analysis. All tumours were adenocarcinomas, and their clinicopathological features were classified according to the UICC’s TNM classification.
We divided 494 Japanese patients with pT1–T4 CRC into two study populations to assess the risk of nodal metastasis. We conducted a cross sectional survey in one group of 180 consecutive patients with pT1, defined as when the tumour invades the submucosa (tables 1 ▶, 2 ▶). These were subdivided into two subgroups: a surgical subgroup (n = 94) who underwent radical surgery alone, and an endoscopic mucosal resection (EMR) subgroup (n = 86) who were treated by initial endoscopic local excision followed by additional radical surgery. The other main group comprised 244 pT1–T4 patients consisting of 122 matched pairs for age (within five years) and sex, analysed according to a case (node positive), control (node negative) design (tables 3 ▶, 4 ▶). To compare the new biomarker (tumour matrilysin) with current standards, we deliberately introduced “an unfavourable score”, which was defined as an additive sum of the standard risk factors for nodal metastasis in pT1 CRC. These factors include: depth of invasion (scored scanty 0 or massive 1); differentiation grade (well 1, moderate 2, and poor 3); lymphatic invasion (negative 0 or positive 1); and vascular invasion (negative 0 or positive 1).19 Treatment of all patients was carried out between 1990 and 2001 in hospitals affiliated with our university, and all patients gave full informed consent. We excluded patients with multiple primary cancers, familial cancer syndromes, and idiopathic inflammatory bowel disease. The institutional review board of Sapporo Medical University approved the study. We retrieved clinicopathological data from the medical and pathological records (tables 1 ▶–4 ▶).
Table 1.
Association of nodal metastasis, matrilysin expression, and type of therapy with clinicopathological parameters of pT1 colon and rectal cancer (CRC)
| Variable | Category (n = 180) | Node positive (n = 20) | Node negative (n = 160) | p Value | Matrilysin expression | p Value | Surgical (n = 94) | EMR (n = 86) | p Value | |
| Positive (n = 56) | Negative (n = 124) | |||||||||
| Age* | 62.5 (9.6) | 61.8 (8.2) | 62.6 (9.8) | 0.699 | 62.3 (10.0) | 62.5 (9.5) | 0.891 | 62.7 (9.8) | 62.3 (9.4) | 0.816 |
| Sex | ||||||||||
| F | 52 (28.9) | 8 (40.0) | 44 (27.5) | 0.296 | 19 (33.9) | 33 (26.6) | 0.375 | 29 (30.9) | 23 (26.7) | 0.622 |
| M | 128 (71.1) | 12 (60.0) | 116 (72.5) | 37 (66.1) | 91 (73.4) | 65 (69.1) | 63 (73.3) | |||
| Size of tumour* | 17.5 (8.8) | 16.2 (7.9) | 17.6 (8.9) | 0.443 | 18.8 (10.2) | 16.9 (8.0) | 0.215 | 20.0 (9.5) | 14.7 (6.9) | 0.0004 |
| Depth of invasion† | ||||||||||
| Scanty | 49 (27.2) | 1 (5.0) | 48 (30.0) | 0.016 | 8 (14.3) | 41 (33.1) | 0.011 | 29 (30.9) | 20 (23.3) | 0.315 |
| Massive | 131 (72.8) | 19 (95.0) | 112 (70.0) | 48 (85.7) | 83 (66.9) | 65 (69.1) | 66 (76.7) | |||
| Location | ||||||||||
| Right sided | 55 (30.6) | 3 (15.0) | 52 (32.5) | 0.274 | 16 (28.6) | 39 (31.5) | 0.320 | 33 (35.1) | 22 (25.6) | 0.119 |
| Left sided | 68 (37.8) | 9 (45.0) | 59 (36.9) | 18 (32.1) | 50 (40.3) | 29 (30.9) | 39 (45.3) | |||
| Rectum | 57 (31.7) | 8 (40.0) | 49 (30.6) | 22 (39.3) | 35 (28.2) | 32 (34.0) | 25 (29.1) | |||
| Histology‡ | ||||||||||
| Well | 141 (78.3) | 13 (65.0) | 128 (80.0) | 0.088 | 39 (69.6) | 102 (82.3) | 0.184 | 75 (79.8) | 66 (76.7) | 0.856 |
| Moderate | 37 (20.6) | 6 (30.0) | 31 (19.4) | 16 (28.6) | 21 (16.9) | 18 (19.1) | 19 (22.1) | |||
| Poor | 2 (1.1) | 1 (5.0) | 1 (0.6) | 1 (1.8) | 1 (0.8) | 1 (1.1) | 1 (1.2) | |||
| Nuclear β-catenin¶ | ||||||||||
| Negative | 41 (29.1) | 3 (23.1) | 38 (29.7) | NS | 16 (28.6) | 25 (20.2) | NS | 26 (28.6) | 15 (30.0) | NS |
| Positive | 100 (70.9) | 10 (76.9) | 90 (70.3) | 45 (71.4) | 55 (79.8) | 65 (71.4) | 35 (70.0) | |||
| Tumour budding | ||||||||||
| Negative | 49 (34.0) | 0 (0) | 49 (37.7) | 0.0025 | 2 (3.6) | 47 (55.3) | <0.0001 | 37 (39.4) | 12 (24.0) | NS |
| Positive | 95 (66.0) | 14 (100) | 81 (62.3) | 54 (96.4) | 41 (44.7) | 57 (60.4) | 38 (76.0) | |||
| Matrilysin expression | ||||||||||
| Negative | 124 (68.9) | 4 (20.0) | 120 (75.0) | <0.001 | 54 (57.4) | 70 (81.4) | 0.0066 | |||
| Positive | 56 (31.1) | 16 (80.0) | 40 (25.0) | 40 (42.6) | 16 (18.6) | |||||
| Lymphatic invasion | ||||||||||
| Negative | 137 (76.1) | 12 (60.0) | 125 (78.1) | 0.039 | 37 (66.1) | 100 (80.6) | 0.0188 | 65 (69.1) | 72 (83.7) | 0.0239 |
| Positive | 43 (23.9) | 8 (40.0) | 35 (21.9) | 19 (33.9) | 24 (19.4) | 29 (30.9) | 14 (16.3) | |||
| Venous invasion | ||||||||||
| Negative | 136 (75.6) | 8 (40.0) | 128 (80.0) | 36 (64.3) | 100 (80.6) | 0.01 | 66 (70.2) | 70 (81.4) | 0.861 | |
| Positive | 44 (24.4) | 12 (60.0) | 32 (20.0) | 20 (35.7) | 24 (19.4) | 28 (29.8) | 16 (18.6) | |||
| Nodal metastasis | ||||||||||
| Negative | 160 (88.9) | 40 (71.4) | 120 (96.8) | <0.0001 | 81 (86.2) | 79 (91.9) | 0.245 | |||
| Positive | 20 (11.1) | 16 (29.6) | 4 (3.2) | 13 (13.8) | 7 (8.1) | |||||
*Comparison of age and tumour size (mean (SD)) in the two groups was examined using the Student’s t test.
†Submucosal invasion was divided into two levels, scanty (200–300 μm distance from muscularis mucosa) and massive.
‡This variable was analysed by the exact p value based on Pearson’s statistics.
¶β-Catenin was examined in 141 of 180 cases.
EMR, Endoscopic mucosal resection.
Table 2.
Unconditional logistic regression analysis for risk factors of nodal metastasis in pT1 colorectal cancer and in the endoscopic mucosal resection subgroup*
| Variables | Coefficient | Odds ratio (95% CI) | p Value |
| Matrilysin expression | 2.341 | 10.4 (3.18–33.98) | 0.001 |
| 1.912* | 6.7 (1.10–41.48)* | 0.039* | |
| Venous invasion | 1.027 | 2.8 (1.39–5.61) | 0.0039 |
| 1.527* | 4.6 (0.92–23.07)* | 0.063* | |
| Matrilysin expression | 2.223 | 9.2 (2.83–30.08) | 0.0002 |
| 1.813* | 6.1 (1.08–34.91)* | 0.041* | |
| Unfavourable score | 0.430 | 1.5 (1.11–2.12) | 0.0089 |
| 0.706* | 2.0 (0.70–5.87)* | 0.193* |
95% CI, 95% confidence interval.
Table 3.
Association of nodal metastases and matrilysin expression with clinicopathological parameters of pT1–T4 colon and rectal cancer
| Variable | Category (n = 244) | Node positive (n = 122) | Node negative (n = 122) | p Value | Matrilysin expression | ||
| Positive (n = 176) | Negative (n = 68) | p Value | |||||
| Age* | 65.0 (9.9) | 65.5 (9.9) | 64.5 (9.9) | 65.3 (9.8) | 64.0 (10.3) | ||
| Sex | |||||||
| F | 94 (38.5) | 47 (38.5) | 47 (38.5) | 65 (36.9) | 29 (42.6) | ||
| M | 150 (61.5) | 75 (61.5) | 75 (61.5) | 111 (63.1) | 39 (57.4) | ||
| Size of tumour* | 42.6 (24.4) | 48.2 (24.1) | 37.0 (23.4) | 0.01 | 46.2 (22.4) | 33.5 (27.0) | 0.0003 |
| Depth of invasion† | |||||||
| pT1 | 56 (23.0) | 14 (11.5) | 42 (34.4) | 0.0008 | 22 (12.5) | 34 (50.0) | 0.0006 |
| pT2 | 22 (9.0) | 10 (8.2) | 12 (9.8) | 16 (9.1) | 6 (8.8) | ||
| pT3 | 115 (47.1) | 66 (54.1) | 49 (40.2) | 96 (54.5) | 19 (28.0) | ||
| pT4 | 51 (20.9) | 32 (26.2) | 19 (15.6) | 42 (23.9) | 9 (13.2) | ||
| Location | |||||||
| Right side | 77 (31.6) | 38 (31.1) | 39 (32.0) | 0.154 | 54 (30.7) | 23 (33.8) | 0.789 |
| Left side | 80 (32.8) | 41 (33.6) | 39 (32.0) | 57 (32.4) | 23 (33.8) | ||
| Rectum | 87 (35.7) | 43 (35.3) | 44 (36.0) | 65 (36.9) | 22 (32.4) | ||
| Differentiation grade | |||||||
| Well | 113 (46.3) | 38 (31.1) | 75 (61.5) | 0.0034 | 71 (62.8) | 42 (61.8) | 0.012 |
| Moderate | 116 (47.5) | 72 (59.0) | 44 (36.1) | 93 (80.2) | 23 (33.8) | ||
| Poor | 15 (6.1) | 12 (9.8) | 3 (2.4) | 12 (80.0) | 3 (4.4) | ||
| Lymphatic invasion | |||||||
| Negative | 73 (29.9) | 9 (7.4) | 64 (52.5) | 0.0002 | 34 (46.6) | 39 (57.4) | 0.0001 |
| Positive | 171 (70.1) | 113 (92.6) | 58 (47.5) | 142 (83.0) | 29 (42.6) | ||
| Venous invasion | |||||||
| Negative | 95 (38.9) | 32 (26.2) | 63 (51.6) | 0.0004 | 51 (53.7) | 44 (64.7) | 0.0004 |
| Positive | 149 (61.1) | 90 (73.8) | 59 (48.4) | 125 (83.9) | 24 (35.3) | ||
| Matrilysin expression | |||||||
| Negative | 68 (27.9) | 11 (9.0) | 57 (46.7) | 0.0005 | |||
| Positive | 176 (72.1) | 111 (91.0) | 65 (53.3) | ||||
| Nodal metastases | |||||||
| Negative | 65 (36.9) | 57 (83.8) | 0.0005 | ||||
| Positive | 111 (63.1) | 11 (16.2) | |||||
*Comparison of age and tumour size (mean (SD)) in the two groups was examined using the student’s t test.
†Depth of invasion was designated by “T”, referred to the local extent of the primary tumour in the TNM classification.
Table 4.
Conditional logistic regression analysis for risk factors of nodal metastasis in pT1–T4 colorectal cancer
| Variable | Coefficient | Odds ratio (95% CI) | p Value |
| Lymphatic invasion | 1.746 | 5.7 (2.66–12.37) | 0.0085 |
| Matrilysin expression | 1.661 | 5.27 (1.75–15.84) | 0.0311 |
| pT | 0.815 | 2.3 (0.8–6.39) | 0.124 |
| Matrilysin expression | 1.450 | 4.3 (1.71–10.64) | 0.0019 |
| Unfavourable score | 0.633 | 1.9 (1.46–2.58) | 0.0004 |
95% CI, 95% confidence interval.
The 494 patients were then randomly divided into two groups: one was a training data set of 402 patients and the other was a test data set of 92 patients. Using the training data set, we independently developed two predictive models, a logistic model and Bayesian ANN model. We then evaluated the predictive performance of these two models using the same test data set. Furthermore, we developed a causal model of nodal metastasis with SEM using the training data set (see appendix for details).
cDNA array analysis
We performed cDNA array analysis according to the manufacturer’s protocol, using the filter (human cancer; Toyobo) consisting of 550 cancer related genes and 11 housekeeping genes in duplicate. A complete list is available on the URL http://www.toyobo.co.jp. Gene expression profiles of nodal metastasis were compared using significance analysis of microarray (SAM; http://www-stat.stanford.edu/~tibs/SAM/)20 (see appendix for details).
Immunohistochemistry and its evaluation
Archival formalin fixed paraffin embedded sections were immunostained using a standard avidin-biotin peroxidase technique, as recommended by the manufacturer (Dako, Glostrup, Denmark). The mouse monoclonal antibodies used were those against human MMP-7 (141-7B2; Daiichi Fine Chemical, Toyama, Japan), cytokeratin (56 kDa) (KL-1; Serotec, Oxford, UK), and β-catenin (Transduction Laboratories, Lexington, Kentucky, UK). The simplest criterion to evaluate immunoreactivity was adopted according to an all-or-nothing principle. Matrilysin immunostaining was judged as positive provided basilar and/or cytoplasmic staining was observed at the invasive edge (fig 1 ▶). Cytokeratin was used to enhance visualisation of the small numbers of budding cancer cells. Tumour budding was defined as microscopic clusters of undifferentiated cancer cells just ahead of the invasive front of the tumour and has also been referred to as “focal dedifferentiation”.21 In this analysis, evaluation of positive β-catenin expression was restricted to nuclear accumulation at the invasive front of the tumour. Two independent researchers (YA and TS) evaluated all immunostaining in a blind manner.
Figure 1.
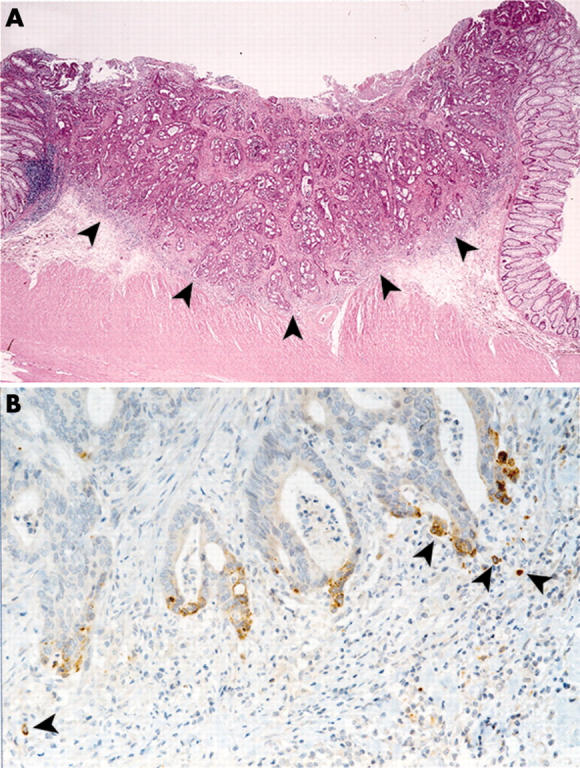
Expression of matrilysin at the invasive front of the pT1 colon and rectal cancer with nodal metastases. (A) Panoramic view (×1.5) of haematoxylin-eosin stain of a representative section. Moderately differentiated adenocarcinoma invading massively into the submucosa. Both lymphatic and venous invasions are present. In this study, the invasive front of the tumour was defined as the borderline indicated by the arrowheads on the representative section of resected specimens. (B) Immunohistochemistry of matrilysin (×20). Arrowheads show depolarised matrilysin expression on the budding cancer cells at the invasive front.
Statistical analysis
Categorical comparison of the clinicopathological characteristics was carried out using the χ2 test, Fisher’s exact test, the exact p values based on Pearson’s statistic or the Monte Carlo method. Continuous variables were tested by the Student’s t test. Logistic regression analysis for nodal metastasis was performed using a backward stepwise method (likelihood ratio) (software, SPSS for Windows, version 11; Chicago, Illinois, USA). Clinicopathological characteristics for the matched data were examined using conditional logistic regression analysis. A p value of less than 0.05 was considered statistically significant. All tests were two tailed.
Artificial neural networks (ANNs)
The most popular three layer feed forward perceptron under the learning algorithm, the error backpropagation, was adopted.22 It was composed of nine input units, 20 hidden units, and one output unit. The nine input nodes included age, sex, tumour size, location of tumour, depth of invasion, differentiation grade, lymphatic and venous invasion, and expression of matrilysin. The one output node represented nodal metastasis. We used a Bayesian implementation of learning in neural networks using Markov Chain Monte Carlo sampling developed by Neal.23 Automatic relevance determination (ARD), proposed by MacKay and Neal,24,25 is a hierarchical Bayesian approach where there are hyperparameters explicitly representing the relevance of different input features (fig 2 ▶). All of the analyses on Bayesian neural networks employed Software for Flexible Bayesian Modelling (copyright 1995–2003 by Radford M Neal, version 2003-06-29; the software and its documentations are available from the following URL http://www.cs.utoronto.ca/~radford/). Moreover, we performed receiver operating characteristic (ROC) curve analysis of two predictive models developed with ROCKIT (developed by Charles E Metz; ROC software including ROCKIT and the user manual are available at the following URL: http://home.uchicago.edu/~junji/KRL_HP/rocold.htm) (fig 3 ▶)26 (see appendix for details).
Figure 2.

Input weight magnitudes with automatic relevance determination prior to input to hidden weight. These plots show the values of the low level input hidden hyperparameters over the course of the simulation. They show the square root of the average squared magnitudes of weights on connections from the nine inputs. The horizontal axis gives the number of supertransitions.
Figure 3.

Receiver operating characteristic curve (ROC) analysis showing the ROC curves for the artificial neural network (ANN) model and logistic regression model for the training data set. The area under the curve was defined as a surrounding area by each curve and the diagonal line.
Structural equation modelling (SEM)
We tried to infer the causality of nodal metastasis from SEM using the identical training data set of ANN analysis. A path diagram as a causal model for nodal metastasis, consisting of nine measurable and two latent variables, was developed. The model was statistically evaluated by t test for all paths, and r2 values or squared multiple correlation were calculated. The SEM analysis used EQS6.1 for Windows (Multivariate Software, Inc., California, USA) (fig 4 ▶) (see appendix for details).
Figure 4.

Path diagram for nodal metastasis. Circles represent the latent variables, tumour growth and metastatic potential. Rectangles represent the measurable variables. Only significant paths and their estimated parameters are shown.
RESULTS
We identified three genes that were upregulated by at least fourfold (matrilysin, laminin β-2, and PMS1) and one that was downregulated by at least fourfold (cadherin-6) in CRC tissues with nodal metastasis (see appendix for details). These differentially expressed four genes were statistically significant in SAM analysis, and semiquantitative reverse transcription-polymerase chain reaction analysis gave results consistent with those by cDNA array analysis (data not shown).
Matrilysin and β-catenin were preferentially expressed, but in different locations at the invasive front of the tumour (fig 1A ▶). Cancer cells that still formed well to moderately differentiated tubular glandular structures expressed matrilysin polarised to the apical cell surface of the glands while many cases of focal dedifferentiated or budding cancer cells exhibited matrilysin depolarised in the cytoplasmic and/or on the basilar cell surface (fig 1B ▶).
Twenty of the 180 pT1 patients (11.1%) were node positive, as shown in table 1 ▶. The retrieved lymph nodes averaged at 14.8, which was not dependent on the status of nodal metastasis. Fifty six of 180 patients (31.1%) were matrilysin positive. Tumour budding was demonstrated in 66.0% (95/144) of the specimens, and aberrant nuclear expression of β-catenin was detected in 70.9% (100/141). Nodal metastasis and tumour matrilysin were statistically associated with identical factors: depth of tumour invasion (p = 0.016 v 0.011), presence of tumour budding (p = 0.0025 v <0.0001), positive matrilysin expression (p<0.001), lymphatic invasion (p = 0.039 v 0.0188), venous invasion (p = 0.024 v 0.01), and nodal metastasis (p<0.0001), respectively. β-Catenin did not correlate with any of the factors examined. Although positivity of tumour matrilysin and lymphatic invasion in the surgical subgroup were significantly higher than in the EMR group, other factors were not (table 1 ▶). Multiple logistic analysis showed that tumour matrilysin expression (odds ratio 10.4, 6.7 (95% confidence intervals (CI) 3.18–33.98, 1.10–41.48)) was an independent risk factor for nodal metastasis in pT1 CRC and in the EMR subgroup, respectively, and venous invasion (odds ratio 2.8 (95% CI 1.39–5.61)) was an independent risk factor for nodal metastasis in pT1 CRC (table 2 ▶, upper part). In the analysis using the unfavourable score, tumour matrilysin (odds ratio 9.2, 6.1 (95% CI 2.83–30.08, 1.08–34.91)) was an independent risk factor in pT1 CRC and in the EMR subgroup, respectively, and unfavourable score (odds ratio 1.5 (95% CI 1.11–2.12)) was an independent risk factor in pT1 CRC (table 2 ▶, lower part).
The clinicopathological characteristics of the 244 pT1–T4 CRC patients of the other study population are summarised in table 3 ▶. The retrieved lymph nodes averaged at 29.4, which was independent of the status of nodal metastasis. Matrilysin expression was positive in 176 patients (72.1%) and all parameters examined except tumour location were statistically significant for both nodal metastasis and positivity of matrilysin. Conditional logistic analysis for nodal metastasis identified that lymphatic invasion (adjusted odds ratio 5.7 (95% CI 2.66–12.37)) and tumour matrilysin expression (adjusted odds ratio 5.27 (95%CI 1.75–15.84)) were stage independent risk factors for nodal metastasis (table 4 ▶, upper). Using the unfavourable score, tumour matrilysin expression (adjusted odds ratio 4.3 (95%CI 1.71–10.64)) and the unfavourable score (adjusted odds ratio 1.9 (95%CI 1.46–2.58)) were independent risk factors (table 4 ▶, lower).
The logistic model and Bayesian ANN model were developed from the same 402 training data set and evaluated by the same 92 test data set. ROC curve analysis showed that the predictive accuracy of the test data set with our trained ANN model had a maximum sensitivity of 88.0% and a specificity of 86.6% when accepting a cut off value of 0.37. However, those values for the logistic model were maximally 88.0% and 82.1%, respectively, at a cut off value of 0.46 (fig 3 ▶). The areas under the curve were 0.904 and 0.874 for the neural network and logistic regression analysis, respectively; the difference between the two ROC curves did not reach statistical significance.
The Bayesian technique of ARD model determined the significance of the input parameters in the test data set. The input parameters were divided into two classes and ordered from the most relevant to the least relevant in each class as follows. Relevant parameters: tumour matrilysin expression, lymphatic invasion, depth of invasion, and venous invasion. Non-relevant parameters: differentiation grade, sex, tumour size, age, and location of tumour (fig 2 ▶).
We developed a multiple indicator model of SEM introducing two latent factors designated as tumour growth and metastatic potential. The explored model had good values for goodness of fit: χ2 = 8.735 (p = 0.810), χ2/df = 0.582, NFI = 0.986, NNFI = 1.020, CFI = 1.000, and RMSEA = 0.000. This suggested that matrilysin (path coefficient = 0.42) and lymphatic invasion (path coefficient = 0.35) were the causal parents of nodal metastasis. We could trace the three paths on the causal graph from a causal ancestor (tumour growth) to a descendant (nodal metastasis): tumour growth → metastatic potential → ly → nodal metastasis (0.35×0.77×0.35 = 0.09); tumour growth → metastatic potential → MMP-7 → nodal metastasis (0.35×0.56×0.42 = 0.08); tumour growth → MMP-7 → nodal metastasis (0.25×0.42 = 0.11). Overall association between them was the sum of these effects so that the effect mediated by ly is 0.09 while those mediated by MMP-7 is 0.19. The relative contribution of causal effect of matrilysin was approximately twofold (0.19/0.09) greater than that of lymphatic invasion in this causal model (fig 4 ▶).
DISCUSSION
Our goal was to assess the metastatic potential of CRC in order to develop clinically effective individualised treatment based on that potential against stage I of CRC (pT1N0M0). Using cDNA array, we first identified that of the many possible candidates, matrilysin was a major biomarker involved in nodal metastasis. We reported previously that matrilysin expression was confined to cancer cells, which not only correlated with tumour metastatic potential in a mouse model but was also implicated in the poor prognosis of gastrointestinal cancer patients. Moreover, matrilysin is an established target of the Wnt signal pathway. For these reasons, we specifically focused on matrilysin for further analysis.
MMPs have long been a potential target for cancer therapy. However, clinical trials of synthetic metalloproteinase inhibitors have been disappointing.26 One major reason for this lack of success may result from the apparent uncertainty regarding the precise spectrum of inhibitory activity required. In other words, it is necessary to elucidate the role of individual MMPs in cancer progression by stage and type of cancer. To address this and to illustrate intuitive clinical applications, we focused on matrilysin and nodal metastasis of pT1 in stage I CRC. If targets can be identified earlier in the disease, a target oriented approach is likely to be more successful. Intriguingly, there were no matrilysin positive carcinomas in situ or adenomas examined using our criterion for immunoreactivity for tumour matrilysin as if it reflected their metastatic potential. pT1 CRC is the earliest stage of disease and nodal metastasis in pT1 CRC is the initial step in tumour spread and must precisely reflect the metastatic potential of the primary tumour. Therefore, analysis of nodal metastasis in pT1 CRC should create new therapeutic avenues involving metastatic potential individualised or target orientated approaches.
To date, therapy for pT1 CRC has varied from endoscopic to definitive surgery. The overall frequency of nodal metastasis in pT1 CRC may be as low as 10% (table 1 ▶),27 raising the possibility that endoscopic local excision is a valid approach promising a cure for most pT1 patients without metastasis (pT1N0M0). Despite extensive histological studies, we still cannot predict the metastatic potential of pT1 CRC.28 This inability is the crux of the problem of how to improve treatment of pT1 CRC. In our series of 180 pT1 patients, even in the EMR subgroup (n = 86) who were treated by initial endoscopic local excision followed by additional radical surgery, approximately 90% of patients underwent unnecessarily extensive surgery. Tumour matrilysin expression emerged as a new biomarker superior to conventional risk factors for nodal metastasis when tumour matrilysin was compared with either individual risk factors (tables 2 ▶ and 4 ▶, upper part) or the unfavourable score defined as the whole sum of risk factors (tables 2 ▶ and 4 ▶, lower part) in this study. Using our ANN model, the incidence of over surgery in the EMR subgroup (in other words, false positive rate) should be reduced by approximately 12% (11/86), while it resulted in about 92% (79/86) under the current standard assessment of nodal metastasis. Based on the concept of individualised cancer treatment adjusted to the risk of metastasis, endoscopic local excision combined with an analysis of tumour matrilysin expression seems to be the most rational strategy for basing therapeutic decisions in patients with pT1 CRC. This needs confirmation in further clinical studies and a broader consensus before its widespread application.
For further causal inference and to develop a robust prediction model for nodal positivity, the other arm of the 244 pT1–T4 CRC, matched individually for age and sex, was studied according to a case control design.29 Conditional logistic regression analysis of these data also revealed that tumour matrilysin expression and lymphatic invasion were stage independent risk factors for nodal metastasis. This part of our study could not be strictly categorised as a longitudinal study because a conclusion that matrilysin expression preceded nodal metastasis was only warranted in the 86 pT1 patients in the EMR subgroup who were treated by initial endoscopic local excision followed by additional radical surgery. However, the following findings imply positive causality for matrilysin in nodal metastasis.30 The presence of matrilysin expression was consistent with the biological plausibility of “no invasion no metastasis” and the consistency of this association was sustained by the corresponding results from the two different study populations (tables 1 ▶–4 ▶) and the two different statistical models (ANN and logistic model). The strength of the association is supported by previous studies.12,13 SEM analysis also implied direct causality between tumour matrilysin and nodal metastasis (fig 4 ▶).
We hypothesised that depolarised matrilysin expression contributed directly to the mechanism of tumour budding formation, allowing cancer cells to acquire the most aggressive phenotype to overwhelm the host’s defensive machinery in the invasive frontline. Although this is only a hypothesis and the precise mechanisms underlying the process need clarifying, aberrant nuclear accumulation of oncogenic β-catenin is thought to be crucial in reprogramming cancer cells.31 However, our data suggested that aberrant nuclear β-catenin accumulation at the invasive front did not correlate significantly with any of the factors examined, including matrilysin expression. One possible explanation for this is that nuclear β-catenin alone was not sufficient to induce intrinsic matrilysin, as reported by Crawford et al and ourselves.32,33
Overfitting is a critical issue in developing a generalised ANN as it may lead to an extremely close fitting of a training data set, whereas in contrast, external test data sets always result in poor performance. There are several approaches to avoiding overfitting in limited training data,22 all of which relate to the complexity of the network employed. Here, we adopted a “Bayesian framework for neural network” advocated by Neal, so that we could develop the novel predictive ANN model for nodal metastasis, avoiding overfitting without the need for any validation set,23 whose diagnostic ability was equivalent to that of the logistic model in ROC analysis. ARD prior to input to hidden weight was used to this to extract relevancy among the inputs of ANN.23,24 As depicted in fig 2 ▶, it revealed that matrilysin expression was one of the most relevant inputs in the ANN model, reinforcing the results of logistic regression and SEM, and establishing possible causality between matrilysin expression and nodal metastasis.
While SEM will provide a novel insight into medical care in a causality based manner, an ANN model as well as a logistic model can complement this by offering a precise prediction. The results of this study should improve the clinical decision as to who should receive definitive surgery in stage I (pT1N0M0) or may help resolve the controversy as to who adjuvant chemotherapy should be given in stage II (pT3/4N0M0) CRC. Whether metastatic potential of the primary tumour, through tumour matrilysin measurement, could predict recurrence or survival for stage II CRC warrants further clinical studies.
In conclusion, we propose that analysis of tumour matrilysin expression can refine predictions of individual metastatic potential for CRC, and help clinicians move closer towards the goal of individualised treatment based on tumour metastatic potential of pT1 CRC.
Acknowledgments
This study was supported by a grant in aid from the Ministry of Education and Science, Sports and Culture (KI), in Japan. We would like to thank Dr Peter M Olley, English Instructor, for linguistic assistance, and Dr Sonoda T, Department of Public Health at Sapporo Medical University, for statistical advice.
Abbreviations
ARD, automatic relevance determination
ANN, artificial neural network
CRC, colon and rectal cancer
EMR, endoscopic mucosal resection
MMP, matrix metalloproteinase
MMP-7, matrilysin
SAM, significance analysis of microarray
SEM, structural equation modelling
APPENDIX
MATERIALS AND METHODS
cDNA array analysis
Total RNA isolated from frozen tissues using Trizol reagent (Life Technologies, Rockville, Maryland, USA) was used for mRNA extraction using a MagExptractor mRNA isolation kit (Toyobo, Tokyo, Japan) according to the manufacturer’s protocol. Biotin labelled cDNA targets were made from 0.5 μg mRNA using the Gene Navigator cDNA amplification system (Toyobo). The Gene Navigator cDNA array filter (human cancer; Toyobo) consisted of 550 cancer related genes and 11 housekeeping genes in duplicate. A complete list is available on the URL http://www.toyobo.co.jp. Hybridisation was performed overnight at 68°C in PerfectHyb (Toyobo). Filters were washed three times in 2×SSC/0.1% sodium dodecyl sulphate followed by three washes in 0.1×SSC/0.1% sodium dodecyl sulphate at 68°C for 10 minutes each. Specific signals on the filters were detected by a chemiluminescence detection kit (Imaging high; Toyobo). Quantitative assessment of the signals on the filters was performed by scanning on a Fluor-S MultiImager System (Bio-Rad, Richmond, California, USA) followed by image analysis using ImaGene software (BioDiscovery, Los Angeles, California, USA). Those of the duplicated spots within an array were averaged and normalised according to the median signal intensity for a given array.
Artificial neural networks (ANNs)
The most popular three layer feed forward perceptron under the learning algorithm, the error backpropagation, was adopted.22 It is composed of nine input units, 20 hidden units, and one output unit. The nine input nodes included age, sex, tumour size, location of tumour, depth of invasion, differentiation grade, lymphatic and venous invasion, and the expression of matrilysin. The one output node represented nodal metastasis. We used a Bayesian implementation of learning in neural networks using Markov Chain Monte Carlo sampling, developed by Neal.23 A brief description of the algorithm along with the heuristics employed follows. The priors for the network parameters (the weight and biases) were defined hierarchically, using hyperparameters that control the standard deviations for parameters in various groups. The priors were different for each group of weights, in which higher level hyperparameters were shared between all the weights in the group, thereby introducing dependencies between weights. This could be achieved using Gaussian prior distribution with mean zero and standard deviation σ, for weight given hyperparameter α. We set a vague prior p(α) to Gamma distribution given by
p(α) ~ Gamma (μ, a) ∝ αα/2−1 exp (−αa/2μ)
where μ is the mean and a is a shape parameter. These priors were specified using the following syntax in the software used.
[x] Width [: [Alpha-group] [: [Alpha-subgroup] [: [Alpha-parameter]]]]
The “Width” part of the specification was used to specify the mean of the precision, defined as τ = σ−2. We used μ = 400 (corresponding to Width = 0.05). The Alpha part gave the shape parameter, α = 0.5 used in this study. Alpha-group was used when selecting the common precision for all parameters in the group. Alpha-subgroup used for one of the subgroups, and Alpha-parameter for a single parameter. The prefix “x” caused the width of this prior to be automatically scaled. Predictions were made using the entire posterior distribution obtained by Gibbs sampler updating for the hyperparameters, and hybrid Monte Carlo sampler updating for the network parameters. A hybrid Monte Carlo update with a trajectory 2000 leapfrog steps long, a window of 10, and a stepsize adjustment factor of 0.4, and the 600 iterations of sampling phase was used in this study. The initial one third of these nets (200 iterations) was discarded as the algorithm may need time to reach regions of high posterior probability. Networks sampled during the remainder of the run (400 iterations) were saved for making predictions. Random selection data of the 402 were designated as the training data set, and the remaining 92 served as a validation test data set.
ARD proposed by MacKay and Neal23,24 is a hierarchical Bayesian approach where there are hyperparameters explicitly representing the relevance of different input features by modelling the width of a zero mean Gaussian prior on the parameters (fig 2 ▶). The syntax of ARD prior, “×0.2:0.5:0.5,” is meant to have two “alpha” values, including high level and lower level hyperparameters for each input. All of the analyses on Bayesian neural networks were performed using Software for Flexible Bayesian Modelling (copyright 1995–2003 by Radford M Neal, version 2003-06-29; the software and its documentations are available from the following URL: http://www.cs.utoronto.ca/~radford/). Moreover, we performed ROC curve analysis of two predictive models developed with ROCKIT (developed by Charles E Metz, ROC software including ROCKIT and the user manual are available at the following URL: http://home.uchicago.edu/~junji/KRL_HP/rocold.htm) (fig 3 ▶).25
Structural equation modelling (SEM)
We tried to infer the causality of nodal metastasis from SEM using the identical training data set of ANN analysis. Firstly, in an exploratory factor analysis, two factors were extracted with direct oblimin rotation, as one of oblique solution. Next, confirmatory factor analytic model was tested for these data. Finally, considering goodness of fit using several indices of fit (χ2, χ2/df, NFI, NNFI, CFI, and RMSA etc), the path diagram as a causal model for nodal metastasis, consisting of nine measurable and two latent variables, was developed. The model was statistically evaluated by t test of all paths, and r2 values or squared multiple correlations were calculated. Moreover, the model was modified by multivariate Largrange Multiplier and Wald test. Detailed handling of binary data in ordinal or categorical variables, such as sex, MMP-7, and nodal metastasis, in this study was not explained here but depends on modification of the “Lee-Poon-Bentler” approach using polychoric and polyserial correlation coefficients.34 Statistical parameter estimation used the maximally likelihood method with the “ROBUST” option implemented in the software.35 Analysis of SEM was performed by EQS6.1 for Windows (Multivariate Software Inc.) (fig 4 ▶).
Conflict of interest: None declared.
REFERENCES
- 1.Druker BJ, Sawyers CL, Kantarjian H, et al. Activity of a specific inhibitor of the BCR-ABL tyrosine kinase in the blast crisis of chronic myeloid leukemia and acute lymphoblastic leukemia with the Philadelphia chromosome. N Engl J Med 2001;344:1038–42. [DOI] [PubMed] [Google Scholar]
- 2.Moulder SL, Yakes FM, Muthuswamy SK, et al. Epidermal growth factor receptor (HER1) tyrosine kinase inhibitor (Iressa) inhibits HER2/neu (erbB2)—overexpressing breast cancer cells in vitro and in vivo. Cancer Res 2001;61:8887–95. [PubMed] [Google Scholar]
- 3.Gordon MS, Margolin K, Talpaz M, et al. Phase I safety and pharmacokinetic study of recombinant human anti-vascular endothelial growth factor in patients with advanced cancer. J Clin Oncol 2001;19:843–50. [DOI] [PubMed] [Google Scholar]
- 4.Zhou W, Goodman SN, Galizia G, et al. Counting alleles to predict recurrence of early-stage colon and rectal cancer. Lancet 2002;359:219–25. [DOI] [PubMed] [Google Scholar]
- 5.Evans WE, Relling MV. Pharmacogenomics: translating functional genomics into rational therapeutics. Science 1999;286:487–91. [DOI] [PubMed] [Google Scholar]
- 6.Liefers GJ, Cleton-Jansen AM, van de Velde CJ, et al. Micrometastases and survival in stage II colorectal cancer. N Engl J Med 1998;339:223–8. [DOI] [PubMed] [Google Scholar]
- 7.Woessner JF Jr. Matrix metalloproteinase family. In Parks WC, Mecham RP, eds. Matrix metalloproteinases. California: Academic Press, 1998:219–38.
- 8.Yoshimoto M, Itoh F, Yamamoto H, et al. Expression of MMP-7 (PUMP-1) mRNA in human colorectal cancers. Int J Cancer. 1993: 54, :614–18. [DOI] [PubMed]
- 9.Wilson CL, Heppner KJ, Labosky PA, et al. Intestinal tumorigenesis is suppressed in mice lacking the metalloproteinase matrilysin. Proc Natl Acad Sci USA 1997;94:1402–7. [DOI] [PMC free article] [PubMed] [Google Scholar]
- 10.Yamamoto H, Itoh F, Adachi Y, et al. Relation of enhanced secretion of active matrix metalloproteinases with tumor spread in human hepatocellular carcinoma. Gastroenterology 1997;112:1290–6. [DOI] [PubMed] [Google Scholar]
- 11.Adachi Y, Yamamoto H, Itoh F, et al. Contribution of matrilysin (MMP-7) to the metastatic pathway of human colon and rectal cancers. Gut 1999;45:252–8. [DOI] [PMC free article] [PubMed] [Google Scholar]
- 12.Yamamoto H, Adachi Y, Itoh F, et al. Association of matrilysin expression with recurrence and poor prognosis in human esophageal squamous cell carcinoma. Cancer Res 1999;59:3313–16. [PubMed] [Google Scholar]
- 13.Ougolkov AV, Yamashita K, Mai M, et al. Oncogenic β-catenin and MMP-7 (Matrilysin) cosegregate in late-stage clinical colon cancer. Gastroenterology 2002;122:60–71. [DOI] [PubMed] [Google Scholar]
- 14.Crawford HC, Fingleton B, Rudolph-Owen LA, et al. The metalloproteinase matrilysin is a target of β-catenin transactivation in intestinal tumors. Oncogene 1999;18:2883–91. [DOI] [PubMed] [Google Scholar]
- 15.Wong SC, Lo ES F, Lee KC, et al. Prognostic and diagnostic significant of β-catenin nuclear immunostaining in colorectal cancer. Clin Cancer Res 2004;344:1401–8. [DOI] [PubMed] [Google Scholar]
- 16.Cross S, Harrison R, Kennedy R. Introduction to neural networks. Lancet 1995;346:1075–9. [DOI] [PubMed] [Google Scholar]
- 17.Tu JV. Advantages and disadvantages of using artificial neural networks versus logistic regression for predicting medical outcomes. J Clin Epidemiol 1996;11:1225–31. [DOI] [PubMed] [Google Scholar]
- 18.Jöreskog KG, Sörbom D. Advances in factor analysis and structural equation models. Cambridge, Massachusetts: Abt Books, 1979.
- 19.Nelson H, Petrelli N, Carlin A, et al. Guidelines 2000 for colon and rectal cancer surgery. J Natl Cancer Inst 2001;93:583–96. [DOI] [PubMed] [Google Scholar]
- 20.Tusher VG, Tibshirani R, Chu G. Significance analysis of microarrays applied to the ionizing radiation response. Proc Natl Acad Sci USA 2001;98:5116–21. [DOI] [PMC free article] [PubMed] [Google Scholar]
- 21.Hase K, Shatney C, Johnson D, et al. Prognostic value of tumor “budding” in patients with colon and rectal cancer. Dis Colon Rectum 1993;36:627–35. [DOI] [PubMed] [Google Scholar]
- 22.Bishop CM. Neural networks for pattern recognition. Oxford: Oxford University Press, 1995.
- 23.Radford MN. Bayesian learning for neural networks. New York: Springer-Verlag, 1996.
- 24.MacKay DJ. Bayesian interpolation. Neural Computation 1992;4:415–47. [Google Scholar]
- 25.Metz CE, Herman BA, Roe CA. Statistical comparison of two ROC curve estimates obtained from partially-paired datasets. Med Decis Making 1998;18:110–21. [DOI] [PubMed] [Google Scholar]
- 26.Coussens LM, Fingleton B, Matrisian LM. Matrix metalloproteinase inhibitors and cancer: trial and tribulations. Science 2002;295:2387–92. [DOI] [PubMed] [Google Scholar]
- 27.Nascimbeni R, Burgart LJ, Nivatvongs S, et al. Risk of lymph node metastasis in T1 carcinoma of the colon and rectum. Dis Colon Rectum 2002;45:200–6. [DOI] [PubMed] [Google Scholar]
- 28.Masaki T, Muto T. Predictive value of histology at the invasive margin in the prognosis of early invasive colon and rectal cancer. J Gastroenterol 2000;35:195–200. [DOI] [PubMed] [Google Scholar]
- 29.Schlesselman JJ. Case-control studies: Design, conduct, analysis. New York: Oxford University Press, 1982.
- 30.Hill AB. The environment and disease: association or causation? Proc R Soc Med 1965;58:295–300. [DOI] [PMC free article] [PubMed] [Google Scholar]
- 31.Brabletz T, Jung A, Reu S, et al. Variable β-catenin expression in colon and rectal cancers indicates tumor progression driven by the tumor environment. Proc Natl Acad Sci USA 2001;98:10356–61. [DOI] [PMC free article] [PubMed] [Google Scholar]
- 32.Crawford HC, Fingleton B, Gustavson MD, et al. The PEA subfamily of Ets transcription factors synergies with β-catenin-LEF-1 to activate matrilysin transcription in intestinal tumors. Mol Cell Biol 2001;21:1370–83. [DOI] [PMC free article] [PubMed] [Google Scholar]
- 33.Horiuchi S, Yamamoto H, Min Y, et al. Association of ets-related transcriptional factor E1AF expression with tumor progression and overexpression of MMP-1 and matrilysin in human colorectal cancer. J Pathol 2003;200:568–76. [DOI] [PubMed] [Google Scholar]
- 34.Lee SY, Poon WY, Bentler PM. A two-stage estimation of structural equation models with continuous and polytomous variables. Br J Math Stat Psychol 1995;48:339–58. [DOI] [PubMed] [Google Scholar]
- 35.Bentler PM, Wu EJC. EQS for windows user’s guide. California: Multivariate Software Inc, 1995.