

Abstract
Lengthening of active muscle is an essential feature of animal locomotion, but the molecular processes occurring are incompletely understood. We therefore examined and modelled tension responses to ramp stretches (5% fibre length, L0) over a wide range of velocities (0.1–10 L0 s−1) of tetanized intact rat muscle fibre bundles (L0∼2 mm) with a resting sarcomere length of 2.5 μm at 20°C. Tension rose to a peak during stretch and decayed afterwards to a level which was higher than the prestretch tetanic tension. This residual force enhancement was insensitive to velocity. The tension rise during stretch showed an early transition (often appearing as an inflection) at ∼1 ms. Both the stretch (L1) and the tension rise at this transition increased in proportion to velocity. A second transition, marked by a reduction in slope, occurred at a stretch of ∼18 nm per half-sarcomere; the rise in tension at this transition increased with velocity towards a plateau. Based on analyses of the velocity dependence of the tension and modelling, we propose that the initial steep increase in tension arises from increasing strain of all attached crossbridges and that the first transition reflects the tension loss due to the original post-stroke heads executing a reverse power stroke. Modelling indicates that the reduction in slope at the second transition occurs when the last of the heads that were attached at the start of the ramp become detached. Thereafter, the crossbridge cycle is largely truncated, with prepower stroke crossbridges rapidly detaching at high strain and attaching at low strain, the tension being borne mainly by the prestroke heads. Analysis of the tension decay after the ramp and the velocity dependence of the peak tension suggest that a non-crossbridge component increasingly develops tension throughout the stretch; this decays only slowly, reaching at 500 ms after the ramp ∼20% of its peak value. This is supported by the finding that, in the presence of 10 μmN-benzyl-p-toluene sulphonamide (a myosin inhibitor), while isometric tension is reduced to ∼15%, and the crossbridge contribution to stretch-induced tension rise is reduced to 30–40%, the peak non-crossbridge contribution and the residual force enhancement remain high. We propose that the residual force enhancement is due to changes upon activation in parallel elastic elements, specifically that titin stiffens and C-protein–actin interactions may be recruited.
When an actively contracting muscle is lengthened, the force it exerts is enhanced, although the rates of energy liberation and ATP hydrolysis are lower than during shortening or isometric conditions (Fenn, 1924; Hill, 1938; Infante et al. 1964; Curtin & Davies, 1973). This force enhancement during lengthening has been studied in whole muscle (Katz, 1939; Rack & Westbury, 1974; Flitney & Hirst, 1978), small fibre bundles (Sugi, 1972) and single fibres (Edman et al. 1978, 1982; Julian & Morgan, 1979). The force increment has two components, a velocity-dependent increase of force during the ramp stretch and a velocity-independent increase that persists long after the ramp (Edman et al. 1978; Edman & Tsuchiya, 1996); the underlying mechanisms and their relative contribution to the total tension response to stretch, however, are not clear.
At low stretch velocities the force increment during a ramp stretch occurs in two phases, an initial steep rise followed usually by a slower rise. The transition between the two phases occurs at a stretch of 8–20 nm per half-sarcomere (hs) (Edman et al. 1978, 1981; Flitney & Hirst, 1978; Getz et al. 1998; Lombardi & Piazzesi, 1990; Månsson, 1994; Piazzesi et al. 1992; Stienen et al. 1992). The stretch amplitude required to reach this transition is independent of the velocity of stretch and of sarcomere length (Edman et al. 1981). The force attained at the transition increases with ramp stretch velocity and reaches a plateau at low velocities of ∼0.1–1 L0 s−1 (where L0 is muscle fibre length) (Flitney & Hirst, 1978; Getz et al. 1998; Piazzesi et al. 2003). The generally accepted mechanism underlying this velocity-dependent increase in tension is that steady lengthening of an active muscle leads to a new steady-state mechanical cycle, characterized by fast detachment of crossbridges when positively strained beyond a critical limit and their rapid reattachment at low strain (Flitney & Hirst, 1978; Lombardi & Piazzesi, 1990). However, there are differences between the models that have been proposed (Getz et al. 1998 and references therein; Månsson, 1994; Piazzesi et al. 1992) and a model consistent with all the findings has yet to emerge.
Flitney & Hirst (1978) observed the presence of an earlier change in slope (termed S1) on the tension rise at a stretch of only ∼0.2%L0 (∼2 nm hs−1) and compared it to the short-range elasticity reported in other studies (e.g. Rack & Westbury, 1974). However, since only low velocities (< 2 L0 s−1) have been used in most other studies, the occurrence of this early tension transition has received little attention.
The velocity-independent increase of force that persists after a ramp stretch (termed ‘residual force enhancement’) is more prominent at longer sarcomere lengths (Edman et al. 1978; Sugi & Tsuchiya, 1988) and increases in magnitude with the amplitude of stretch (Edman et al. 1978, 1982). It has been suggested that it is caused by the development of sarcomere length non-uniformity in the fibres (Abbott & Aubert, 1952; Julian & Morgan, 1979). Herzog & Leonard (2002) and Rassier et al. (2003b), however, have questioned whether such a mechanism alone could account for residual force enhancement observed at optimal and shorter-than-optimal sarcomere lengths.
Clearly our understanding of the molecular processes underlying the stretch-induced tension increase in active muscle remains incomplete. Firstly, there has been no systematic investigation of these components over a wide range of velocities. Secondly, the early change in slope on the tension rise seen at higher velocities, its mechanism and its relation to the later change in slope remain unclear. Thirdly, the non-crossbridge contribution to the tension rise during stretch and to the residual force enhancement and its structural basis deserve further examination. Finally, most of the above studies have been on intact frog muscle/fibres. Although there have been a few studies on skinned fibres (Stienen et al. 1992; Getz et al. 1998; Campbell & Moss, 2000) and on whole muscle (e.g. in situ cat muscle, Joyce & Rack, 1969; Joyce et al. 1969; Morgan et al. 2000; Herzog & Leonard, 2002), comparative data from intact mammalian muscle fibres are not available despite the advantage in using intact mammalian muscle of the availability of biochemical kinetic data. The aim of the present study was to investigate the molecular processes underlying the stretch-induced force increase in an attempt to address these issues. Preliminary results of this study have been reported previously in abstract form (Pinniger et al. 2003; Pinniger & Ranatunga, 2004).
Methods
Experiments were performed on small bundles of intact muscle fibres isolated from the flexor hallucis brevis (FHB) muscle of adult male rats (261 ± 6.9 g body mass; n = 14) that were humanely killed with an intraperitoneal injection of an overdose (> 200 mg (kg body mass)−1) of sodium pentobarbitone (Euthatal, Rhône Mérieux). FHB contains a predominance of fast (∼90% type 2) fibres (Coupland & Ranatunga, 2003). Bundles of 5–10 intact excitable fibres were dissected from the mid-belly of the muscle under dark-field illumination and aluminium foil T-clips were attached to the tendons at either end of the preparation within 0.2 mm of the fibre ends. The preparation was mounted horizontally between a force transducer (AE 801 element; AME, Horten, Norway) and a servomotor in a flow-through stainless steel chamber (volume ∼2 ml). The force transducer had a natural resonant frequency > 5 kHz (Mutungi & Ranatunga, 1996) and the servomotor was capable of completing a 5%L0 length step in < 1 ms. The chamber was perfused (0.5 ml min−1) with a physiological saline solution containing (mm): NaCl, 109; KCl, 5; MgCl2, 1; CaCl2, 4; NaHCO3, 24; NaH2PO4, 1; sodium pyruvate, 10; and 200 mg l −1of bovine fetal serum; the solution was continuously bubbled with 95% O2 and 5% CO2. Unless otherwise stated, experiments were conducted at 20°C; temperature control (± 1°C) of the solution was achieved by a Peltier device fitted underneath the chamber and the temperature was monitored with a thermocouple inside the chamber.
Experimental protocol
The preparation was set to an initial sarcomere length of 2.5 μm using He–Ne laser diffraction. The length–tension relationship was examined in four experiments (data not shown) which showed that the optimal sarcomere length for maximum tetanic tension was between 2.40 and 2.65 μm. This is slightly higher, but comparable to, the values of 2.14–2.50 μm observed by Elmubarak & Ranatunga (1984) and 2.26–2.43 μm by ter Keurs et al. (1984) in rat muscle fibres.
The mean (±s.e.m.) fibre length (L0) and width of the fibre bundles was 2.30 ± 0.04 mm and 0.18 ± 0.02 mm, respectively (n = 14). Following an equilibration period of at least 30 min, control isometric tetanic contractions were recorded at L0 and at a 5% extended muscle length (i.e. the length reached at the end of a ramp stretch of 5%L0). Using platinum plate electrodes the fibre bundles were stimulated at 70 Hz to give a steady tetanic tension and ramp stretches of 5%L0 were applied on the tension plateau (see Fig. 1) at velocities ranging from 0.1 to 10 L0 s−1. Tetanic stimulation was maintained at the new stretched length for at least 500 ms after the end of the ramp and the muscle remained at the stretched length for the remainder of the tetanus duration. In some preparations a marker (∼80 μm wide by 0.2 mm long) was placed on the surface of the muscle fibre bundle to monitor the change in muscle segment length (see Mutungi & Ranatunga, 2001). The fibre segment containing the marker was illuminated and the image of the marker was focused through a high-power microscope to obtain a sharp image. Movement of the marker was monitored using a one-dimensional position-sensitive detector (S3932, Hamamatsu Photonics, Welwyn, Garden City, Hertfordshire, UK).
Figure 1. Time course of tension rise in response to a ramp stretch.

Sample recordings from one preparation illustrating the tension response (upper trace) to a ramp stretch (lower trace) at 10 L0 s−1 applied on the plateau of a tetanic contraction. Also shown are the tension recordings during isometric tetanic contractions at L0 and the extended length (L0+ 5%) as well as the tension response to a ramp stretch applied at rest.
Stretches were applied to the resting fibre bundles immediately before the active lengthening contractions and the tension trace was subtracted from the active tension recordings before further analysis. Each experiment was completed by recording an isometric tetanic contraction at L0. As a ratio of the tetanic tension recorded at the start of the experiment, the mean (±s.e.m.) tetanic tension recorded at the end was 0.93 ± 0.03 (n = 14).
Data recording and analysis
The length signal from the motor and the tension transducer signal were collected via a CED 1401 laboratory interface using Signal 2 software (Cambridge Electronic Design Ltd, Cambridge, UK) and stored on a PC. Tension and time course measurements were performed offline using Signal 2 software and additional analysis and nonlinear curve fitting were performed using Fig.P software (Biosoft, Great Shelford, Cambridgeshire, UK).
Results
The four tension traces shown in Fig. 1 illustrate the general features of the tension response to stretch. At a resting sarcomere length of 2.5 μm, the tension in resting muscle and its increase by a 5%L0 ramp stretch were minimal. The increase in resting tension at a velocity of 1–2 L0 s−1 was 3.36 ± 0.60 kN m−2, only ∼4% of the tension increase obtained by the same stretch on a tetanized fibre bundle. Figure 1 also shows that the isometric tetanic contractions elicited at the initial length (L0) and at a length 5% larger (labelled L0+ 5%) developed very similar plateau tensions; the tetanic tension at the extended length was 1.01 ± 0.01 times that at L0 (n = 8) and the difference was not significant (P > 0.05; Student's t test). On application of a stretch on the plateau of a tetanic contraction at the initial length, the tension rose throughout the ramp to a peak and decayed afterwards to an apparent steady level at the maintained stretched length. As can be seen from Fig. 1, the tension at the stretched length remained higher than the plateau tension of the tetanic contractions recorded at both the initial length and the longer length; as an index of this force enhancement the tension increment above the prestretch tetanic tension was measured at 500 ms after the end of the ramp (and is referred to as P3).
Examination of the rising phase of the tension response to a ramp stretch showed the occurrence of two transitions (changes in the slope of tension rise) referred to as P1 and P2. The characteristics of these transitions are described below.
Characteristics of the P2 transition
Figure 2A shows sample records of the tension rise in response to ramp stretches at three low velocities (0.10, 0.25 and 0.50 L0 s−1). As found in previous studies, the tension rise during lengthening is biphasic with the tension rising faster initially before a transition is reached after which tension rose more slowly. In some cases, particularly at faster stretch velocities, the change in slope was abrupt and the rise in tension (P2) and the corresponding length (L2) at the transition were determined directly from the data records. During slower stretches, however, the transition between the initial fast and later slow rise in tension was more gradual and P2 was determined from the point of intersection of two linear regressions fitted on either side of the transition (see Fig. 2A). Figure 2B is a plot of the mean (±s.e.m.) P2 against the full range of velocities examined in seven fibre bundles. P2 increased steeply with velocity and reached an approximate plateau of ∼0.7 P0 at velocities above ∼2 L0 s−1.
Figure 2. Tension response to slow stretches.

A, three tension responses (upper traces) to 5% ramp stretches (lower traces) at slow velocities of 0.1 (left), 0.25 (middle) and 0.5 L0 s−1 (right). The tension rise shows a change in slope (labelled P2). The P2 tension was measured as shown. B, dependence on stretch velocity of P2 tension (normalized to P0, curve fitted by eye). Pooled data are shown from seven bundles. C, dependence on stretch velocity of the stretch amplitude at P2 (L2) from the same bundles.
The stretch (L2) at the mid-point of the transition is plotted against velocity in Fig. 2C. This stretch remained similar at different velocities; the mean L2 value from seven fibre bundles was 1.50 ± 0.04%L0, corresponding to 30% of the ramp amplitude, or an increase of ∼18 nm hs−1. This value is in the upper range of that obtained in experiments with sarcomere length control (12–20 nm hs−1; see Introduction). Our value (∼18 nm hs−1) is likely to be an over-estimate because of the effect of end-compliance; however, it is below the range previously reported from intact mammalian (cat soleus) muscle (20–35 nm hs−1, Rack & Westbury, 1974) in which tendon compliance may have been larger.
In 95% of cases, the tension continued to increase at a slower rate after the P2 transition and hence the peak tension coincided with the end of the ramp. The increase in tension after the P2 transition (Pk−P2) was 0.20 ± 0.01 P0 (n = 5). In the remaining 5% of cases, the tension either remained at a steady level or decreased after P2. The cause of such differences in these few cases is not known although similar observations have been made on frog muscle/fibres (Flitney & Hirst, 1978; Lombardi & Piazzesi, 1990) and skinned psoas fibres (Getz et al. 1998).
Characteristics of the P1 transition
Figure 3A shows three tension responses to fast stretches (1, 2 and 4 L0 s−1) displayed at different time scales to highlight the features of the rising phase. These records illustrate that the P2 transition is preceded by an earlier transition (labelled P1). Since the rise in tension (P1) at this transition increased as the velocity was increased, it was easier to identify it at higher velocities which may have contributed to the limited observation and description of this transition in previous studies.
Figure 3. Tension response to fast stretches.

A, three tension responses (upper traces) to 5%L0 ramp stretches (lower traces) at velocities of 1 (left), 2 (middle) and 4 L0 s−1 (right). The tension rise shows a change in slope, labelled P1, that preceded the P2 transition. B, effect of velocity on the stretch amplitude (L1) at which the P1 transition occurred. Pooled data are shown for seven bundles. C, the time after the start of the stretch at which the P1 transition occurred; pooled data from seven bundles.
Figure 3B and C illustrates mean (±s.e.m.) data from seven fibre bundles in which the stretch (L1) and the time after the start of stretch at which the P1 transition occurred were determined for a range of stretch velocities. The P1 and P2 transitions have distinctively different characteristics. Firstly, the P1 transition occurred at a very short time interval after the start of the stretch (mean = 0.93 ± 0.04 ms; range = 0.53–1.82 ms; n = 7). Although the fitted line in Fig. 3C is not significant, in two of the seven fibres there was a significant negative correlation between the time to the P1 transition and the velocity (Pearson's linear correlation coefficient r =−0.72, P < 0.05 and r =−0.86, P < 0.01). Secondly, L1 was proportional to velocity and reached 0.5–1.0%L0 at velocities of 8–10 L0 s−1. The P1 transition resembles the ‘break’ at 0.14–0.20%L0, termed S1 by Flitney & Hirst (1978) in frog muscle experiments.
Close inspection of the P1 transition revealed that the change of slope in the tension record did not occur instantaneously but usually consisted of a decrease in slope followed by an increase, producing an inflection. To quantify the inflection, linear regressions were fitted to the data on either side of the P1 transition (Fig. 4B). The points at which the tension record deviated from the two linear regressions were taken as the beginning and the end of the transition and were used to estimate its duration; this was 0.57 ± 0.06 ms (n = 22 from 6 fibres).
Figure 4. Characteristics of the P1 transition.

A, a selected tension trace recorded during a ramp stretch at 10 L0 s−1 (a higher velocity than in Fig. 3) showing the occurrence of two transitions on the rising phase. The incremental tension and length change at P1 were measured directly from the data record as shown by the first vertical line. B, the same tension trace as shown in A at an expanded time scale. At this resolution the P1 transition is seen as an inflection, the initial slope decreasing before increasing again. Continuous lines represent linear regressions used to estimate the start and end of the transition period (T). The tension offset due to reversal of the power stroke was estimated as twice the amplitude of the vertical displacement between the extrapolated initial regression line and the mid-point or point of inflection of the transition period (vertical arrow); the vertical displacement in this case is 15.6 kN m−2. The initial rate of tension rise in this record was 6 × 10³ kN L0−1 and decreased to 4 × 10³ kN L0−1 after the P1 transition; the duration of the transition period was 0.61 ms. Note, this trace was selected because it shows clearly the inflection point at P1; the amplitude of the vertical displacement at P1 is larger than the group mean.
From seven fibre bundles, the mean (n = 38) initial slope of the tension trace before the P1 transition was 69.6 ± 10.3 P0/L0 whereas it decreased to 40.1 ± 5.3 P0/L0 after the transition. To enable comparison with previous studies, these slopes, expressed as the tension per nanometre of half-sarcomere lengthening (nm/hs) averaged over all (both attached and detached) myosin heads were 0.070 ± 0.010 and 0.040 ± 0.005 pN per head per nm/hs before and after the P1 transition, respectively. (The density of myosin filaments was taken as 0.51 × 10¹⁵ m−2 cross-sectional area (Linari et al. 2003) of the fibre bundle and the number of myosin heads per half thick filament was 294; average P0 was 150 kN m−2.) To investigate the process producing the initial tension rise, we compared the initial slope with that obtained from the T1 tension responses to rapid releases as described by Huxley & Simmons (1971). In separate experiments on FHB fibres at 20°C, the slope of the T1 tension versus length step amplitude was 63.2 ± 3.07 P0/L0 (n = 5) which is similar to the initial stiffness from the ramp stretches. Although the exact stiffness values above may be underestimates because of the end-compliance effects, we conclude that during the initial tension rise in a ramp stretch, no additional events occur other than the stretch of compliant elements within the sarcomere.
We took the P1 inflection to be caused by a process producing a tension decrease superposed over the underlying tension increase due to the stretch of the compliant elements. The inflection point was taken to be the midpoint of this process. To obtain a value for the tension decrease associated with this process, we measured the vertical displacement between the extrapolated initial linear regression line and the point of inflection or, in the few cases in which the inflection point was not clearly defined, the mid-point of the transition period (vertical arrow in Fig. 4B). From analyses of 26 tension traces from seven fibre bundles, the mean vertical tension offset at the mid-point for velocities > 2 L0 s−1 was 5.97 ± 0.91 kN m−2: hence the total tension decrease associated with this process was ∼12 kN m−2. There was some indication that the values were greater at higher velocities.
Analysis of the development of residual force enhancement
Figure 5A shows superimposed tension, segment length and motor length records from one preparation at a range of velocities. The segment length recordings mirror the length changes imposed by the motor indicating uniform length changes throughout the fibre. The velocity dependence of Pk, P3 and P1 is shown in Fig. 5B. P1 was proportional to stretch velocity; from the pooled data, P1 was 3.88 ± 0.97 kN m−2 s/L0.Pk increased with velocity towards a plateau.
Figure 5. Velocity dependence of the tension responses.

A, the tension responses (upper traces) to ramp stretches (lower traces) at a range of velocities (0.1–4.0 L0 s−1) from one bundle are shown; middle traces show displacement of a marker placed on the surface of the fibre bundle (segment length responses). The rate of tension development and the rate of tension decay increased with stretch velocity; the tension decayed to a similar level (P3 above the isometric tension, the lowest tension record) when measured 500 ms after the end of the ramp. Note, the tension trace at the slowest stretch velocity has been truncated before reaching this point. B, velocity dependence of Pk (▴), P3 (▾) and P1 (○) from one fibre bundle. The Pk tension increased with velocity towards a plateau, P3 was relatively insensitive to velocity and P1 increased in proportion to velocity with a slope of 6.97 kN m−2 per L0 s−1. The dashed line represents the curve fit to Pk using eqn (1) in the text. A better fit (continuous line) was obtained using eqn (2), where Vc= 1.46 L0 s−1, PL= 100 kN m−2, and P3*= 73.45 kN m−2. In this example, P3* is approximately fivefold greater than the measured P3 tension. C, velocity dependence of Pk−P3 (▪) and Pk−P3* (□). For Pk−P3 data, the dashed curve represents the fit of eqn (1) and the continuous curve of eqn (2), where Vc= 1.30 L0 s−1, PL= 111 kN m−2, and P3*= 44.71 kN m−2. Note that Pk−P3* data and the fitted curve (pure viscoelastic equation, eqn (2) with P3*= 0) characterize the velocity dependence of force in the crossbridge component only. Note the intercept on the Pk axis (Fig. 5B) is P3* and on the Pk−P3 axis (Fig. 5C) is P3*−P3.
In contrast, P3 was insensitive to velocity; the values at lower velocities were slightly higher, but this may be because P3 was measured at a constant interval (500 ms) after the ramp. Analysis by bi-exponential curve fitting (Cavagna, 1993) indicated that the tension decay after stretch was slower after lower velocity stretches and therefore P3 would be slightly greater for these velocities. In experiments on two additional preparations, where ramp stretches of different amplitudes (1–5%L0) were applied, P3 was proportional to the size of the stretch (data not shown).
To further investigate the nature of residual force enhancement, experiments were conducted with N-benzyl-p-toluene sulphonamide (BTS), a myosin inhibitor that suppresses tension generation by crossbridges (Cheung et al. 2002; Shaw et al. 2003). BTS does not affect the calcium-activation mechanisms and the force depression is accompanied by a corresponding reduction in rapid stiffness (Pinniger et al. 2005). Figure 6A shows the tension response to stretch in the presence and absence of 10 μm BTS. Despite an ∼70% reduction in tetanic tension in the presence of BTS, the incremental peak tension during stretch (Pk) decreased only slightly and the residual force enhancement after the stretch (P3) was not depressed at all. It is also important to note that, in the presence of BTS, the tension rises nearly linearly throughout the ramp stretch so that the P1 transition is absent (see Fig. 6B) and the P2 transition is not apparent. When measured from the slopes of the tension rise and length change at a range of velocities, this monotonous tension rise corresponded to a stiffness of 10.7 ± 0.98 P0 (control)/L0 (n = 14 from four preparations); this is similar to the stiffness estimated for the tension rise from P2 to Pk in the absence of BTS from the same preparations (5.9 ± 1.32 P0 (control)/L0). These observations strongly support the idea that P3 is a non-crossbridge tension.
Figure 6. Effects of BTS on tension responses.

A, tension responses to ramp stretches (0.5 L0 s−1) recorded in the absence (−BTS) and presence (+BTS) of 10 mm BTS. B, the same tension trace as shown in A at an expanded time scale. At this resolution it can be seen that the P1 transition is abolished in the presence of BTS. C and D, rates (C) and amplitudes (D) of the two components of the tension decay after the ramp stretch in the absence (filled symbols) and presence (open symbols) of BTS (fast, squares; slow, circles).
In the simplest interpretation, P3 is an elastic force borne by a non-crossbridge component; this force develops in proportion to the extension during the ramp, reaches a maximum at the end of the ramp and remains constant afterwards at the stretched length. On this interpretation, the non-crossbridge component would contribute to Pk and P3 should be subtracted from Pk to obtain the crossbridge contribution at the end of the ramp. Figure 5C (filled squares) shows the velocity dependence of Pk−P3. If crossbridges are assumed to behave viscoelastically, the crossbridge contribution to tension would be expected to increase to a plateau (PL) as the velocity (V) is increased. An equation that describes the kinetics of weakly binding crossbridges (Schoenberg, 1985) can be adapted to analyse the dependence on velocity of peak tension with the constant amplitude stretches as used here:
| (1) |
where PL is the plateau viscoelastic tension at velocity V, and Vc is the critical velocity at which the crossbridge contribution to peak tension is PL(1 − exp−1). Thus, the tension rise to a peak during a stretch is governed by crossbridge detachment and attachment; this determines Vc and hence the velocity dependence of Pk. We used the above equation varying PL and Vc in an attempt to fit the observed dependence of Pk and Pk−P3 on velocity. But even the best fits obtained in this manner were not satisfactory; the curves were too steep at low velocities and too shallow at high velocities (see dashed curves in Fig. 5B and C).
We therefore considered an alternative case in which the non-crossbridge component is considered viscoelastic but with a relaxation rate much lower than the reciprocal of the longest ramp stretch duration used here. Consequently, the non-crossbridge contribution at the end of the ramp (P3*) was greater than the measured P3:
| (2) |
In this equation P3* therefore can be treated as a constant over the velocity range examined here: with the minimum velocity 0.1 L0 s−1 and a 5%L0 amplitude, our longest stretch duration is 500 ms, and hence the relaxation rate of the non-crossbridge viscoelasticity would be less than 1/0.5 s, i.e. < 2 s−1. When this equation was used with PL, Vc and P3* as variables, the fit to the data was more satisfactory (continuous lines in Fig. 5B and C). In particular the initial slopes were fitted better and at the highest velocity used (10 L0 s−1) the tensions have not quite reached a plateau but are still increasing.
All this suggests that a non-crossbridge tension develops during the stretch reaching P3* at the end of the ramp, but decays 500 ms after the ramp to P3. From the pooled data (see Table 1), the P3* calculated by curve fitting was ∼50 kN m−2 (0.37 P0) which is five times higher than P3 (9.7 kN m−2; 0.08 P0). Our analysis is consistent with the conclusion of Edman & Tsuchiya (1996) that the tension contribution of (visco)elastic elements progressively declines after the ramp.
Table 1.
Descriptive characteristics of the tension response to stretch: tensions are given as increments above P0 and as mean (±S.E.M., n = 6)
| P1 (per L0 s−1) | PL | Vc | P3 (measured) | P3* (calculated) | |
|---|---|---|---|---|---|
| Absolute | 3.88 ± 0.97 kN m−2 | 80.8 ± 13.1 kN m−2 | 2.31 ± 0.775 L0 s−1 | 9.72 ± 2.18 kN m−2 | 50.0 ± 8.98 kN m−2 |
| As a ratio of P0 | 0.032 ± 0.008 | 0.602 ± 0.032 | — | 0.084 ± 0.008 | 0.365 ± 0.031 |
PL (plateau tension), Vc (critical velocity) and P3
were obtained from curve fitting, P1 and P3 were measured directly from the tension records.
Figure 5C illustrates the velocity dependence of the crossbridge tension (Pk−P3*) at the end of the ramp. From this analysis (Table 1), the plateau amplitude of the crossbridge tension rise (PL) during stretch was ∼80 kN m−2 (0.6 P0). The critical velocity (Vc) was 2.3 L0 s−1. Flitney & Hirst (1978) determined a similar index for frog muscle (‘give’–Katz, 1939) in the tension–lengthening velocity relation. Their values ranged between 0.14 and 0.27 L0 s−1 for a temperature range of 0–12°C in frog muscle. Piazzesi et al. (2003) give higher values of 0.9–2.4 L0 s−1 between 5 and 11°C from single frog fibres; the differences may be due to differences in preparations, conditions and analyses.
Analysis of the effect of velocity on Pk, as described above, was also made in four experiments where 10 μm BTS was included. The BTS/control ratios were 0.15 for P0, 0.33 for PL and 0.83 for P3*; thus, the non-crossbridge contribution remains high (see Fig. 7A).
Figure 7. Examination of non-crossbridge component.

A, effects of BTS on tension contribution by the two components. Bars represent the mean (±s.e.m.) BTS/control tension ratios from 4 fibre bundles. The ratio for isometric tetanic tension P0 is shown by the open column. The ratios for PL and P3* are from analyses of the peak tension versus velocity data and amplitude of fast (Af) and amplitude of slow plus P3 (labelled NC) from analysis of the tension relaxation. Note that, with either analysis, the non-crossbridge contribution (hatched columns) is much less depressed than the crossbridge contribution (filled columns). B, absence of residual force enhancement after stretch in a slow muscle. Tension response (upper trace) to a ramp stretch at 5 L0 s−1 (lower trace) on a small bundle of soleus muscle fibres. Also shown are the isometric tetanic contractions at L0 and the extended length (L0+ 5%). The inset shows the tension response to the stretch at a higher resolution. Note that the residual tension (P3) and the tension rise after the P2 transition are absent.
Evidence that two components contribute to the tension response to stretch was also obtained from analyses of the tension decay after the ramp. The tension decay could be fitted with a bi-exponential function, with a fast (100–150 s−1) and a slow (2–10 s−1) component; the amplitude of the fast component was approximately twice that of the slow component. This ratio is similar to the ratio of PL/P3*; hence, it is reasonable to assume that the fast and slow components represent the crossbridge and non-crossbridge components, respectively. Data from analysis of the tension decay after stretch are shown in Fig. 6C and D; the rate and amplitude of the fast component decreased markedly in the presence of BTS; the slow component was little affected. From four experiments where the tension decay after a 5 L0 s−1 stretch was analysed, the BTS/control ratios were 0.4 for the amplitude of the fast component and 0.84 for the amplitude of the slow component (plus P3) (see Fig. 7A).
Thus, both analyses show that when the isometric force is reduced to ∼15% using 10 μm BTS, the crossbridge tension rise during stretch is reduced to 30–40% whereas the peak non-crossbridge tension, stiffness and the residual force enhancement remain high at ∼80% of the control. All this suggests that the residual force enhancement is provided by non-crossbridge elements.
The tension response to stretch in slow muscle fibres
Further insight into the non-crossbridge contribution to the tension response to stretch has been obtained from experiments on a different muscle fibre type. Figure 7B shows a preliminary experiment of the tension response to a ramp stretch (5%L0) of soleus (slow) muscle fibres at 5 L0 s−1 and the corresponding isometric tension records at the initial and extended length. As reported from skinned fibre experiments, slow fibres develop a higher P2/P0 ratio during stretch than fast fibres (Linari et al. 2004). Note that after the end of the ramp, the tension decays to the same level as the isometric tension at the extended length (P3= 0), i.e. there is no residual force enhancement in this muscle. This absence of residual force enhancement is accompanied by a lack of tension rise after the P2 transition (see inset). The tension records shown by Stienen et al. 1992) from skinned fibres at 15°C (their Figs 4 and 5) show a similar difference between fast and slow fibres. This is consistent with both the residual tension after stretch (P3) and the tension rise after the P2 transition arising from a non-crossbridge mechanism.
Discussion
By examining the stretch-induced tension responses in tetanized mammalian muscle fibres over a wide range of velocities, we have shown that the tension rise during a ramp stretch has two distinct transitions. A transition P2, identified by a reduction in the rate of tension rise, occurred at a stretch (L2) of ∼18 nm hs−1 which was independent of velocity; this corresponds to the critical stretch described in previous studies. An additional earlier transition, P1, was observed (at ∼0.9 ms) particularly at higher velocities; the stretch (L1) at which this took place increased with velocity, but even at the highest velocity we used, it remained the earlier event. An early ‘breakpoint’ has been reported before in frog muscle (Flitney & Hirst, 1978), cat soleus muscle (Rack & Westbury, 1974) and single frog fibres (Bagni et al. 1998; Cecchi et al. 1997; Månsson, 1994), but its underlying mechanism has been unclear. The modelling we now describe indicates that the P1 and P2 transitions arise mainly from crossbridge characteristics, whereas the residual tension after stretch arises entirely from non-crossbridge elements.
Crossbridge model simulations of the tension response
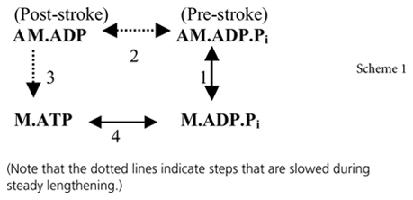
The mechano-kinetic model we used was based on the Lymn-Taylor kinetic scheme for actomyosin in solution. This is shown in Scheme 1 with two attached states (AM.ADP.Pi in a prestroke conformation and AM.ADP in a poststroke conformation) and two detached states (M.ATP and M.ADP.Pi). Step 1 is a reversible attachment, step 2 is the power stroke, step 3 is a sequence including a slow release of ADP and completion of the cycle by binding of ATP and detachment of the crossbridge, and step 4 is ATP hydrolysis on the detached crossbridge that is associated with its repriming. The strain dependence of the rate constants of the steps was defined by transition-state theory. The rate constants and the parameters defining their dependence on strain were refined against the shortening and lengthening limbs of the force–velocity curve.
To understand the events occurring during lengthening, it is necessary to define the effect of strain on the rate constants of the crossbridge cycle. If the strain in a prestroke head is x, then the energy stored in the elastic element is hx2/2, where h is the stiffness of the elastic element. If the head executes a power stroke of l, the strain will increase to x+l and the energy stored will increase to h(x+l)2/2. Consequently, compared with an untethered head in solution, the additional energy required to execute a power stroke is hl(2x+l)/2. Hence the equilibrium constant for the power stroke for a prestroke strain of x is given by Kpowerexp[−hl(2x+l)/2 kBT] where Kpower is the equilibrium constant in solution, kB is the Boltzmann constant and T the absolute temperature (Smith & Geeves, 1995a). Hence the equilibrium constant of the powerstroke decreases steeply and exponentially with x. Given Kpower= 103 (Smith & Geeves, 1995a), a powerstroke distance of 11 nm and a stiffness of 0.56 pN nm−1 used in our model, the equilibrium constant for the power stroke equals 103 when x =−l/2 =−5.5 nm but reduces to 1 when x≈−1 nm. Hence the power stroke is energetically unfavourable unless the strain in the prestroke heads is appreciably negative (Smith & Geeves, 1995a; Getz et al. 1998; Duke, 1999). A key issue is how the work term is distributed between the forward and reverse power stroke. We wanted our model to explain not only steady state behaviour but the tension transients after a step release or stretch; the initial rate of tension recovery should increase rapidly with the magnitude of release but be slow for step stretches (Huxley & Simmons, 1971). This can be achieved if the transition state is reached when the lever arm has swung more than half of its total traverse (in the current model by 65%).
In an isometric contraction heads attach at strains centred around zero, but only those prestroke heads having more negative strains undertake the power stroke. This results in the prestroke heads having a small positive (∼1.5 nm) average strain and therefore contributing appreciably to positive tension, and the poststroke heads having an average x value of about −2.4 nm and hence a strain (x+ l) =+8.6 nm. In our model about 60% of the attached heads are prestroke and only 40% poststroke. Hence the average strain is 4.3 nm for all attached heads. The poststroke heads, although in the minority, contribute a disproportionately high fraction (f) (about 79%) of the isometric tension.
Initial slope
In the simulation shown in Fig. 8A where the muscle has been stretched at a velocity of 1 L0 s−1 (= 1 nm ms−1 per hs), the tension rises initially steeply and linearly due to stretching of the compliant element of all attached heads. In our experiments we found that the slope of the initial tension rise in ramp stretches was similar to the T1 stiffness. Since T1 stiffness is a measure of the stiffness of all attached heads, this confirms that at the very beginning of the stretch there is no time for any steps in the crossbridge cycle to occur to an appreciable extent and the initial tension rise is indeed due to the extension of all attached heads.
Figure 8. Simulation of the tension transients during and after a ramp stretch using a model of the crossbridge cycle.

The ramp stretch shown is 50 nm hs−1 over 50 ms. A, time course of changes in tension expressed in pN per head. Continuous line is tension contribution from all attached heads; dashed line, contribution from heads that were attached at the beginning of the ramp; and dotted line, tension contribution from heads that become attached during the course of the ramp. B, time course of change (nm) in half-sarcomere length (hsl) and distance of filament sliding (filament sliding). C, time course of changes in fractional occupancy of attached heads in the two conformations; pre + post, all attached heads; pre, prestroke conformation; post, post stroke conformation. D, as C but considering only the heads that were attached at the beginning of the ramp. E, as C but considering only the heads that newly attach during the course of the ramp. The simulations were based on the Lymn-Taylor kinetic scheme for actomyosin ATPase in solution (Lymn & Taylor, 1971). The rate constants and their dependence on strain were obtained by refining the model against both the shortening and lengthening limbs of the force–velocity relation of fast mammalian skeletal muscle at 20°C. In the refined model obtained with a power stroke distance of 11 nm and an equilibrium constant for the power stroke of 1000 in the absence of strain, the rate constant for the power stroke with zero strain was 13 200 s−1. The rate constant for the equivalent conformational change on free myosin was 30 s−1 with 120 s−1 that for the reverse step. The rate constant for attachment of prestroke heads to actin was 1.09 × 10⁵m−1 s−1 and that for detachment 97 s−1. The effective actin concentration was taken to be 1 mm. The unstrained rate constant for the irreversible step completing the cycle (the slow release of ADP followed by fast binding of ATP and detachment of the poststroke heads) was 706 s−1; the ΔD parameter defining the effect of strain on this rate (Smith & Geeves, 1995a) was 2.08 nm. The characteristic distance (Evans, 2001) required to reach the transition state for force-enhanced detachment of prestroke heads was 1.25 nm. The crossbridge stiffness was 0.562 pN nm −1. The filament compliance was calculated on the assumption that in isometric muscle 40% of the sarcomere compliance is due to crossbridges. Note that the non-crossbridge tension is not included in this calculation.
P1 transition
In the simulation the initial linear rise in tension is followed (at ∼1.8 ms) by an inflection, simulating the P1 transition, after which the tension rises less steeply. This inflection may also be seen in the simulations of Månsson (1994). Figure 8C shows that this inflection coincides with a sharp drop in the occupancy of the poststroke heads and a concurrent rise in that of the prestroke heads due to many of the poststroke heads executing a reverse power stroke. During the rest of the stretch the occupancies of the post- and prestroke heads remain nearly constant. That a ramp stretch should induce the reversal of the power stroke is only what would be expected from the analysis by Huxley & Simmons (1971) of their step stretch experiments. By modelling we can distinguish the fate of the heads (‘original’) that were already attached at the beginning of the stretch from that of the heads (‘new’) that attach only after the beginning of the ramp. As with the total poststroke heads, there is a sharp fall in the occupancy of the original poststroke heads coincident with the tension inflection and an increase in the occupancy of the original prestroke heads (Fig. 8D). At this velocity 88% of the original poststroke heads execute a reversal of the power stroke (step 2) causing the tension inflection at P1, while the remaining 12% complete the cycle by step 3. At higher velocities an even larger fraction executes the reverse power stroke.
To understand why the reverse power stroke occurs, consider first the attached heads just before the ramp. For heads that are attached to actin subunits with appreciably negative x values, the rate constant for the reverse power stroke is negligible and their only fate is to undertake the power stroke and then complete the cycle by step 3. For heads that are attached with less negative x (say ∼−1 to −2 nm) the rate constant of the reverse power stroke is no longer negligible and after executing the power stroke, they may either complete the cycle via step 3 or execute the reverse power stroke, perhaps more than once. For those heads that are attached with x > −1 nm, the rate constant of the reverse power stroke exceeds that of the forward power stroke and the execution of the power stroke will occur more rarely. As the muscle is extended the x-value of all attached heads will increase. This will increasingly inhibit the forward power stroke and the irreversible step but increasingly accelerate the reverse power stroke. In the simulation of Fig. 8, when the half-sarcomere length (hsl) has increased by ∼2 nm the filaments have slid by ∼1.9 nm and the x-values of all the original attached heads will have increased by that amount. This will bring the poststroke heads to an average x value of ∼0.5 nm at which they are destabilized and rapidly undergo a reverse power stroke.
If at P1 the only event was that all the original poststroke heads undertook the reverse power stroke, the slope of the tension-extension record would fall from its initial value before rising again to the same value; the decrease in tension between these parallel lines would be fcP0 where f is the fraction of isometric tension due to poststroke heads and c is the fraction of the sarcomere compliance due to crossbridges. Assuming f = 0.79, c = 0.25 and P0= 150 kN m−2, the decrease in tension would be ∼30 kN m−2. However, the fall in tension due to the poststroke heads undertaking the reverse power stroke is partially offset by newly attached heads executing the forward power stroke. Correcting for this and the fact that a minority of the poststroke heads complete the cycle, the expected fall in tension at P1 is only 20 kN m−2, to be compared with our estimated tension offset of ∼12 kN m−2.
The near constancy of the time at which the P1 transition occurs over a range of lengthening velocities (see Fig. 3C) is understandable if the rate constant for the recovery process (k++k− in the Huxley-Simmons terminology) is relatively insensitive to strain. That is consistent with the recovery half-time for step stretches being insensitive to their magnitude (Huxley & Simmons, 1971; Ford et al. 1977; Ranatunga et al. 2002).
Our studies with BTS provide supporting evidence for the hypothesis that the P1 transition is due to the reverse power stroke. When the tetanic tension was depressed to ∼15% by BTS, the peak incremental tension produced by a stretch was not depressed, whereas the P1 transition was not observed (see Fig. 6B; Pinniger & Ranatunga, 2004). The suppression of force generation by BTS has been attributed, in part, to the inhibition of Pi release (Shaw et al. 2003), which would greatly reduce the occupancy of AM.ADP and hence the reduction in tension due to stretch-induced reversal of the power-stroke. Additional evidence supporting this hypothesis is that when two identical triangular stretch-releases were applied to skinned fibres, the early transition (P1) was present in the first response but absent in the second if it occurred within 1 s after the first (Campbell & Moss, 2000); the peak tension to stretch, however, remained similar. Tension traces from similar experiments on cat soleus muscle (Rack & Westbury, 1974; Fig. 2) also show an early transition on the first lengthening but not in the ones that follow soon afterwards.
The question arises as to what would happen at very low Pi concentrations where the slow Pi binding to AM.ADP would presumably limit the rate of the reverse power stroke on AM.ADP.Pi. The possibility should be considered that the force-induced reversal of the power stroke can occur in the AM.ADP state without requiring Pi binding and that the more weakly bound prestroke head produced then rapidly detaches to form M.ADP.
P2 transition
In the simulation shown in Fig. 8, the rate of tension rise decreases rather rapidly at about 14 ms corresponding to an hsl increase of 14 nm. The tension then plateaus simulating the experimental P2 transition. Lombardi & Piazzesi (1990) proposed that the extension at the P2 transition (L2) might be ‘the amount of filament sliding necessary to switch from the force response of crossbridges already attached before the lengthening starts to the force response of crossbridges interacting afresh during lengthening’. We have tested this notion by distinguishing the fate of the original and the newly attached heads. Although the occupancy of the total poststroke and total prestroke heads remains nearly constant after the P1 transition, the proportion of original heads declines, while the proportion of newly attached heads increases. New heads attach at low strain to actin subunits as they pass by and become dragged to higher strain, gradually building up a broad distribution of strains that increasingly resembles that in steady state lengthening (Matsubara & Yagi, 1985; Yagi et al. 1995; Linari et al. 2000). As the extension continues, the original heads are also dragged to increasingly higher strains. Although diminishing in numbers due to their ever-increasing rate constant of detachment, these original heads continue to have a narrow distribution of high strain and therefore exert a disproportionately high tension. Figure 8D shows that the P2 transition occurs when the occupancy of the original heads is dropping rapidly toward zero. Within a short time the last of them rapidly detach leaving only the newly attached heads and hence a near steady state. So the modelling vindicates Lombardi & Piazzesi's proposal with the proviso that the P2 transition occurs not when the switchover from original to new heads is half-way but when it is essentially complete. Further stretch will cause little further change in the distribution of strain in attached heads and therefore little change in tension. Any further increase in tension after the steady state has been attained, i.e. from P2 to Pk, is attributed to the non-crossbridge component. After the end of the ramp, the tension drops rapidly, ultimately to reach the same level as the original isometric tension. Concomitantly, the occupancies of the pre- and poststroke attached heads return to their isometric levels.
Unlike the P1 transition, the time at which the P2 transition occurs is sensitive to lengthening velocity such that the extension L2 at which the transition occurs is constant. This is understandable if the rate constant of detachment of prestroke heads is relatively low for small strains but rises steeply at higher strains.
Comparison with previous models
In our mechano-kinetic model, during lengthening, heads in the M.ADP.Pi state attach to actin at low strains, get carried to higher strains where they exert increasingly higher forces and then detach. Our model is simpler than previous models (Lombardi & Piazzesi, 1990; Piazzesi et al. 1992; Månsson, 1994; Smith & Geeves, 1995b; Getz et al. 1998) in being most closely based on the Lymn-Taylor scheme. Nevertheless, it shares features with these previous models, especially with that of Getz et al. (1998). In common with previous models, as the lengthening velocity is increased, the crossbridge cycle becomes progressively truncated, the power-stroke occurring with decreasing frequency. This explains the low turnover rate of ATP in lengthening muscle (Abbott & Aubert, 1951; Hill & Howarth, 1959; Infante et al. 1964; Curtin & Davies, 1973). At high lengthening velocities in our model there are only three predominant states, AM.ADP.Pi, M.ADP.Pi and M.ATP and at such velocities it and the model of Getz et al. (1998) converge.
Secondly, during steady-state lengthening, as in the models of Lombardi & Piazzesi (1990) and Getz et al. (1998), the tension is borne principally by the prestroke heads (in the AM.ADP.Pi state in our model and that of Getz et al. (1998), and in the first (A1) attached state in the model of Lombardi & Piazzesi (1990)). In our model the unimolecular equilibrium constant for binding of M.ADP.Pi to actin is quite low (∼1) and the rate constant of detachment is moderate (∼100 s−1). Such heads cannot be described as strongly bound as their equilibrium constant is several orders of magnitude lower than those for AM and AM.ADP and their rate constant of detachment substantially higher. But the relatively low rate constants for attachment and detachment of M.ADP.Pi in our model also contrast with the rate constants found for crossbridges in relaxed muscle at low ionic strength and temperature (Brenner, 1987). Although such crossbridges are attached, they produce stiffness only at high lengthening velocities. It was concluded that detachment and attachment of such crossbridges was very fast (∼5 × 10⁴ s−1) and they were described as weakly attached. The prestroke AM.ADP.Pi heads in our model are clearly different from such weakly attached heads. They have a much longer lifetime (several milliseconds) and it is this feature that enables them to hold tension at moderate lengthening velocities. We therefore qualitatively describe the prestroke, AM.ADP.Pi heads in our model as being of intermediate strength to differentiate them from both strongly and weakly attached heads.
Thirdly, although in common with previous models we suppose that the high forces generated in lengthening muscle accelerate detachment, we see no reason to suppose that they do so by a new pathway (‘forced detachment’). The application of force to a protein complex is now considered to speed up the spontaneous rate of dissociation, rather than dissociation occurring by a separate mechanism (Evans, 2001). Nor do we suppose that there is a critical strain, below which force has no effect on detachment and at which there is a large step increase in detachment rate. Finally, we do not require poststroke heads in the AM.ADP state to detach to form M.ADP during lengthening, as supposed in some models.
The non-crossbridge contribution to the tension increase during and after stretch
Our modelling suggests that crossbridges can account for the main features of both P1 and P2 transitions but not the P3 component. P3 was insensitive to stretch velocity but scaled with stretch amplitude and clearly is the same as the residual force enhancement after stretch that has been studied in single frog fibres (Edman et al. 1978, 1982; Bagni et al. 2002), whole isolated muscle or fibre bundles from frog and mouse (Morgan et al. 2000; Schachar et al. 2002) and human skeletal muscle in vivo (Lee & Herzog, 2002). Residual force enhancement has been linked to the development of sarcomere inhomogeneity during stretch (Julian & Morgan, 1979; Edman et al. 1978, 1982; Morgan, 1990, 1994; Edman & Tsuchiya, 1996). When an active muscle fibre in the descending limb of the force–length curve is allowed to shorten, non-uniformity may develop with the shorter (and therefore stronger) sarcomeres shortening at the expense of the longer (and therefore weaker) sarcomeres (Julian & Morgan, 1979). If instead the fibre is stretched in the plateau region of the force–length curve, non-uniformity still develops but it is much less marked, all regions lengthening although to varying extents. This concept of sarcomere inhomogeneity was developed into a specific proposal that during stretch, when weaker sarcomeres reach their yield tension, they rapidly extend (‘pop’) to a much longer sarcomere length where passive structural elements bear the tension (Morgan, 1990, 1994). The consequences of some sarcomeres popping during stretch are not easy to predict, so that the subsequent slow changes in sarcomere length may conceivably contribute to some persistent force enhancement. Our data do not completely rule out such a sarcomere-popping mechanism; however, in our view, there is no convincing evidence to support sarcomere popping during muscle stretch.
Firstly, if sarcomeres pop during stretch, most sarcomeres would not be significantly lengthened, the extension primarily occurring in the few sarcomeres that pop. Thus, the spacing of the first-order diffraction from the fibre would be expected to remain unchanged during stretch, whereas it increased (Edman et al. 1982). Secondly, microscopy indicates that not only are the inhomogeneities smaller than expected, but all sarcomeres extend during lengthening (Edman et al. 1982: Brown & Hill, 1991). Thirdly, in our view, the micrographs of Talbot & Morgan (1996) do not convincingly show popping at the predicted frequency. Finally, and tellingly, although single myofibrils might be expected to show greater instability than fibres, when active myofibrils are extended, all sarcomeres lengthen and no popping is observed (Rassier et al. 2003a; Telley et al. 2006). Thus, while there is evidence for some sarcomere inhomogeneity, there appear to be mechanisms resisting the anticipated popping during stretch.
Edman & Tsuchiya (1996) showed that in frog fibres the tension rise from the P2 transition to the peak and the residual force enhancement after stretch are associated with strain building up in viscoelastic elements other than crossbridges. They took this tension rise (i.e. Pk−P2) to be a measure of the non-crossbridge tension at the end of the ramp and showed that it decayed to about half after the stretch. In our experiments on rat muscle, similarly, Pk−P2 was ∼0.2 P0 whereas P3 was about half this. However, we consider that the non-crossbridge tension develops from the start of the stretch and that the total contribution of non-crossbridge elements to the peak tension is best measured by P3* (0.365 P0), which is substantially greater than Pk−P2. Since the tension remained steady after this time, the non-crossbridge tension may be complex, consisting of a true elastic component as well as a slowly decaying viscoelastic component.
The identity of the non-crossbridge elastic elements bearing tension has yet to be established. To contribute to residual force enhancement the elastic element must be part of a continuous chain of structures along a sarcomere (which might include thick or thin filaments) and it should be large enough to allow a strain of up to ∼30 nm to be developed on stretching (Edman & Tsuchiya, 1996). It is noteworthy that the tension responses to stretch in resting muscle fibres are qualitatively similar to those in active muscle (Mutungi & Ranatunga, 1998; Ranatunga, 2001). In the present study, the tension rise for a 5% stretch in resting fibres was only 3.4 kN m−2 while the tension rise in non-crossbridge elastic elements in active muscle (i.e. P3*) was ∼50 kN m−2. Thus parallel elastic elements would have the features required to explain residual force enhancement, provided their stiffness increases more than 10-fold on activation. In our view the difficulty in identifying the non-crossbridge structural elements responsible may be caused by adhering to the classical assumption that the parallel elastic elements present in relaxed muscle fibres are unchanged on activation. The presence of residual force enhancement in single myofibrils (Rassier et al. 2003a) indicates that the non-crossbridge component resides within the myofibril. A likely candidate is titin (Bagni et al. 2002) which possesses the characteristics necessary to account for the force increase during stretch of resting muscle (Kellermayer et al. 1997). Residual force enhancement in active muscle may be explained by an increase in titin stiffness upon activation, through calcium-dependent titin–actin interactions (Kellermayer & Granzier, 1996). Upon activation the PEVK region of the titin filament becomes anchored to the thin filament so that the flexible region of titin effectively shortens thereby stiffening the filament (Bagni et al. 2002). A contributory cause of increase in stiffness on activation may be the binding of calcium ions (Labeit et al. 2003). The suggestion that titin is the non-crossbridge component is consistent with our findings that the tension rise above P2 and residual force enhancement are absent in intact slow muscle (soleus) fibres; slow fibres contain larger titin isoforms with their stress–strain relation shifted to longer sarcomere length than fast fibres (Wang et al. 1991). Such structural features of slow muscle fibres seem suited for their role in postural motor control in which they are often exposed to lengthening contractions. However, further detailed work incorporating stiffness measurements are necessary to quantify the fibre type specificity of non-crossbridge contribution to stretch-induced force enhancement.
Another non-crossbridge component that may contribute to residual tension is C-protein. C-protein, although a component of the myosin filament (Offer et al. 1973), binds reversibly to actin in a calcium-dependent manner (Moos, 1981) and may make transient interactions with the activated thin filament (Moos et al. 1978; Squire et al. 2003). Such interactions would be viscoelastic and contribute to the tension resisting stretch in active but not in resting muscle. Hence the C-protein actin interaction appears to have the appropriate characteristics to contribute to the residual tension.
Energy storage in lengthening muscle
A description of the molecular processes underlying lengthening of active muscle should account for the energy balance between the work done on the muscle and the heat produced (Linari et al. 2003). In the early stages of a ramp stretch the increasing extension of the compliant elements of the crossbridges and the thick and thin filaments would require net energy absorption. As the crossbridges get increasingly extended, their rate of detachment would increase. Furthermore, the strain energy in a crossbridge, which is liberated as heat when it detaches, is proportional to the square of the strain. Hence the rate of heat production would increase during the stretch, as observed by Linari et al. despite the reduction in ATPase. When a steady state is reached, the rate of heat production from crossbridges would then be constant, matching the rate of work done on them. The energy absorption in the first part of the stretch (phase 1) plateaued with velocity and may correspond to the strain energy in crossbridges and filaments. Linari et al. (2003) observed, however, that the energy absorption in the later part of the stretch (phase 2), unlike the tension, did not plateau with velocity. Furthermore, two-thirds of the total energy absorption by muscle in a ramp stretch (∼0.09 P0L0) could not be accounted for by strain energy in cross-bridges and thick and thin filaments. They suggested that highly extended titin filaments in a small number (5%) of popped sarcomeres could contribute as much as 0.015 P0L0 to the total energy absorption. In our 5%L0 stretches the non-crossbridge component contributed 0.365 P0 to the peak tension, corresponding to an energy absorption of 0.365 × 0.05/2 = 0.009 P0L0. Assuming that in the 10% stretches used by Linari et al. the contribution to peak tension doubles, the energy absorption in the non-crossbridge component would be 0.037 P0L0, which is ∼40% of the total energy absorption. So the non-crossbridge component rather than the crossbridges (Cavagna et al. 1994) may play a major role in animal locomotion by storing energy during lengthening which in the short term could be used in a subsequent release.
Acknowledgments
We thank The Wellcome Trust for the support of our research. We are grateful to Professors A. Bagni, G. Cecchi, and G. Piazzesi (Italy), Professor K. A. P. Edman (Sweden), Dr A. Månsson (Sweden), Dr D. Rassier (Canada) and Professor M. Gautel (UK) for discussion and helpful comments on different versions of the manuscript. G.J.P was in receipt of an International Travelling Fellowship from The Wellcome Trust.
References
- Abbott BC, Aubert XM. Changes of energy in a muscle during very slow stretches. Proc R Soc Lond B. 1951;139:104–117. doi: 10.1098/rspb.1951.0049. [DOI] [PubMed] [Google Scholar]
- Abbott BC, Aubert XM. The force exerted by active striated muscle during and after change of length. J Physiol. 1952;117:77–86. [PMC free article] [PubMed] [Google Scholar]
- Bagni MA, Cecchi G, Cecchini E, Colombini B, Colomo F. Force responses to fast ramp stretches in stimulated frog skeletal muscle fibres. J Muscle Res Cell Motil. 1998;19:33–42. doi: 10.1023/a:1005348209816. [DOI] [PubMed] [Google Scholar]
- Bagni MA, Cecchi G, Colombini B, Colomo F. A non-cross-bridge stiffness in activated frog muscle fibers. Biophys J. 2002;82:3118–3127. doi: 10.1016/S0006-3495(02)75653-1. [DOI] [PMC free article] [PubMed] [Google Scholar]
- Brenner B. Mechanical and structural approaches to correlation of cross-bridge action in muscle with actomyosin ATPase in solution. Ann Rev Physiol. 1987;49:655–672. doi: 10.1146/annurev.ph.49.030187.003255. [DOI] [PubMed] [Google Scholar]
- Brown LM, Hill L. Some observations on variations in filament overlap in tetanized muscle fibres and fibres stretched during a tetanus, detected in the electron microscope after rapid fixation. J Muscle Res Cell Motil. 1991;12:171–182. doi: 10.1007/BF01774036. [DOI] [PubMed] [Google Scholar]
- Campbell KS, Moss RL. A thixotropic effect in contracting rabbit psoas muscle: prior movement reduces the initial tension response to stretch. J Physiol. 2000;525:531–548. doi: 10.1111/j.1469-7793.2000.00531.x. [DOI] [PMC free article] [PubMed] [Google Scholar]
- Cavagna GA. Effect of temperature and velocity of stretching on stress relaxation of contracting frog muscle fibres. J Physiol. 1993;462:161–173. doi: 10.1113/jphysiol.1993.sp019549. [DOI] [PMC free article] [PubMed] [Google Scholar]
- Cavagna GA, Heglund NC, Harry JD, Mantovani M. Storage and release of mechanical energy by contracting frog muscle fibres. J Physiol. 1994;481:689–708. doi: 10.1113/jphysiol.1994.sp020474. [DOI] [PMC free article] [PubMed] [Google Scholar]
- Cecchi G, Bagni MA, Cecchini E, Colombini B, Colomo F. Crossbridge viscosity in activated frog muscle fibres. Biophys Chem. 1997;68:1–8. doi: 10.1016/s0301-4622(96)02263-6. [DOI] [PubMed] [Google Scholar]
- Cheung A, Dantzig JA, Hollingworth S, Baylor SM, Goldman YE, Mitchison TJ, Straight AF. A small-molecule inhibitor of skeletal muscle myosin II. Nature Cell Biol. 2002;4:83–88. doi: 10.1038/ncb734. [DOI] [PubMed] [Google Scholar]
- Coupland ME, Ranatunga KW. Force generation induced by rapid temperature jumps in intact mammalian (rat) skeletal muscle fibres. J Physiol. 2003;548:439–449. doi: 10.1113/jphysiol.2002.037143. [DOI] [PMC free article] [PubMed] [Google Scholar]
- Curtin NA, Davies RE. Chemical and mechanical changes during stretching of activated frog skeletal muscle. Cold Spring Harb Symp Quant Biol. 1973;37:619–626. [Google Scholar]
- Duke TA. Molecular model of muscle contraction. Proc Natl Acad Sci U S A. 1999;96:2770–2775. doi: 10.1073/pnas.96.6.2770. [DOI] [PMC free article] [PubMed] [Google Scholar]
- Edman KA, Elzinga G, Noble MI. Enhancement of mechanical performance by stretch during tetanic contractions of vertebrate skeletal muscle fibres. J Physiol. 1978;281:139–155. doi: 10.1113/jphysiol.1978.sp012413. [DOI] [PMC free article] [PubMed] [Google Scholar]
- Edman KA, Elzinga G, Noble MI. Critical sarcomere extension required to recruit a decaying component of extra force during stretch in tetanic contractions of frog skeletal muscle fibres. J General Physiol. 1981;78:365–382. doi: 10.1085/jgp.78.4.365. [DOI] [PMC free article] [PubMed] [Google Scholar]
- Edman KA, Elzinga G, Noble MI. Residual force enhancement after stretch of contracting frog single muscle fibres. J General Physiol. 1982;80:769–784. doi: 10.1085/jgp.80.5.769. [DOI] [PMC free article] [PubMed] [Google Scholar]
- Edman KA, Tsuchiya T. Strain of passive elements during force enhancement by stretch in frog muscle fibres. J Physiol. 1996;490:191–205. doi: 10.1113/jphysiol.1996.sp021135. [DOI] [PMC free article] [PubMed] [Google Scholar]
- Elmubarak MH, Ranatunga KW. Temperature sensitivity of tension development in a fast-twitch muscle of the rat. Muscle Nerve. 1984;7:298–303. doi: 10.1002/mus.880070408. [DOI] [PubMed] [Google Scholar]
- Evans E. Probing the relation between force-lifetime and chemistry in single molecular bonds. Ann Rev Biophys Biomol Struct. 2001;30:105–128. doi: 10.1146/annurev.biophys.30.1.105. [DOI] [PubMed] [Google Scholar]
- Fenn WO. The relationship between the work performed and the energy liberated in muscular contraction. J Physiol. 1924;59:373–395. doi: 10.1113/jphysiol.1924.sp002141. [DOI] [PMC free article] [PubMed] [Google Scholar]
- Flitney FW, Hirst DG. Crossbridge detachment and sarcomere ‘give’ during stretch of active frog's muscle. J Physiol. 1978;276:449–465. doi: 10.1113/jphysiol.1978.sp012246. [DOI] [PMC free article] [PubMed] [Google Scholar]
- Ford LE, Huxley AF, Simmons RM. Tension responses to sudden length change in stimulated frog muscle fibres near slack length. J Physiol. 1977;269:441–515. doi: 10.1113/jphysiol.1977.sp011911. [DOI] [PMC free article] [PubMed] [Google Scholar]
- Getz EB, Cooke R, Lehman SL. Phase transition in force during ramp stretches of skeletal muscle. Biophys J. 1998;75:2971–2983. doi: 10.1016/S0006-3495(98)77738-0. [DOI] [PMC free article] [PubMed] [Google Scholar]
- Herzog W, Leonard TR. Force enhancement following stretching of skeletal muscle: a new mechanism. J Exp Biol. 2002;205:1275–1283. doi: 10.1242/jeb.205.9.1275. [DOI] [PubMed] [Google Scholar]
- Hill AV. The heat of shortening and the dynamic constants of muscle. Proc Roy Soc Lond B. 1938;126:136–195. [Google Scholar]
- Hill AV, Howarth JV. The reversal of chemical reactions in contracting muscle during an applied stretch. Proc Roy Soc B. 1959;151:169–193. [Google Scholar]
- Huxley AF, Simmons RM. Proposed mechanism of force generation in striated muscle. Nature. 1971;233:533–538. doi: 10.1038/233533a0. [DOI] [PubMed] [Google Scholar]
- Infante AA, Klaupiks D, Davies RE. Adenosine triphosphate: changes in muscles doing negative work. Science. 1964;144:1577–1578. doi: 10.1126/science.144.3626.1577. [DOI] [PubMed] [Google Scholar]
- Joyce GC, Rack PM. Isotonic lengthening and shortening movements of cat soleus muscle. J Physiol. 1969;204:475–491. doi: 10.1113/jphysiol.1969.sp008925. [DOI] [PMC free article] [PubMed] [Google Scholar]
- Joyce GC, Rack PM, Westbury DR. The mechanical properties of cat soleus muscle during controlled lengthening and shortening movements. J Physiol. 1969;204:461–474. doi: 10.1113/jphysiol.1969.sp008924. [DOI] [PMC free article] [PubMed] [Google Scholar]
- Julian F, Morgan D. The effect on tension of non-uniform distribution of length changes applied to frog muscle fibres. J Physiol. 1979;293:379–392. doi: 10.1113/jphysiol.1979.sp012895. [DOI] [PMC free article] [PubMed] [Google Scholar]
- Katz B. The relations between force and speed in muscular contraction. J Physiol. 1939;96:45–64. doi: 10.1113/jphysiol.1939.sp003756. [DOI] [PMC free article] [PubMed] [Google Scholar]
- Kellermayer MSZ, Granzier HL. Calcium-dependent inhibition of in vitro thin-filament motility by native titin. FEBS Lett. 1996;380:281–286. doi: 10.1016/0014-5793(96)00055-5. [DOI] [PubMed] [Google Scholar]
- Kellermayer MSZ, Smith SB, Granzier HL, Bustamante C. Folding-unfolding transitions in single titin molecules characterized with laser tweezers. Science. 1997;276:1112–1116. doi: 10.1126/science.276.5315.1112. [DOI] [PubMed] [Google Scholar]
- Labeit D, Watanabe K, Witt C, Fujita H, Wu Y, Lahmers S, Funck T, Labeit S, Granzier H. Calcium-dependent molecular spring elements in the giant protein titin. Proc Natl Acad Sci U S A. 2003;100:13716–13721. doi: 10.1073/pnas.2235652100. [DOI] [PMC free article] [PubMed] [Google Scholar]
- Lee H-D, Herzog W. Force enhancement following muscle stretch of electrically stimulated and voluntarily activated human adductor pollicis. J Physiol. 2002;545:321–330. doi: 10.1113/jphysiol.2002.018010. [DOI] [PMC free article] [PubMed] [Google Scholar]
- Linari M, Bottinelli R, Pellegreno MA, Reconditi M, Reggiani C, Lombardi V. The mechansim of the force response to stretch in human skeletal muscle fibres with different myosin isoforms. J Physiol. 2004;554:335–352. doi: 10.1113/jphysiol.2003.051748. [DOI] [PMC free article] [PubMed] [Google Scholar]
- Linari M, Lucii L, Reconditi M, Casoni ME, Amenitsch H, Bernstorff S, Piazzesi G, Lombardi V. A combined mechanical and X-ray diffraction study of stretch potentiation in single frog muscle fibres. J Physiol. 2000;526:589–596. doi: 10.1111/j.1469-7793.2000.00589.x. [DOI] [PMC free article] [PubMed] [Google Scholar]
- Linari M, Woledge RC, Curtin NA. Energy storage during stretch of active single fibres from frog skeletal muscle. J Physiol. 2003;548:461–474. doi: 10.1113/jphysiol.2002.032185. [DOI] [PMC free article] [PubMed] [Google Scholar]
- Lombardi V, Piazzesi G. The contractile response during steady lengthening of stimulated frog muscle fibres. J Physiol. 1990;431:141–171. doi: 10.1113/jphysiol.1990.sp018324. [DOI] [PMC free article] [PubMed] [Google Scholar]
- Lymn RW, Taylor EW. Mechanism of adenosine triphosphate hydrolysis by actomyosin. Biochem. 1971;10:4617–4624. doi: 10.1021/bi00801a004. [DOI] [PubMed] [Google Scholar]
- Månsson A. The tension response to stretch of intact skeletal muscle fibres of the frog at varied tonicity of the extracellular medium. J Muscle Res Cell Motil. 1994;15:145–157. doi: 10.1007/BF00130425. [DOI] [PubMed] [Google Scholar]
- Matsubara I, Yagi N. Movements of cross-bridges during and after slow length changes in active frog skeletal muscle. J Physiol. 1985;361:151–163. doi: 10.1113/jphysiol.1985.sp015638. [DOI] [PMC free article] [PubMed] [Google Scholar]
- Moos C. Fluorescence microscope study of the binding of added C protein to skeletal muscle myofibrils. J Cell Biol. 1981;90:25–31. doi: 10.1083/jcb.90.1.25. [DOI] [PMC free article] [PubMed] [Google Scholar]
- Moos C, Mason CM, Besterman JM, Feng IN, Dubin JH. The binding of skeletal muscle C-protein to F-actin, and its relation to the interaction of actin with myosin subfragment-1. J Mol Biol. 1978;124:571–586. doi: 10.1016/0022-2836(78)90172-9. [DOI] [PubMed] [Google Scholar]
- Morgan DL. New insights into the behavior of muscle during active lengthening. Biophys J. 1990;57:209–221. doi: 10.1016/S0006-3495(90)82524-8. [DOI] [PMC free article] [PubMed] [Google Scholar]
- Morgan DL. An explanation for residual increased tension in striated muscle after stretch during contraction. Exp Physiol. 1994;79:831–838. doi: 10.1113/expphysiol.1994.sp003811. [DOI] [PubMed] [Google Scholar]
- Morgan DL, Whitehead NP, Wise AK, Gregory JE, Proske U. Tension changes in the cat soleus muscle following slow stretch or shortening of the contracting muscle. J Physiol. 2000;522:503–513. doi: 10.1111/j.1469-7793.2000.t01-2-00503.x. [DOI] [PMC free article] [PubMed] [Google Scholar]
- Mutungi G, Ranatunga KW. The visco-elasticity of resting intact mammalian (rat) fast muscle fibres. J Muscle Res Cell Motil. 1996;17:357–364. doi: 10.1007/BF00240933. [DOI] [PubMed] [Google Scholar]
- Mutungi G, Ranatunga KW. Temperature-dependent changes in the viscoelasticity of intact resting mammalian (rat) fast- and slow-twitch muscle fibres. J Physiol. 1998;508:253–265. doi: 10.1111/j.1469-7793.1998.253br.x. [DOI] [PMC free article] [PubMed] [Google Scholar]
- Mutungi G, Ranatunga KW. The effects of ramp stretches on active contractions in intact mammalian fast and slow muscle fibres. J Muscle Res Cell Motil. 2001;22:175–184. doi: 10.1023/a:1010556623905. [DOI] [PubMed] [Google Scholar]
- Offer G, Moos C, Starr R. A new protein of the thick filaments of vertebrate skeletal myofibrils. Extraction, purification and characterization. J Mol Biol. 1973;74:653–676. doi: 10.1016/0022-2836(73)90055-7. [DOI] [PubMed] [Google Scholar]
- Piazzesi G, Francini F, Linari M, Lombardi V. Tension transients during steady lengthening of tetanized muscle fibres of the frog. J Physiol. 1992;445:659–711. doi: 10.1113/jphysiol.1992.sp018945. [DOI] [PMC free article] [PubMed] [Google Scholar]
- Piazzesi G, Reconditi M, Koubassova N, Decostre V, Linari M, Lucii L, Lombardi V. Temperature dependence of the force-generating process in single fibres from frog skeletal muscle. J Physiol. 2003;549:93–106. doi: 10.1113/jphysiol.2002.038703. [DOI] [PMC free article] [PubMed] [Google Scholar]
- Pinniger GJ, Bruton JD, Westerblad H, Ranatunga KW. Effects of a myosin-II inhibitor (N-benzyl-p-toluene sulphonamide, BTS) on contractile characteristics of intact fast-twitch mammalian muscle fibres. J Muscle Res Cell Motil. 2005;26:135–141. doi: 10.1007/s10974-005-2679-2. [DOI] [PubMed] [Google Scholar]
- Pinniger GJ, Coupland ME, Ranatunga KW. Force enhancement during lengthening in mammalian (rat) muscle fibres: the effect of temperature. J Physiol. 2003;548:132. [Google Scholar]
- Pinniger GJ, Ranatunga KW. A component of stretch induced force in active muscle is not inhibited by BTS (a myosin-II inhibitor) Biophys J. 2004;86:565A. [Google Scholar]
- Rack PM, Westbury DR. The short range stiffness of active mammalian muscle and its effect on mechanical properties. J Physiol. 1974;240:331–350. doi: 10.1113/jphysiol.1974.sp010613. [DOI] [PMC free article] [PubMed] [Google Scholar]
- Ranatunga KW. Sarcomeric visco-elasticity of chemically skinned skeletal muscle fibres of the rabbit at rest. J Muscle Res Cell Motil. 2001;22:399–414. doi: 10.1023/a:1014502610259. [DOI] [PubMed] [Google Scholar]
- Ranatunga KW, Coupland ME, Mutungi G. An asymmetry in the phosphate dependence of tension transients induced by length perturbation in mammalian (rabbit psoas) muscle fibres. J Physiol. 2002;542:899–910. doi: 10.1113/jphysiol.2002.019471. [DOI] [PMC free article] [PubMed] [Google Scholar]
- Rassier DE, Herzog W, Pollack GH. Stretch-induced force enhancement and stability of skeletal muscle myofibrils. Adv Exp Med Biol. 2003a;538:501–515. doi: 10.1007/978-1-4419-9029-7_45. [DOI] [PubMed] [Google Scholar]
- Rassier DE, Herzog W, Wakeling J, Syme DA. Stretch-induced, steady-state force enhancement in single skeletal muscle fibres exceeds the isometric force at optimum fibre length. J Biomech. 2003b;36:1309–1316. doi: 10.1016/s0021-9290(03)00155-6. [DOI] [PubMed] [Google Scholar]
- Schachar R, Herzog W, Leonard TR. Force enhancement above the initial isometric force on the descending limb of the force-length relationship. J Biomech. 2002;35:1299–1306. doi: 10.1016/s0021-9290(02)00188-4. [DOI] [PubMed] [Google Scholar]
- Schoenberg M. Equilibrium muscle cross-bridge behavior. Theoretical considerations. Biophys J. 1985;48:467–475. doi: 10.1016/S0006-3495(85)83802-9. [DOI] [PMC free article] [PubMed] [Google Scholar]
- Shaw MA, Ostap EM, Goldman YE. Mechanism of inhibition of skeletal muscle actomyosin by N-benzyl-p-toluenesulfonamide. Biochemistry. 2003;42:6128–6135. doi: 10.1021/bi026964f. [DOI] [PubMed] [Google Scholar]
- Smith DA, Geeves MA. Strain-dependent crossbridge cycle for muscle. Biophys J. 1995a;69:524–537. doi: 10.1016/S0006-3495(95)79926-X. [DOI] [PMC free article] [PubMed] [Google Scholar]
- Smith DA, Geeves MA. Strain-dependent cross-bridge cycle for muscle. II. Steady-state behavior. Biophys J. 1995b;69:538–552. doi: 10.1016/S0006-3495(95)79927-1. [DOI] [PMC free article] [PubMed] [Google Scholar]
- Squire JM, Luther PK, Knupp C. Structural evidence for the interaction of C-protein (MyBP-C) with actin and sequence identification of a possible actin-binding domain. J Mol Biol. 2003;331:713–724. doi: 10.1016/s0022-2836(03)00781-2. [DOI] [PubMed] [Google Scholar]
- Stienen G, Versteeg P, Papp Z, Elzinga G. Mechanical properties of skinned rabbit psoas and soleus muscle fibres during lengthening: effects of phosphate and Ca2+ J Physiol. 1992;451:503–523. doi: 10.1113/jphysiol.1992.sp019176. [DOI] [PMC free article] [PubMed] [Google Scholar]
- Sugi H. Tension changes during and after stretch in frog muscle fibres. J Physiol. 1972;225:237–253. doi: 10.1113/jphysiol.1972.sp009935. [DOI] [PMC free article] [PubMed] [Google Scholar]
- Sugi H, Tsuchiya T. Stiffness changes during enhancement and deficit of isometric force by slow length changes in frog skeletal muscle fibres. J Physiol. 1988;407:215–229. doi: 10.1113/jphysiol.1988.sp017411. [DOI] [PMC free article] [PubMed] [Google Scholar]
- Talbot JA, Morgan DL. Quantitative analysis of sarcomere non-uniformities in active muscle following a stretch. J Muscle Res Cell Motil. 1996;17:261–268. doi: 10.1007/BF00124247. [DOI] [PubMed] [Google Scholar]
- Telley A, Stehle R, Ranatunga KW, Pfitzer G, Stüssi E, Denoth J. Dynamic behaviour of half-sarcomeres during and after stretch in activated psoas myofibrils: sarcomere asymmetry but no ‘sarcomere popping’. J Physiol. 2006;573:173–185. doi: 10.1113/jphysiol.2006.105809. [DOI] [PMC free article] [PubMed] [Google Scholar]
- ter Keurs HE, Luff AR, Luff SE. Force-sarcomere-length relation and filament length in rat extensor digitorum muscle. Adv Exp Med Biol. 1984;170:511–525. doi: 10.1007/978-1-4684-4703-3_44. [DOI] [PubMed] [Google Scholar]
- Wang K, McCarter R, Wright J, Beverly J, Ramirez-Mitchell R. Regulation of skeletal muscle stiffness and elasticity by titin isoforms: a test of the segmental extension model of resting tension. Proc Natl Acad Sci U S A. 1991;88:7101–7105. doi: 10.1073/pnas.88.16.7101. [DOI] [PMC free article] [PubMed] [Google Scholar]
- Yagi N, Amemiya Y, Wakabayashi K. A real-time observation of X-ray diffraction from frog skeletal muscle during and after slow length changes. Jpn J Physiol. 1995;45:583–606. doi: 10.2170/jjphysiol.45.583. [DOI] [PubMed] [Google Scholar]