Abstract
Accumulating evidence indicates that the CD4 homologue lymphocyte activation gene-3 (LAG-3) plays a down-regulatory role on T-cell responses. However, the role of LAG-3/major histocompatibility complex (MHC) class II interactions on primary human T-cell responses, as well as the mechanism by which down-regulation occurs, are not clear. Here, we show that LAG-3 colocalized with CD3, CD4 or CD8 in areas of cholesterol-rich raft aggregation during this primary response, as well as in the clustered raft region formed between T cells and antibody-coated beads. Addition of a blocking LAG-3-specific monoclonal antibody to both CD4 and CD8 primary resting T cells activated under conditions of antigen-presenting cell-driven stimulation and low antigen concentrations augments CD69 activation antigen expression, T-cell expansion and T helper 1 (Th1, but not Th2) cytokine production. Blocking LAG-3/MHC class II interactions leads to an increase in the number of cells entering division at these low concentrations of antigen and to more rounds of divisions with an accumulation of cells in the S-phase of the cell cycle. These results indicate that LAG-3 signalling inhibits early events in primary activation of human CD4 and CD8 T cells and further support a role for LAG-3 signalling in regulating the expansion of activated effector or memory T cells, either directly or indirectly through Treg suppressor activity.
Keywords: cell proliferation, CD223, MHC class II, T cell
Introduction
T-cell activation through the T-cell receptor (TCR) involves partitioning of receptors into discrete membrane compartments known as lipid rafts, followed by the formation of an immunological synapse (IS) between the T cell and the antigen-presenting cell (APC). Formation of an IS correlates with clustering of glycosphingolipid-enriched microdomains (GSL complexes) that move into the IS in response to CD3 and CD28.1 Lipid rafts are enriched with signalling molecules critical for TCR-mediated cell activation such as PKCθ or lck2,3 but also for inhibition of cell activation such as cytotoxic T-lymphocyte antigen-4 (CTLA-4; CD152).4 Studying the compartmentalization of negative regulators of T-cell activation may provide insights into their mechanism of action.4
Here we looked at another negative regulator of T-cell activation, LAG-3 (lymphocyte activation gene-3 or CD223). LAG-3 is an activation-induced TCR coreceptor that binds major histocompatibility complex (MHC) class II molecules with high affinity.5–8 LAG-3 cross-linking on activated human T cells induces T-cell functional unresponsiveness and inhibition of TCR-induced calcium fluxes.9 LAG-3 and CD3 have to be physically coligated for negative signalling (as assessed by calcium flux induction) to occur.9 LAG-3 was found to be indeed specifically associated with the CD3–TCR complex following TCR engagement10 and is therefore considered as a (negative) coreceptor, like the two other TCR-associated MHC ligands, CD4 and CD8.8 Finally, recent work by Vignali et al. has shown that LAG-3 negatively regulates CD4-dependent T-cell function in murine cells through interaction of a ‘KIEELE’ intracytoplasmic motif with downstream signalling molecules.11,12 In addition, LAG-3(–/–) mice exhibit a T-cell defect leading to increased T-cell expansion and increased numbers of CD4+ and CD8+ cells in the memory T-cell pool.13 Finally, LAG-3 marks regulatory T-cell populations and contributes to their suppressor activity.14
The addition of anti-LAG-3 antibodies (17B4), both intact and Fab fragments, to antigen-dependent, MHC class II-restricted responses of human T-cell lines and clones first revealed that LAG-3/MHC class II interaction down-regulates antigen-dependent, but not antigen-independent, stimulation of CD4+ T lymphocytes.15 However enhanced or prolonged thymidine incorporation was not observed with CD8+ CTL clones or lines or when testing the anti-LAG-3 monoclonal antibodies (mAb) in primary T-cell responses such as the mixed lymphocyte reaction.15 Thus, it was unclear whether LAG-3/MHC class II interactions could have, like CTLA-4, a significant biological role in attenuating human T-cell responses, because these results suggest that the function of LAG-3 may depend on the context of the stimulatory conditions present during T-cell activation. Our past results obtained on some activated CD4 T-cell lines or clones15 were therefore not conclusive with regards to the negative regulatory function of LAG-3 on primary activated human T cells.
CTLA-4 is considered to be a major player in the down-regulation of specific immune responses and in prevention of T-cell mediated exacerbation of disease. After TCR stimulation, CTLA-4 coclusters with the TCR and the lipid raft ganglioside GM1 within the IS.4 Cross-linking of CTLA-4 was shown to inhibit T cell responses in vitro while blocking CTLA-4 had the opposite effect.16,17 CTLA-4 ligation blocked the induction of raft surface expression caused by TCR ligation alone or in combination with CD28.18 Because LAG-3 and CTLA-4 are both activation antigens that down-regulate T-cell activation, we reassessed the negative regulatory role of LAG-3 in human T cells in the light of recent advances in understanding the cell biology of CTLA-4.19
Despite its pivotal role in the regulation of T-cell function and homeostasis13 little is known about the structural nature or mechanism of action of LAG-3-mediated inhibition of T-cell activation. Here we present evidence that LAG-3 is associated with the CD3/TCR complex and the CD4 or CD8 coreceptors in clustered GSL complexes on primary activated T cells. We then took advantage of the possibility to stimulate a large (15–30%) subset of both CD4 and CD8 primary resting T cells (i.e. peripheral blood mononuclear cells, PBMC) under conditions of APC-driven stimulation using low doses of staphylococcal enterotoxin B (SEB) and found increased cell activation and expansion in conditions where LAG-3/MHC class II interactions are inhibited. We show that LAG-3 prevents the entry of T cells into the growth phase beyond the S-phase of the cell cycle, leading to inhibition of T-cell expansion. Finally, we present evidence that LAG-3 function is not dependent on CD4, as primary CD8 T-cell activation is also inhibited by LAG-3/MHC class II interactions.
Materials and methods
Cell culture and stimulation
PBMC were isolated from whole blood of normal healthy volunteers by Ficoll-Paque density gradient centrifugation (Amersham Pharmacia Biotech, Uppsala, Sweden) and washed twice in phosphate-buffered saline (PBS). PBMCs were cultured at 106 cells/ml with or without SEB (Sigma-Aldrich, St Louis, MO) in complete medium (RPMI-1640 supplemented with 10% heat-inactivated fetal calf serum, 2 mm l-glutamine, 100 U/ml penicillin and 100 µg/ml streptomycin) for the indicated time in the presence or absence of 10 µg/ml LAG-3-specific 17B4 mAb (immunoglobulin G1, IgG1) known to inhibit LAG-3/MHC class II interactions.6 Mouse IgG1 was used as control.
Cytofluorometric analysis
At day 1, 2 or 3 PBMCs were stained for 30 min at 4° in PBS containing 1% bovine serum albumin (BSA) and 10 mm azide with fluoroscein isothiocyanate (FITC)– or phycoerythrin (PE)–CD3, FITC– or PE–CD4, FITC– or PE–CD8, FITC– or PE–CD69 (all Immunotech, Marseille, France) mAbs. FITC– or PE–IgG1 mAbs (all BD Pharmingen, San Diego, CA) were used as negative control. Labelled cells were analysed with an Epics Elite cytometer (Beckman Coulter, Villepointe, France).
For apoptosis analysis, cells were labelled with FITC–annexin V according to the manufacturer's instructions (BD Biosciences, San Jose, CA) and propidium iodide (PI; 50 µg/ml, Sigma-Aldrich) for 15 min on ice in the dark.
Proliferation of carboxy-fluorescein diacetate succinimidyl ester (CFSE)-labelled PBMCs
Fresh purified PBMCs were labelled with 4 µm CFSE (Molecular Probes, Eugene, OR) for 10 min at 37° in PBS. Cold complete medium was added and cells were incubated for another 5 min in the dark. Then cells were washed and cultured as described above. At days 2, 3 and 4, PBMCs were labelled with PE–CD4 or PE–CD8 mAbs and MofFit Verity software was used to determine the percentage of live T cells in each division peak and data were expressed as ‘sum of total percent divisions’ of CD4+ or CD8+ cells (i.e. cells with low CFSE or CFSELow).
Cytokine assay
PBMC were cultured with 0·1 ng/ml SEB for 2 days at 37° in the presence or absence of 17B4 LAG-3-specific mAb. Th1 and Th2 cytokines were measured in culture supernatants using microparticle-based flow cytometric technology (CBA Kit, BD Biosciences) according to the manufacturer's instructions.
Cell cycling/DNA content analysis and proliferation assay
At days 4 and 6, PBMC suspensions were washed and incubated with FITC–CD3 mAbs for 30 min at 4° in the dark. Then cells were washed and fixed in 500 µl 70% ethanol at −20° at least for 1 day. Cells were resuspended in 500 µl PBS containing 50 µg/ml PI for 30 min at 4° and analysed by flow cytometry. The percentage of CD3 gated cells in S-phase was determined with the MofFit Verity software.
Confocal microscopy
PBMC cultured with 10 ng/ml SEB for 2 days were fixed with 2% paraformaldehyde (PFA) for 15 min at room temperature, incubated with LAG-3-specific 17B4 mAb (IgG1) and then incubated with Alexa Fluor 488 or 546 anti-mouse IgG1. Cells were washed and incubated with FITC–CD3-, –CD4- or –CD8-specific mAbs. PE-conjugated CD11a-specific mAb (IgG1) was used as a negative control for raft formation. All incubations were performed at 10 µg/ml for 30 min at 4° in the dark.
Jurkat cells were stably transfected with a plasmid containing the LAG-3 insert. Stably transfected cells were stimulated for 30 min at 37° with OKT3 plus CD28 mAbs coated to latex Dynabeads according to the manufacturer's instructions (Polysciences, Warrington, PA). The cells/beads complexes were fixed with cold 4% paraformaldehyde, washed, and incubated for 30 min on ice in the dark with FITC–cholera toxin B chain (CTB-FITC) (10 µg/ml, Sigma-Aldrich) then with LAG-3-specific 17B4 mAb and with Alexa Fluor 546 anti-mouse IgG1.
Stained PBMC or Jurkat cells/beads complexes were mounted on coverslips coated with poly L-lysine (Sigma-Aldrich) using Fluoromount G (Southern Biotechnology Associates, Birmingham, AL). Confocal analysis was conducted using a confocal laser scanning microscope (LSM 510 equipped with an air-cooled argon ion laser 488 nm and a helium neon laser 543 nm; Zeiss, Le Pecq, France) configured with an Axiovert 100 m microscope using a Plan Apochromat X 63/1·40 oil objective.
Statistics
Data were analysed by the non-parametric Mann–Whitney U-rank test and differences with P < 0·05 were considered statistically significant.
Results
Sequestration of LAG-3 into rafts complexes following antigen stimulation of human T cells
Immunofluorescence microscopy was used to examine the relative location of LAG-3 in clustered lipid rafts known to contain CD3, CD4 or CD8 and GM1 (recognized by CTB) under conditions of APC-driven stimulation using SEB. PBMC cultured for 2 days without SEB exhibited a homogeneous surface expression pattern of CD3, CD4 or CD8, low surface expression of GM1 and no LAG-3 (data not shown). After stimulation with 10 ng/ml SEB for 2 days, LAG-3 was expressed and polarized to the same location as the corresponding GSL complexes containing CD3, CD4 or CD8 (Fig. 1a). CD11a was used as a negative control that does not polarize in patches. GM1 expression was low and could not be visualized using CTB. We then used a Jurkat T clone transfected with a plasmid coding for LAG-3, which expresses much higher levels of GM1 at the cell surface. These cells were stimulated with anti-CD3 plus anti-CD28 mAb coated latex beads. At the bead–cell interface, the clustered rafts were clearly visualized with CTB and LAG-3 (Fig. 1b, left-hand panel). Overall, these experiments performed on live cells (PFA was added after labelling) show that most LAG-3 molecules are polarized into clustered cholesterol-rich lipid rafts after T-cell antigen stimulation. The present results confirmed the localization of LAG-3 in the GSL complexes.20 These patched GSL complexes probably function to concentrate the surface receptors and ligands with the effectors, thus optimizing associations during signalling.
Figure 1.
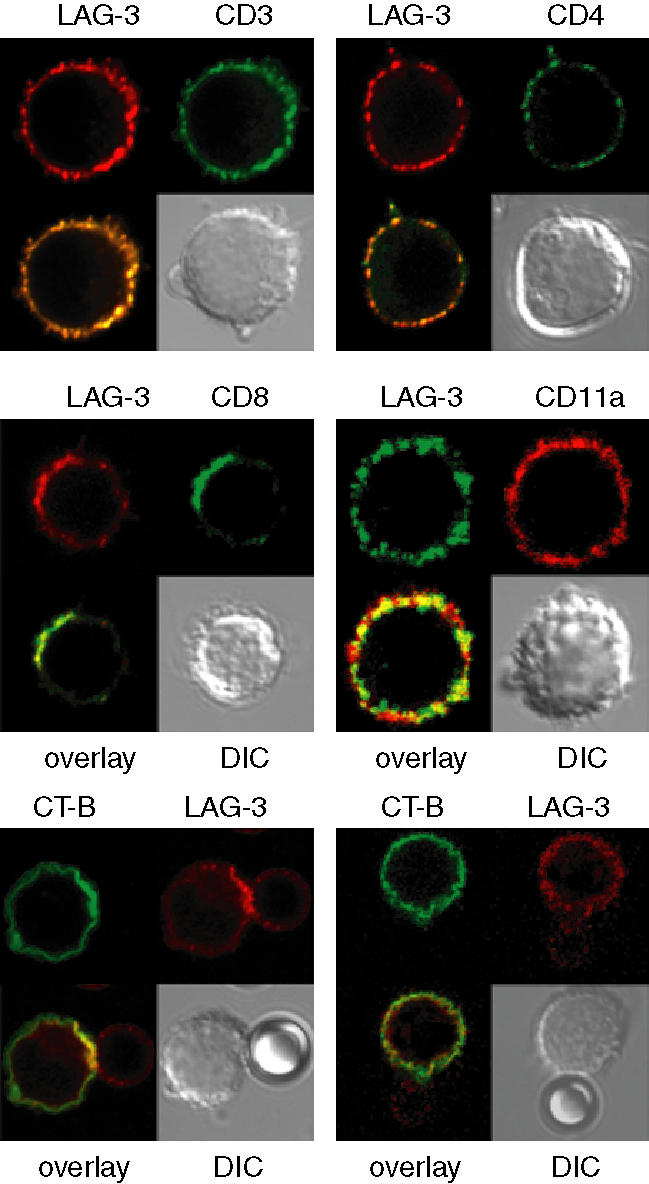
LAG-3 colocalizes in GSL complexes with CD3, CD4 or CD8, and in the IS with CD3 and GM1 after TCR engagement. (a) PRMC's stimulated for two days with SEB were labelled with LAG-3-specific mAb followed by staining with Alexa Fluor 488-goat anti-mouse IgG1 (green) or Alexa Fluor 594-GAM IgG1 (red) and with FITC-CD3-, CD4- or CD8-specific mAb. PE-CD11a-specific mAb was used as negative control. (b) LAG-3-transfected Jurkat cells were stimulated with (left) or without (right) OKT3 plus CD28 mAbs coated-beads for 30 min at 37°. Cells were then fixed and stained with FITC-CTB and LAG-3-specific mAb followed by staining with Alexa Fluor 546-GAM (red). Beads are coloured in red in the left hand panel because of the staining of CD28 mAb (IgG1) by Alexa Fluor 546-GAM. DIC, differential interferential contrast. The pictures are representative of the results obtained in three independent experiments.
By analogy with CTLA-4, which reduces the localization of lipid rafts and raft-associated signalling proteins in the IS18 we tested whether the negative regulatory role of LAG-3 that attenuates TCR signalling could be associated with an ability to inhibit raft expression on the plasma membrane, clustering of these rafts, and movement to the IS. GM1 expression at the T-cell plasma membrane was up-regulated following SEB stimulation (as determined by CTB-FITC binding and fluorescence-activated cell sorting (FACS) analysis), as described21 but was unaffected by addition of LAG-3 mAb on SEB-stimulated PBMC (data not shown). Also, intensity and number of clustered rafts in these experiments was unchanged by addition of LAG-3 mAb (not shown).
LAG-3/MHC class II interactions inhibit both CD4 and CD8 primary T-cell activation
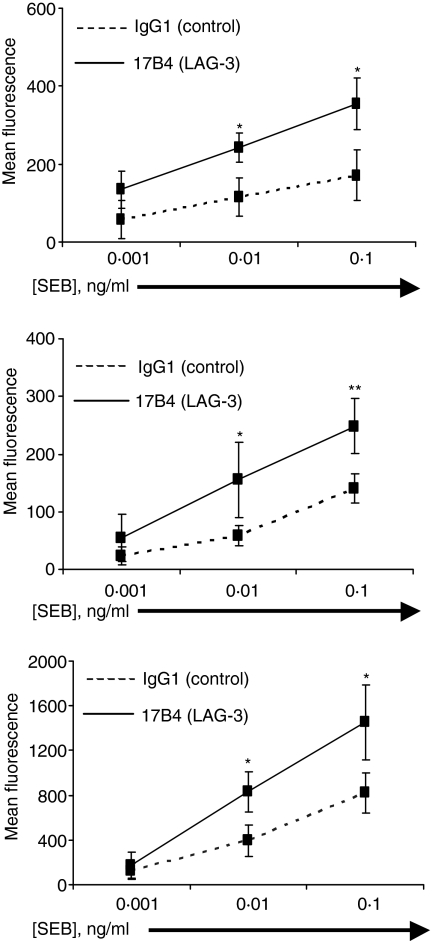
The effect of blocking LAG-3/MHC class II interactions on early events was studied in different cell subsets using CD69, an early activation-induced cell surface molecule, to follow TCR-induced cell activation. We used the 17B4 LAG-3-specific mAb that recognizes the extra-loop of the first LAG-3 immunoglobulin-like domain.6,7 This IgG1 antibody as well as the corresponding Fab fragments inhibit LAG-3/MHC class interactions and then increases T cell proliferation as LAG-3 signalling antagonists.22 17B4 mAb has no agonist activity as determined by its inability to induce intracellular free calcium elevation into T cells in the absence of a secondary cross-linking reagent (i.e. cross-linking on beads or addition of GAM).9 Fig. 2(a) shows that the addition of LAG-3-specific mAb at the initiation of T cell stimulation leads to a significant increase of CD69 expression on gated lymphocytes at day 2 of the culture when low (0·01 ng/ml) or suboptimal (0·1 ng/ml) doses of SEB are added to the culture. This increase was not due to an increased number of cells that are CD69+ as a consequence of increased cell expansion because at day 2 there was no differences between conditions in terms of total or CFSELow (see below) cell numbers. This effect was also observed when optimal concentration of SEB (10 ng/ml) was used (not shown). However, lower doses were used throughout this study since these in vitro experimental conditions were thought to be more relevant in testing whether LAG-3 may down-regulates T-cell activation in in vivo situations where in most cases limiting concentrations of antigen are available. These results indicate that blocking LAG-3/MHC class II interactions with the LAG-3-specific mAb leads to higher expression of CD69 on activated T cells.
Figure 2.
Inhibition of LAG-3/MHC class II interactions leads to increased CD69 expression in both CD4+ and CD8+ SEB-stimulated PBMC cell subsets. PBMCs were stimulated with indicated concentration of SEB for 2 days in the presence of LAG-3-specific mAb or control IgG1 mAb. PBMC were stained with PE-CD4 or PE-CD8 and FITC-CD69. CD69 expression on total PBMCs (a), CD4+ (b) or CD8+ (c) subsets of gated PBMC was determined by FACS using FITC-CD69 mAb. Results are mean of 6 experiments performed on different PBMC samples with *P < 0·05 and **P < 0·01.
Addition of LAG-3 specific mAb significantly increases the expression of CD69 on both CD4+ and CD8+ subpopulations. There was at day 2 a 77·3% and 77% CD69 expression increase in the CD4 and CD8 subsets stimulated with 0·1 ng/ml SEB, respectively (n = 6 experiments; P < 0·01 and P < 0·05, respectively). These data indicate that activation of both CD4 and CD8 subsets is subjected to a feedback type of inhibition by LAG-3/MHC class II interactions after TCR engagement.
LAG-3/MHC class II interactions inhibit CD4 and CD8 T-cell proliferation
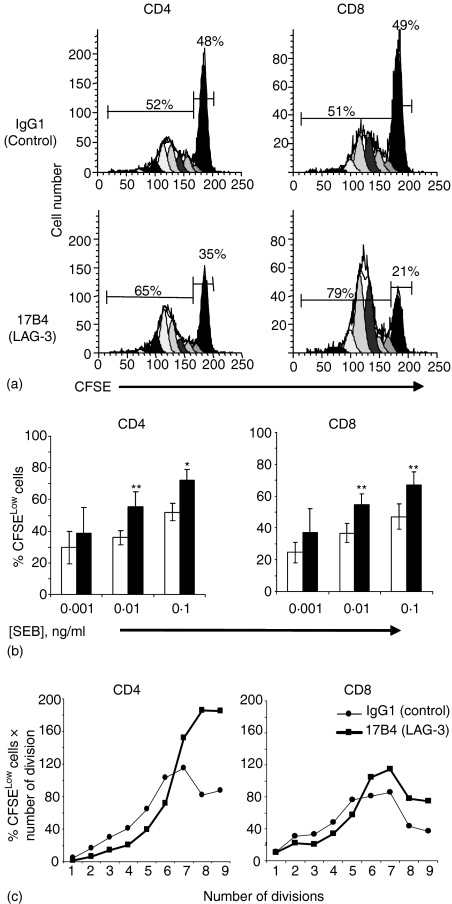
We next studied the effect of the addition of LAG-3-specific mAb to SEB-stimulated T-cell cultures to test whether the blocking of LAG-3/MHC class II interactions may influence TCR-driven cell cycle progression. Figure 3(a) shows a representative FACS analysis of CFSE-labelled CD4+ and CD8+ cells stimulated by a suboptimal dose of SEB (0·1 ng/ml) for 4 days. More cells in the dividing peaks (i.e. the CFSELow cells) were found in cultures with LAG-3-specific mAb compared to cultures with control IgG1 mAb. To compare more accurately the amount of divisions in LAG-3 treated vs. untreated cells the percentage of live CD4+ or CD8+ T cells in each division peak was summed. As shown in Fig. 3(b), there was a consistent increase in the mean of dividing cells at day 4 for the low (0·01 ng/ml) and suboptimal (0·1 ng/ml) doses of SEB in cultures with LAG-3-specific mAb, compared to the control. When PBMC were stimulated with 0·1 ng/ml SEB, the addition of LAG-3 mAb increased by 38% and 44·5% the percentage of CD4+ and CD8+ dividing cells, respectively (n = 6 experiments, P < 0·05 and P = 0·01, respectively). The number of cells in the undivided population (CFSEHigh) was reduced accordingly, meaning that more cells were recruited and induced to divide at this ‘suboptimal’ (1/100th of the optimal SEB dose) SEB concentration in the presence of the LAG-3 mAb. In addition, the distribution of the differentially shaded peaks in Fig. 3(a) is not the same between the two conditions with a slight shift to the left of the CFSELow peaks in the presence of LAG-3-specific mAb. This shift was observed in all six experiments shown in Fig. 3(b). This increase in cell cycle progression is shown for the experiment described in Fig. 3(a) by using weighted scores calculated by multiplying the ‘total percent divisions of CFSELow’ by the number of cell divisions (Fig. 3c). In the group of cells that were induced to divide in the presence of LAG-3 mAb in spite of minimal TCR engagement, there were more cells that divide six times or more in the 4 day culture period compared to the IgG1 control condition. Thus, both increased recruitment into cell division and more rounds of cell division are the hallmarks of LAG-3-deficient cells in conditions where only limited concentrations of antigen are available.
Figure 3.
Inhibition of LAG-3/MHC class II interactions increases cell division in CD4+ and CD8+ SEB-stimulated PBMC cell subsets. CFSE-labelled PBMC were cultured with 0·1 ng/ml SEB for 4 days. (a) ModFit Verity software analysis of CFSE staining in CD4+ and CD8+ SEB-stimulated PBMC subsets. (b) The ‘total percent divisions of CFSELow’, that is the sum of the percentage of CD4+ or CD8+ cells in each division peak without the parental generation, are shown for the LAG-3-specific 17B4 mAb (filled histograms) or the control IgG1 mAb (empty histograms). Results are mean of six experiments performed on different PBMC samples. *P < 0·05 and **P < 0·01. (c) The slight shift to the left of the dividing cells CFSELow peaks in (a) is shown by using weighted scores calculated by multiplying the ‘total percent divisions of CFSELow’ by the number of cell divisions.
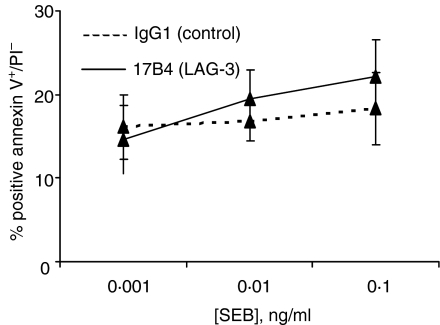
The effect of LAG-3 mAb on apoptosis and cell death was also investigated. PBMCs were stimulated as above in the presence or absence of LAG-3-specific mAb, and apoptosis was followed by annexin V and PI staining. There was no significant increase of PI–/annexin V+ cells in cultures with LAG-3-specific mAb (Fig. 4). Less than 2% of cells were PI+ with no differences between conditions (not shown). Altogether, these data show that blocking LAG-3/MHC class II interactions with a specific mAb enhanced T-cell division without increasing the number of apoptotic cells.
Figure 4.
Inhibiting LAG-3/MHC class II interactions does not induce apoptosis after SEB stimulation. PBMC were stimulated with indicated concentration of SEB for 2 days in the presence of LAG-3-specific mAb or control IgG1 mAb. FITC-annexin V+/PI– cells represent the apoptotic cell subset. Results are mean of percentage of six independent experiments.
Blocking LAG-3/MHC class II interactions inhibits cell cycle progression upon activation of resting T cells
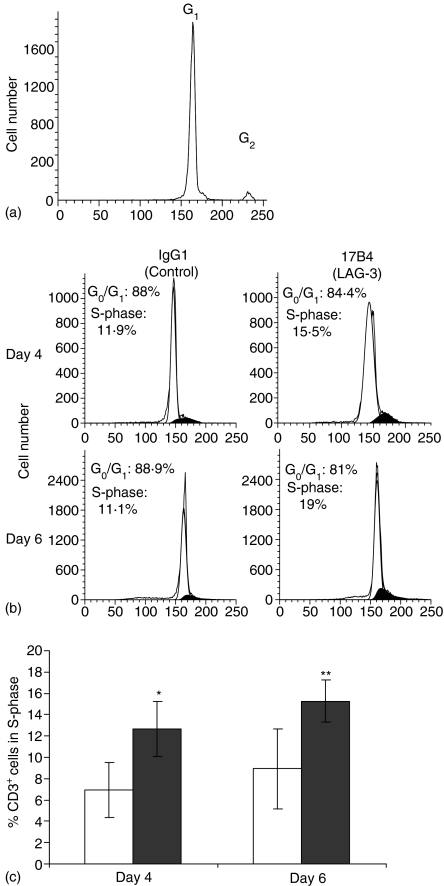
To test whether the blocking of LAG-3/MHC class II interactions may influence TCR-driven cell cycle progression, we studied cell cycle entry in CD3+ cells stimulated with 0·1 ng/ml SEB (see Fig. 5b for a representative experiment).We first determined the relative position of the G2 peak compared to the G1 peak in unstimulated cultures (no SEB) to allow the ModFit software to determine subsequently the number of cells in S-phase in SEB-stimulated cultures (Fig. 5a). At day 4 there was a 67% increase (P < 0·05) in the percentage of cells in the S-phase of the cell cycle and a 71% increase at day 6 (P < 0·01) in the presence of LAG-3 mAb, compared to the IgG1 control (Fig. 5c). These results indicate that primary resting T cells stimulated under conditions of APC-driven stimulation and low dose SEB are incited to divide more in the presence of LAG-3 mAb.
Figure 5.
Inhibiting LAG-3/MHC class II interactions increases the percentage of cells in S-phase of the cell cycle in SEB-stimulated PBMC. PBMC were cultured with or without 0·1 ng/ml SEB for 6 days and stained with FITC-CD3 mAb and PI. The ModFit Verity software was used to determine fractions of population in each phase of the cell cycle. G0/G1 (white area) and S-phases (black area). (a) Histograms of DNA content in CD3+ cells of a representative experiment used to determine the relative position of the G2 peak compared to the G1 peak in unstimulated cultures (no SEB). (b) Histograms of DNA content in CD3+ cells of a representative experiment (0·1 ng/ml SEB) (c) Percentage of CD3+ cells in the S-phase of the cell cycle following culture with LAG-3-specific 17B4 mAb (filled histograms) or control IgG1 mAb (empty histograms) Results are mean of six independent experiments. *P < 0·05 and **P < 0·01.
LAG-3/MHC class II interactions inhibit Th1 cytokine production
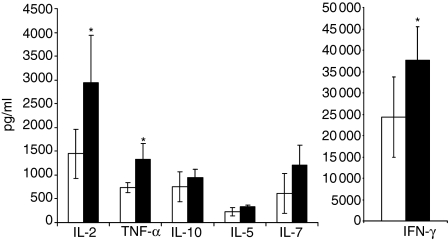
To study the effect of LAG-3/MHC class II interactions on cytokine production and on Th1 versus Th2 polarization, we used a simultaneous quantification of different Th1 and Th2 cytokines in supernatant of PBMC stimulated with 0·1 ng/ml SEB. There was a significant increase at day 1 (not shown), day 2 (Fig. 6) and day 3 (not shown) of interferon-γ, interleukin (IL)-2 and tumour necrosis factor-α production but not of IL-4, IL-5 and IL-10 in the presence of LAG-3 mAb. This increase was not due to an increased number of cells that may produce Th1 cytokines because at day 2 there were no differences between conditions in terms of total or CFSELow (only 12% of cells are CFSELow at day 2) cell numbers. Similar results were obtained with 0·01 ng/ml SEB (data not shown). These results clearly indicate that LAG-3 signalling affects the Th1 and not the Th2 differentiation pathway following TCR engagement.
Figure 6.
Inhibition of LAG-3/MHC class II interactions increases Th1, but not Th2, cytokine production. PBMC were cultured with 0·1 ng/ml of SEB and with LAG-3-specific 17B4 mAb (filled histograms) or control IgG1 mAb (empty histograms). At 48 hr, supernatants were collected and cytokine assays were performed using microparticle-based flow cytometry analysis. Results are mean of six experiments performed on different PBMC samples. *P < 0·05.
Discussion
LAG-3 has been shown to be present in a cell fraction enriched in GSL complexes before their clustering by CD3/TCR complex cross-linking.20 This low-density fraction was isolated at the interface between the 35% and the 5% fractions of a discontinuous sucrose gradient and addition of 0·2% saponin (i.e. cholesterol depletion leading to raft disruption) to 1% Triton-X-100 abolished the detection by Western blotting of LAG-3 in this cell fraction.20 Micron-scale collections of raft domains are established in cells by an actin/tubulin-dependent process and these regions correspond to large areas in which lipids become more resistant to extraction by cold Triton-X-100. Despite the usefulness of non-ionic detergent extraction, this method of low density floating during sucrose gradient centrifugation is not without pitfalls. A raft protein can be connected to the cytoskeleton and will not float after detergent extraction; also, its association with rafts can be so weak that it is solubilized by the detergent. Here, we confirm the presence of LAG-3 in clustered rafts induced following TCR signalling.
Protein reorganization at the surface of a T-cell and an APC plays an important role in T-cell activation. Previous studies have shown that MHC class II-peptides complexes are incorporated on the surface of APC in a preorganized rather than a randomly distributed configuration in the absence of T cells, with two types of MHC class II-enriched membrane microdomains: (i) the GSL complexes or lipid rafts; and (ii) tetraspan protein microdomains (for review see 23). Both these domains have recently been shown to be preferentially recognized on the surface of live human DC by a soluble LAG-3 (sLAG-3) protein.24 The present results showing the polarization of LAG-3 in clustered regions under conditions of APC-driven stimulation using low doses of SEB further support the view that LAG-3/MHC class II interactions are involved in the manner APC and T cells form heterotypic junctions with the aim of evoking specific T-cell responses. With antibody-coated beads, we also induced the cytoskeleton-driven clustering of these microdomains, such as the ones observed when a 1–4 µm synapse is formed between an APC and a T cell and showed the polarization of LAG-3 into these clustered microdomains. Large-sized arrays of surface MHC class II on APC and of LAG-3 on T cells may actively contribute to enhance the already high avidity LAG-3/MHC class II interactions (a Kd of 60 nm for LAG-3Ig at 37° on Daudi B cells,25) and then contribute to induction and maintenance of the IS. Overall, the integrity and dynamics of these microdomains at the heterotypic junctions between APC and T cells that control the final outcome of LAG-3/MHC class II interactions are candidate determinants favouring activation (through MHC class II signalling and APC activation)8,26 or silencing (through LAG-3 signalling) of T cells.
When recognition of the MHC class II-peptide complex by a specific TCR occurs, intracellular signals are transduced in the T cell through the TCR and in the APC through MHC class II molecules. The question of how signalling through MHC class II is achieved in APC following their engagement by sLAG-3 has been recently documented.24,26 Here we report that the negative regulatory role of LAG-3 signalling into T cells9,11,12,15 operates in primary CD4 and CD8 human T-cell responses. The effect of the LAG-3-specific mAb in our assays is rather a result of a direct blocking effect of LAG-3 signalling into LAG-3+ effector cells than to an indirect mechanism through the inhibition of the LAG-3+ Treg subset function.14 In the latter case, it has been shown than blocking LAG-3/MHC class II interactions does lead to clear-cut inhibition of Treg cell function only when using high concentrations of antigen.14 Treg cells could utilize multiple molecules to mediate suppression and then could conformably control T-cell expansion at low concentrations of antigen (or SEB as in our bioassays) in the absence of LAG-3 signalling. Note that we didn't observe any down-regulation of IL-10 secretion following addition of LAG-3-specific mAb (Fig. 6 and unpublished results), again raising doubts about the possibility of an indirect mechanism through inhibition of Treg suppressor activity in our in vitro system using low dose SEB.
In contrast to murine T cells12 SEB stimulation in the absence of LAG-3/class II interactions did not lead to defective cell expansion associated with increased cell death in vitro. To the contrary, we observed increased T-cell expansion and accumulation of cells in the S-phase of the cell cycle. These results may not be discrepant because for both species T cells appeared to be hyperactivated in the absence of LAG-3 signalling as assessed by enhanced cytokine secretion.12 Thus, reduced cell expansion and increased cell death in the murine system may be caused by differences in cytokine starvation and/or antigen-induced cell death between murine and human cells in vitro. In any case, the LAG-3 attenuation of T-cell expansion model discussed here implies that cells expressing LAG-3 are arrested in low division states, whereas LAG-3-deficient cells proceed through more rounds of division. Blocking CTLA-4 or LAG-3 signalling leads in both cases to more cells continuing to progress through the cell cycle and thus, exhibiting higher numbers of cells in the S-phase of the cell cycle27 (and Fig. 5). The pathways which influence the cell cycle following engagement of these two T-cell activation antigen receptors may regulate the induction and/or progression of autoimmune disease.
LAG-3 has now been shown to have a important role for homeostatic lymphocyte expansion.13 In the present study, we show that specific inhibition of Th1 cytokine production (e.g. IL-2) is induced by LAG-3 in vitro. Thus, the blockade of LAG-3/MHC class II interactions with specific mAb in vivo could lead to increased numbers of CD4+ and CD8+ cells in the memory T-cell pool, in line with the mouse data.13 Accordingly, we propose that LAG-3-specific mAb given intravenously could be used in therapeutic vaccination protocols to increase the memory pools as an adjunct to the vaccine procedure itself, either by acting directly at the effector cell level9,12,15 or indirectly by inhibiting LAG-3+ Treg subpopulations.14
Acknowledgments
We wish to thank V. Nicolas for her technical assistance with regard to confocal microscopy.
References
- 1.Viola A, Schroeder S, Sakakibara Y, Lanzavecchia A. T lymphocyte costimulation mediated by reorganization of membrane microdomains. Science. 1999;283:680–2. doi: 10.1126/science.283.5402.680. [DOI] [PubMed] [Google Scholar]
- 2.Xavier R, Brennan T, Li Q, McCormack C, Seed B. Membrane compartmentation is required for efficient T cell activation. Immunity. 1998;8:723–32. doi: 10.1016/s1074-7613(00)80577-4. [DOI] [PubMed] [Google Scholar]
- 3.Bi K, Tanaka Y, Coudronniere N, Sugie K, Hong S, van Stipdonk MJ, Altman A. Antigen-induced translocation of PKC-theta to membrane rafts is required for T cell activation. Nat Immunol. 2001;2:556–63. doi: 10.1038/88765. [DOI] [PubMed] [Google Scholar]
- 4.Darlington P, Baroja M, Chau T, Siu E, Ling V, Carreno B, Madrenas J. Surface cytotoxic T lymphocyte-associated antigen 4 partition within lipid rafts and relocates to the immunological synapse under conditions of inhibition of T cell activation. J Exp Med. 2002;195:1337–47. doi: 10.1084/jem.20011868. [DOI] [PMC free article] [PubMed] [Google Scholar]
- 5.Triebel F, Jitsukawa S, Baixeras E, Roman-Roman S, Genevée C, Viegas-Pequignot E, Hercend T. LAG-3, a novel lymphocyte activation gene closely related to CD4. J Exp Med. 1990;171:1393–405. doi: 10.1084/jem.171.5.1393. [DOI] [PMC free article] [PubMed] [Google Scholar]
- 6.Baixeras E, Huard B, Miossec C, et al. Characterization of the lymphocyte activation gene 3-encoded protein. A new ligand for human leukocyte antigen class II antigens. J Exp Med. 1992;176:327–37. doi: 10.1084/jem.176.2.327. [DOI] [PMC free article] [PubMed] [Google Scholar]
- 7.Huard B, Mastrangeli R, Prigent P, et al. Characterization of the major histocompatibility complex class II binding site on LAG-3 protein. Proc Natl Acad Sci USA. 1997;94:5744–9. doi: 10.1073/pnas.94.11.5744. [DOI] [PMC free article] [PubMed] [Google Scholar]
- 8.Triebel F. LAG-3. a regulator of T-cell and DC responses and its use in therapeutic vaccination. Trends Immunol. 2003;24:619–22. doi: 10.1016/j.it.2003.10.001. [DOI] [PubMed] [Google Scholar]
- 9.Hannier S, Tournier M, Bismuth G, Triebel F. CD3/TCR complex-associated LAG-3 molecules inhibit CD3/TCR signaling. J Immunol. 1998;161:4058–65. [PubMed] [Google Scholar]
- 10.Hannier S, Triebel F. The MHC class II ligand LAG-3 is co-distributed with CD8 and CD3/TCR molecules after their engagement by mAbs or peptide/MHC class I complexes. Int Immunol. 1999;11:1745–52. doi: 10.1093/intimm/11.11.1745. [DOI] [PubMed] [Google Scholar]
- 11.Workman CJ, Dugger KJ, Vignali DAA. Molecular analysis of the negative regulatory function of lymphocyte activation gene-3. J Immunol. 2002;169:5392–5. doi: 10.4049/jimmunol.169.10.5392. [DOI] [PubMed] [Google Scholar]
- 12.Workman CJ, Vignali DA. The CD4-related molecule, LAG-3 (CD223), regulates the expansion of activated T cells. Eur J Immunol. 2003;33:970–9. doi: 10.1002/eji.200323382. [DOI] [PubMed] [Google Scholar]
- 13.Workman CJ, Cauley LS, Kim IJ, Blackman MA, Woodland DL, Vignali DA. Lymphocyte activation gene-3 (CD223) regulates the size of the expanding T cell population following antigen activation in vivo. J Immunol. 2004;172:5450–5. doi: 10.4049/jimmunol.172.9.5450. [DOI] [PubMed] [Google Scholar]
- 14.Huang CT, Workman CJ, Flies D, et al. Role of LAG-3 in regulatory T cells. Immunity. 2004;21:503–13. doi: 10.1016/j.immuni.2004.08.010. [DOI] [PubMed] [Google Scholar]
- 15.Huard B, Tournier M, Hercend T, Triebel F, Faure F. Lymphocyte-activation gene 3/major histocompatibility complex class II interaction modulates the antigenic response of CD4+ T lymphocytes. Eur J Immunol. 1994;24:3216–21. doi: 10.1002/eji.1830241246. [DOI] [PubMed] [Google Scholar]
- 16.Walunas TL, Lenschow DJ, Bakker CY, et al. CTLA-4 can function as a negative regulator of T cell activation. Immunity. 1994;1:405–13. doi: 10.1016/1074-7613(94)90071-x. [DOI] [PubMed] [Google Scholar]
- 17.Krummel MF, Allison JP. CTLA-4 engagement inhibits IL-2 accumulation and cell cycle progression upon activation of resting T cells. J Exp Med. 1996;183:2533–40. doi: 10.1084/jem.183.6.2533. [DOI] [PMC free article] [PubMed] [Google Scholar]
- 18.Martin M, Schneider H, Azouz A, Rudd CE. Cytotoxic T lymphocyte antigen 4 and CD28 modulate cell surface raft expression in their regulation of T cell function. J Exp Med. 2001;194:1675–81. doi: 10.1084/jem.194.11.1675. [DOI] [PMC free article] [PubMed] [Google Scholar]
- 19.Egen JG, Kuhns MS, Allison JP. CTLA-4: new insights into its biological function and use in tumor immunotherapy. Nat Immunol. 2002;3:611–8. doi: 10.1038/ni0702-611. [DOI] [PubMed] [Google Scholar]
- 20.Iouzalen N, Andreae S, Hannier S, Triebel F. LAP, a lymphocyte activation gene-3 (LAG-3)-LAP, a lymphocyte activation gene-3 (LAG-3)-associated protein that binds to a repeated EP motif in the intracellular region of LAG-3, may participate in the down-regulation of the CD3/TCR activation pathway. Eur J Immunol. 2001;31:2885–91. doi: 10.1002/1521-4141(2001010)31:10<2885::aid-immu2885>3.0.co;2-2. [DOI] [PubMed] [Google Scholar]
- 21.Tuosto L, Parolini I, Schroder S, Sargiacomo M, Lanzavecchia A, Viola A. Organization of plasma membrane functional rafts upon T cell activation. Eur J Immunol. 2001;31:345–9. doi: 10.1002/1521-4141(200102)31:2<345::aid-immu345>3.0.co;2-l. [DOI] [PubMed] [Google Scholar]
- 22.Huard B, Prigent P, Pages F, Bruniquel D, Triebel F. T cell MHC class II molecules downregulate CD4+ T cell clone response following LAG-3 binding. Eur J Immunol. 1996;26:1180–6. doi: 10.1002/eji.1830260533. [DOI] [PubMed] [Google Scholar]
- 23.Vogt AB, Spindeldreher S, Kropshofer H. Clustering of MHC-peptide complexes prior to their engagement in the immunological synapse: lipid raft and tetraspan microdomains. Immunol Rev. 2002;189:136–51. doi: 10.1034/j.1600-065x.2002.18912.x. [DOI] [PubMed] [Google Scholar]
- 24.Andreae S, Buisson S, Triebel F. MHC class II signal transduction in human dendritic cells induced by a natural ligand, the LAG-3 protein (CD223) Blood. 2003;102:2130–7. doi: 10.1182/blood-2003-01-0273. [DOI] [PubMed] [Google Scholar]
- 25.Huard B, Prigent P, Tournier M, Bruniquel D, Triebel F. CD4/major histocompatibility complex class II interaction analyzed with CD4- and lymphocyte activation gene-3 (LAG-3)-Ig fusion proteins. Eur J Immunol. 1995;25:2718–21. doi: 10.1002/eji.1830250949. [DOI] [PubMed] [Google Scholar]
- 26.Andreae S, Piras F, Burdin N, Triebel F. Maturation and activation of dendritic cells induced by lymphocyte activation gene-3 (CD223) J Immunol. 2002;168:3874–80. doi: 10.4049/jimmunol.168.8.3874. [DOI] [PubMed] [Google Scholar]
- 27.Greenwald RJ, Oosterwegel MA, van der Woude D, Kubal A, Mandelbrot DA, Boussiotis VA, Sharpe AH. CTLA-4 regulates cell cycle progression during a primary immune response. Eur J Immunol. 2002;32:366–73. doi: 10.1002/1521-4141(200202)32:2<366::AID-IMMU366>3.0.CO;2-5. [DOI] [PubMed] [Google Scholar]


