Abstract
Histone deacetylases (HDACs) are key regulators of gene expression that require assembly into larger protein complexes for activity. Efforts to understand how associated proteins modulate the function of HDACs would benefit from new technologies that evaluate HDAC activity in native biological systems. Here, we describe an active site-directed chemical probe for profiling HDACs in native proteomes and live cells. This probe, designated SAHA-BPyne, contains structural elements of the general HDAC inhibitor suberoylanilide hydroxamic acid (SAHA), as well as benzophenone and alkyne moieties to effect covalent modification and enrichment of HDACs, respectively. Both class I and II HDACs were identified as specific targets of SAHA-BPyne in proteomes. Interestingly, multiple HDAC-associated proteins were also enriched by SAHA-BPyne, even after denaturation of probe-labeled proteomes. These data indicate that certain HDAC-associated proteins are directly modified by SAHA-BPyne, placing them in close proximity to HDAC active sites where they would be primed to regulate substrate recognition and activity. We further show that SAHA-BPyne can be used to measure differences in HDAC content and complex assembly in human disease models. This chemical proteomics probe should thus prove valuable for profiling both the activity state of HDACs and the binding proteins that regulate their function.
Keywords: cancer
The reversible acetylation of lysine residues in histone tails plays a critical role in transcriptional activation and repression (1, 2). Acetylation and deacetylation are catalyzed by histone acetyltransferases (HATs) and histone deacetylases (HDACs), respectively. Increased HDAC activity has generally been associated with transcriptional repression, whereas increased HAT activity (or HDAC inhibition) facilitates gene expression (1, 2). There are ≈20 human HDACs that fall into three classes based on homology to yeast models; classes I and II are zinc-dependent metallohydrolases (3), whereas class III HDACs are NAD+-dependent deacetylases (4). Treatment of tumor cells with general inhibitors of class I/II HDACs results in growth arrest, differentiation, and apoptosis (1–6), promoting these enzymes as potential cancer drug targets (7).
Most HDACs are found in cells as parts of large multisubunit complexes such as the nucleosome remodeling and deacetylating (NURD), CoREST, and mSin3 complexes (8–10). Participation in these complexes appears to be required for HDAC activity, as isolated enzymes are not generally capable of efficiently deacetylating lysines (11). The specific components of HDAC complexes influence substrate selection and, consequently, HDAC-mediated gene regulation (12, 13). Despite the importance of protein–protein interactions for HDAC activity, little is known about how this regulatory effect is exerted at a molecular level. Such studies are complicated by the difficulties in reconstituting HDAC activity in purified, recombinant systems (14). New methods are thus needed to monitor the functional state of HDAC complexes in native biological systems. We set out to address this problem by developing an active-site-directed chemical probe for profiling HDAC activities in proteomes.
Results
Design of an Activity-Based Proteomic Probe for Class I/II HDACs.
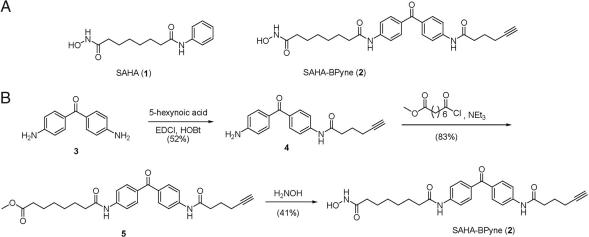
An HDAC-directed probe was designed based on the scaffold of the general class I/II HDAC inhibitor suberoylanilide hydroxamic acid (SAHA) (3) (1, Fig. 1A). SAHA is a reversible HDAC inhibitor that chelates to the Zn2+ cation in HDAC active sites (15) to provide high nM-low μM inhibition (16). To convert SAHA into an irreversible probe compatible with activity-based protein profiling [ABPP (17, 18)] experiments, we modified the inhibitor's structure to include a benzophenone (BP), which can be photoactivated to promote covalent labeling of proximal proteins. A phenyl azide photoaffinity derivative of SAHA has been reported (19), but this reagent was only synthesized in tritiated form, which requires long exposure times for the detection of cross-linked proteins and does not offer a handle for their enrichment and identification. To address these problems, we also appended an alkyne group onto our HDAC-directed probe to facilitate click chemistry-mediated conjugation of reporter tags for the rapid and sensitive detection (rhodamine) and affinity enrichment (biotin) of labeled proteins (20, 21). The resulting HDAC-directed probe, prepared in three steps from commercially available materials, was termed SAHA-BPyne (Fig. 1).
Fig. 1.
Design and synthesis of the HDAC activity-based probe SAHA-BPyne. (A) Structures of the general HDAC inhibitor SAHA and SAHA-BPyne. (B) Synthetic scheme for preparation of SAHA-BPyne.
Analysis of the Proteome-Wide Reactivity Profiles of SAHA-BPyne.
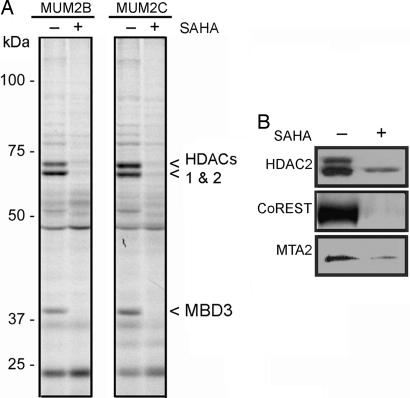
Given that mammalian HDAC enzymes are not, in general, active as purified, recombinant proteins (11, 14), initial screens with SAHA-BPyne were performed in native cell proteomes. SAHA-BPyne (100 nM) was added either alone, or in the presence of excess SAHA (10 μM), to soluble proteomes prepared from the aggressive and nonaggressive human melanoma cell lines MUM2B and MUM2C, respectively. Samples were then photoactivated with UV light, treated with rhodamine-azide under click chemistry conditions (20, 21), and analyzed by SDS/PAGE coupled with in-gel fluorescence scanning. Multiple SAHA-competed targets of SAHA-BPyne were detected in cancer cell proteomes, including proteins in the predicted molecular mass range of HDACs (50–60 kDa), as well as an additional protein of lower mass (≈38 kDa) (Fig. 2A). Similar profiles were generated with cancer lines from other tissues of origin, including breast and ovary [supporting information (SI) Fig. 6]. The signal intensity for each probe-labeled protein was enriched in nuclear preparations from cancer cells (SI Fig. 7) and also competed by a second HDAC inhibitor trichostatin A (SI Fig. 7), providing further evidence that SAHA-BPyne targeted functional HDAC complexes.
Fig. 2.
ABPP of melanoma cell proteomes with the SAHA-BPyne probe. (A) Soluble proteomes from the melanoma lines MUM2B and MUM2C were incubated with 100 nM SAHA-BPyne probe in the presence or absence of excess SAHA (10 μM) as a competitor. Probe targets were detected by UV-irradiation, followed by click chemistry with a rhodamine-azide tag, SDS/PAGE analysis, and in-gel fluorescence scanning (fluorescent gel shown in grayscale). Multiple SAHA-sensitive targets were detected (arrows). These proteins were identified as HDACs 1 and 2 (60-kDa doublet) and MBD3 (38-kDa band). (B) Confirmation that SAHA-BPyne targets both HDACs (HDAC2) and HDAC-associated (CoREST, MTA2) proteins. Shown are Western blots of proteins enriched from melanoma proteomes by treatment with SAHA-BPyne (or SAHA-BPyne plus excess SAHA), click conjugation to biotin-azide, and enrichment on avidin beads.
To more comprehensively inventory the specific targets of SAHA-BPyne, we reacted probe-treated cancer cell proteomes with an azide-biotin tag and analyzed the samples using a liquid chromatography-mass spectrometry (LC-MS) platform termed ABPP-multidimensional protein identification technology (ABPP-MudPIT) (22, 23). In ABPP-MudPIT, probe-labeled proteins are enriched by binding to avidin-conjugated beads, subjected to on-bead trypsin digestion, and identified by multidimensional LC separation and MS–MS analysis. ABPP-MudPIT exhibits superior resolution and sensitivity compared with gel-based methods, facilitating the identification of lower-abundance targets of chemical probes in proteomes (22, 23). Multiple control samples were also analyzed, including proteomes treated with SAHA-BPyne in the presence of excess SAHA competitor, proteomes treated with a set of structurally distinct hydroxamate probes that target metalloproteases (MPs) (23), and proteomes to which no probe was added. Specific targets of SAHA-BPyne were identified by filtering the data for proteins that had: (i) an average of at least four spectral counts in SAHA-BPyne-treated samples, and (ii) at least a 2-fold increase in average spectral counts in SAHA-BPyne-treated versus control samples. Proteins were classified as specific targets if they met these criteria and were significantly enriched (P < 0.01) in SAHA-BPyne-treated proteomes relative to control reactions.
Multiple HDAC enzymes were identified as specific targets of SAHA-BPyne, including HDAC1, HDAC2, and HDAC6 (Table 1). Interestingly, several additional non-HDAC proteins were also enriched in SAHA-BPyne-treated proteomes relative to control samples, including CoREST, p66β, methyl CpG binding protein 3 (MBD3), and the metastasis-associated proteins MTA1 and MTA2. Literature searches revealed that these proteins all represent components of endogenous HDAC complexes (8–10). Western blotting confirmed the enrichment of representative HDAC (HDAC2) and HDAC-associated proteins (MTA2 and CoREST) in SAHA-BPyne-labeled proteomes compared with control samples (Fig. 2B).
Table 1.
Proteins specifically labeled by SAHA-BPyne in melanoma cell lines
| Cell line | Protein | IPI number | Average spectral counts |
SAHA-BPyne/SA HA control | |||
|---|---|---|---|---|---|---|---|
| SAHA-BPyne | SAHA control | No probe control | MP control | ||||
| MUM2B | HDAC1 | IPI00013774 | 18 ± 2 | 0.5 ± 0.5 | 1 ± 1 | 3 ± 1 | 36 |
| HDAC2 | IPI00289601 | 21 ± 2 | 5 ± 2 | 5 ± 2 | 5 ± 2 | 5 | |
| CoREST protein | IPI00008531 | 6.5 ± 0.9 | 0 ± 0 | 0 ± 0 | 0 ± 0 | — | |
| Methyl-CpG binding protein 3 | IPI00439194 | 19 ± 3 | 0 ± 0 | 0 ± 0 | 0 ± 0 | — | |
| MTA1 | IPI00012773 | 6 ± 1 | 2.2 ± 0.9 | 0 ± 0 | 1 ± 1 | 3 | |
| MTA2 | IPI00171798 | 8 ± 2 | 1 ± 1 | 0 ± 0 | 0 ± 0 | 6 | |
| p66β* | IPI00103554 | 2.8 ± 0.9 | 0 ± 0 | 0 ± 0 | 0 ± 0 | — | |
| MUM2C† | HDAC1 | IPI00013774 | 20 ± 2 | 2 ± 1 | 0 ± 0 | 1 ± 1 | 10 |
| HDAC2 | IPI00289601 | 23 ± 2 | 3.3 ± 0.9 | 2 ± 2 | 1 ± 1 | 7 | |
| HDAC6 | IPI00005711 | 5 ± 1 | 0 ± 0 | 0 ± 0 | 0 ± 0 | — | |
| Methyl-CpG binding protein 3 | IPI00439194 | 21 ± 3 | 1 ± 1 | 0 ± 0 | 0 ± 0 | 21 | |
| MTA1 | IPI00012773 | 7.8 ± 0.6 | 3 ± 0 | 3 ± 0 | 0 ± 0 | 3 | |
| MTA2 | IPI00171798 | 10 ± 1 | 1 ± 1 | 0 ± 0 | 0 ± 0 | 10 | |
| p66β | IPI00103554 | 6 ± 1 | 0.7 ± 0.7 | 0 ± 0 | 0 ± 0 | 8 | |
Average spectral counts ± SEM for specifically labeled proteins (as defined in the text). For results from individual runs, see SI Table 2.
*p66β meets the criteria for specifically labeled proteins only for the MUM2C data set; values for MUM2B are given for comparison.
†One additional protein, translin, was observed as a putatively specific target in the MUM2C data set; however, spectral counts for this protein in the MUM2B data set were equivalent between SAHA-BPyne and control runs, suggesting that it is likely a nonspecific target.
Considering that probe-treated proteomes are subjected to harsh protein-denaturing conditions during the ABPP-MudPIT protocol, including exposure to boiling 0.2% SDS and 6 M urea, these results indicated that SAHA-BPyne was capable of covalently labeling not only HDACs, but also HDAC-associated proteins. To provide further evidence that SAHA-BPyne covalently modified HDAC-associated proteins, we pursued the identification of the ≈38-kDa target of this probe (originally detected by gel-based ABPP, Fig. 2A), as this protein's molecular mass was distinct from any of the HDACs observed by ABPP-MudPIT. This protein was enriched by avidin chromatography, separated by SDS/PAGE, subjected to in-gel trypsin digestion, and analyzed by LC-MS/MS, resulting in its identification as the HDAC-associated protein MBD3. By this same method, the SAHA-BPyne targets at ≈60 kDa were identified as HDACs 1 and 2 (Fig. 2A).
Comparative Analysis of Cancer Cell Proteomes with SAHA-BPyne.
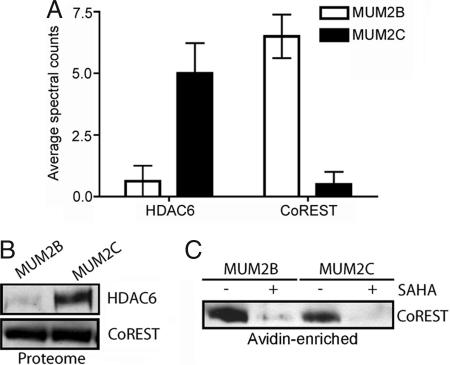
Most of the protein targets of SAHA-BPyne identified by ABPP-MudPIT were found at similar levels in aggressive (MUM2B) and nonaggressive (MUM2C) melanoma cells (Table 1). No differences were observed between the two cell lines for HDACs1 and 2, or the associated proteins MBD3, MTA1, MTA2, and p66β (Table 1 and SI Tables 2 and 3). In contrast, both HDAC6 and CoREST were significantly altered, being elevated in MUM2C and MUM2B cells, respectively (Fig. 3A). Western blotting confirmed the elevated expression of HDAC6 in MUM2C cells (Fig. 3B). In contrast, equivalent levels of CoREST were observed in soluble proteomes of MUM2B and MUM2C (Fig. 3B), suggesting that the different levels of this protein observed by ABPP-MudPIT may reflect an alteration in HDAC complexes from these cells. Consistent with this premise, Western blotting identified ≈2- to 3-fold greater CoREST signals in avidin-enriched samples from SAHA-BPyne-treated MUM2B versus MUM2C proteomes (Fig. 3C). These results indicate that ABPP experiments using SAHA-BPyne can accurately measure differences in both HDAC content and complex assembly in native proteomes.
Fig. 3.
Alterations in HDACs and HDAC complexes between aggressive and nonaggressive melanoma lines. (A) ABPP-MudPIT with SAHA-BPyne identified lower and higher levels of HDAC6 and CoREST, respectively, in the aggressive melanoma line MUM2B compared with the less aggressive MUM2C line. P < 0.01, for levels of proteins between MUM2B and MUM2C cells. (B) Western blotting of soluble proteomes from melanoma cells confirmed that HDAC6 is more highly expressed in MUM2C cells (Upper). In contrast, equivalent levels of CoREST were observed in MUM2B and MUM2C soluble proteomes (Lower). (C) Western blotting analysis of avidin-enriched MUM2B and MUM2C proteomes treated with SAHA-BPyne revealed stronger CoREST signals in the former samples, indicating higher levels of CoREST in HDAC complexes from MUM2B cells.
To further investigate HDAC complexes in cancer, we analyzed the SAHA-BPyne labeling profiles of the ovarian cancer lines SKOV3 and OVCAR3 by ABPP-MUDPIT. Similar levels of HDACs 1 and 2 were observed in ovarian lines compared with melanoma lines; in contrast, the levels of MBD3 were markedly lower (3- to 4-fold) in the former lines (SI Tables 2–4). Additionally, although OVCAR3 and SKOV3 shared the high HDAC6/low CoREST signature of MUM2C cells, they were distinguishable by higher HDAC3 signals (2- to 3-fold). These results indicate that there is diversity in both HDACs and their associated proteins in different forms of cancer.
Profiling HDAC Complexes in Living Cells with SAHA-BPyne.
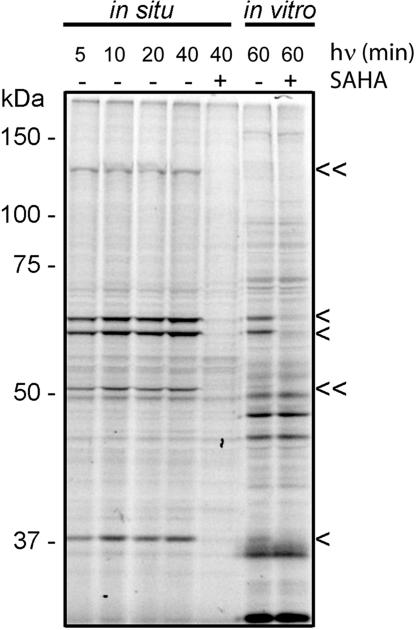
HDAC complexes are likely regulated by many posttranslational mechanisms in vivo (2), only a subset of which may be preserved in cell extracts. We therefore tested whether SAHA-BPyne could profile the composition and activity state of HDAC complexes in living cells. SAHA-BPyne (500 nM) was added either alone, or in the presence of excess SAHA (10 μM), to cultured preparations of the human breast cancer line MDA-MB-231. The cells were then irradiated with UV light, washed (to remove excess probe), and homogenized. Treatment of the whole cell lysates with rhodamine-azide under click chemistry conditions and analysis by SDS/PAGE coupled with in-gel fluorescence scanning revealed SAHA-sensitive targets similar to those observed in the corresponding in vitro proteomic analysis (Fig. 4). SAHA-sensitive signals corresponding to HDAC1, HDAC2, and MBD3 were visible within 5 min of UV light exposure (Fig. 4, single arrowheads). Interestingly, multiple SAHA-sensitive targets showed stronger signals in in situ compared with in vitro labeling experiments (Fig. 4, double arrowheads), possibly reflecting superior preservation of certain HDAC activities and/or complexes in living cells. Similar results were observed with other cancer lines (data not shown). These data show that SAHA-BPyne can be used to profile the functional state (and inhibitor sensitivity) of HDAC complexes directly in living cells.
Fig. 4.
Profiling HDAC complexes in living cancer cells with SAHA-BPyne. Cultured preparations of MDA-MB-231 cells were treated with 500 nM SAHA-BPyne probe in the presence or absence of excess SAHA (10 μM) and irradiated with UV light for various times. Cells were washed, scraped, and homogenized, followed by click chemistry with a rhodamine-azide tag, SDS/PAGE analysis, and in-gel fluorescence scanning (fluorescent gel shown in grayscale). Multiple SAHA-sensitive targets were detected, including those previously identified in in vitro preparations as HDAC1, HDAC2, and MBD3 (single arrowheads) and those that are more strongly labeled in living cells (double arrowheads). Labeling of the corresponding in vitro proteomic preparations of MDA-MB-231 cells is shown for reference.
Discussion
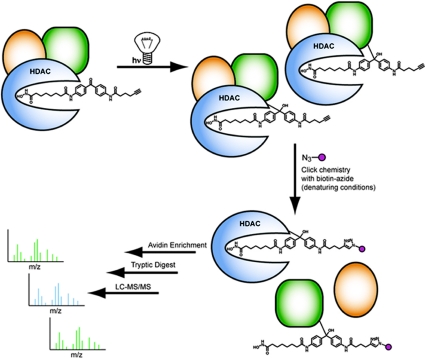
We have described herein the synthesis and biological application of an activity-based probe for profiling HDAC complexes in native proteomes. This probe, SAHA-BPyne, specifically targeted multiple HDACs from both classes I and II, as well as several HDAC-associated proteins. All of these proteins were detected in probe-treated proteomes subjected to harsh denaturing conditions that would be expected to disrupt noncovalent protein-protein interactions. We interpret these findings to indicate that SAHA-BPyne, once bound to HDACs, can interact with and cross-link to not only HDACs themselves, but also to those proteins in histone-remodeling complexes that are in close proximity to HDAC active sites (Fig. 5). This promiscuity can potentially be explained by examining the crystal structure of SAHA bound to an HDAC homologue from the thermophilic bacteria Aquifex aeolicus (15). In this structure, the phenyl ring of SAHA rests on the lip of the substrate pocket, indicating that the corresponding benzophenone unit of SAHA-BPyne would likely reside on the outer rim of the HDAC active site and be exposed to the local external microenvironment, where interactions could occur with neighboring proteins. Thus, our findings lead to a model where certain HDAC-associated proteins bind remarkably close to the HDAC active site, which could potentially explain their strong influence on substrate recognition and catalysis. Conversely, we hypothesize that those protein constituents of HDAC complexes that were not identified as targets of SAHA-BPyne in this study, such as RbAp46 and RbAp48 (10), might be located more distally from HDAC active sites. High-resolution structural information on HDAC complexes will likely be required to confirm these ideas.
Fig. 5.
Model for SAHA-BPyne labeling of HDACs and HDAC-associated proteins. Incubation of proteomes with SAHA-BPyne results in selective binding to HDACs, which exist as parts of large multiprotein complexes. The BP group of SAHA-BPyne rests on the outer rim of HDAC active sites, resulting in UV light-induced photocross-linking to both HDACs and proximally associated proteins (green). More distally associated proteins (yellow) do not react with the probe. Proteome denaturation and click chemistry with a biotin-azide tag enables identification of SAHA-BPyne-labeled proteins by ABPP-MudPIT methods (sequential avidin enrichment, on-bead trypsin digestion, and shotgun LC-MS/MS analysis).
A comparison of aggressive and nonaggressive melanoma lines treated with SAHA-BPyne identified targets of this probe that differed between these cells. Western blotting confirmed these data, indicating that the differences were, in one case, reflected in total cellular expression (HDAC6), whereas, in the other case (CoREST), apparently specific to HDAC complexes themselves. Differences in HDAC complexes were also observed between cancer cells of different origins, as melanoma cells displayed significantly greater signals for MBD3 compared with ovarian cancer cells. Although the precise functional role that HDACs (and HDAC-associated proteins) play in cancer remains poorly understood, these data suggest that differences in the composition and activity of HDAC complexes do exist between cancer cells with distinct biological properties. Recent studies have shown that the organization of HDAC complexes is altered by other pathological processes, such as viral infection (24). HDAC complex formation is also dynamically regulated by posttranslational events such as phosphorylation (8). SAHA-BPyne should constitute a powerful chemical tool for monitoring such changes in HDAC complex assembly and activity directly in native proteomes or living cells.
From a more technical perspective, our comparative ABPP-MudPIT results provide further evidence that nonisotopic mass spectrometry methods, such as spectral counting (25, 26) can be used to obtain semiquantitative information on the relative levels of proteins in biological samples. Furthermore, improvements in quantitation could be made by coupling ABPP-MudPIT with isotopic labeling methods (27, 28). Finally, we have shown that SAHA-BPyne can also be used to profile HDAC complexes in living cells. These in situ profiling experiments required exposure of cells to UV irradiation times of as little as 5 min to visualize HDAC targets. Interestingly, multiple SAHA-sensitive proteins were more strongly labeled in living cells compared with in vitro proteomic preparations, possibly indicating that the functional states of certain HDACs/HDAC complexes are compromised by cancer cell homogenization.
There are some potential limitations of this study that merit discussion. First, we only observed four of the eleven human class I/II HDACs as targets of SAHA-BPyne in the human cancer cell lines examined. There are several potential reasons why additional HDAC family members were not detected. First, it is possible that only a limited number of HDACs were present in these cell proteomes. A second consideration is that certain HDACs may have been too low in abundance in the proteomes for detection by ABPP-MudPIT. For example, due to low spectral counts and our strict criteria for assigning specific targets, HDAC3 was not included as target in melanoma cell proteomes, despite the fact that it was detected in 7 of the 12 samples treated with SAHA-BPyne and in none of the control proteomes (P < 0.01 for MUM2B, P < 0.05 for MUM2C). Additional studies with ovarian cancer lines demonstrated that HDAC3 is indeed a target of SAHA-BPyne, with an average of five spectral counts in SAHA-BPyne-treated samples versus no spectral counts in control proteomes. Future experiments with a wider range of proteomes that display different patterns of HDAC expression should clarify the family-wide profiling capacity of SAHA-BPyne. Additionally, the use of more purified fractions, such as nuclear preparations, can be analyzed to amplify the signal of lower abundance targets of SAHA-BPyne (SI Fig. 7). If this probe proves incapable of labeling certain HDAC family members, analogs in which the benzophenone group is repositioned relative to the zinc-chelating hydroxamic acid can be synthesized to increase photocross-linking efficiency.
A second remaining issue is that, under our current experimental protocols, all HDAC and HDAC-associated proteins are identified as a single collection. These data sets, therefore, do not yet provide a clear picture of the direct binding interactions between specific HDACs and their associated proteins. This issue could likely be addressed by using more selective inhibitors of individual HDACs (instead of the general inhibitor SAHA) as active site competitors. In this regard, it is also worth considering whether the continued search for selective inhibitors of individual HDACs might, itself, benefit from the use of activity-based probes like SAHA-BPyne that can interrogate HDAC active sites in native proteomes and living cells. Indeed, others have previously noted the importance of assessing the selectivity of HDAC inhibitors by screening these compounds against endogenous HDAC complexes (14).
Finally, our findings have important biomedical implications. SAHA and other HDAC inhibitors are currently in clinical development for a range of cancers (7). One potential concern with these agents is selectivity, especially given that hydroxamic acids targeting other enzyme classes (e.g., matrix metalloproteinases) encountered problems due to unacceptable levels of toxicity that may have been caused, at least in part, by “off-target” activity (30). Our initial proteomic data indicate that SAHA, despite its deceptively simple structure, is actually quite selective for HDACs. We did not observe any specific targets of SAHA-BPyne in melanoma proteomes other than HDAC or HDAC-associated proteins. These findings suggest that the benefits, as well as potential liabilities, that are observed for SAHA in the clinic will likely be due to the inhibition of HDACs, rather than other potential protein targets. More generally, HDACs are only one example of many enzyme classes that act as part of larger protein complexes in cells (30). Photoreactive chemical proteomic probes may offer a general tool to concurrently map the activity state of these enzymes and the protein interactions that regulate their function.
Methods
Chemical Synthesis.
Details of the synthesis and characterization of SAHA-BPyne are available in SI Text.
Proteome Labeling, Assay Protocol, and Data Analysis.
Proteome samples were diluted in PBS to 1 mg of protein per ml, and probes were added [100 nM SAHA-BPyne for positive runs; control runs contained either 10 μM SAHA + 100 nM SAHA-BPyne, 100 nM of the MP probe mixture (22), or no probe]. Samples were irradiated, subjected to click chemistry, and quenched with loading buffer (for gel analysis) or washed, enriched, and prepared (for MudPIT/gel spot identification/Western blot analysis), as described (21–23). Further detail can be found in SI Text. Analysis of SEQUEST search results from ABPP-MudPIT runs was carried out as described (21).
Supplementary Material
Acknowledgments
We acknowledge Heather S. Hoover for assistance with cell culture, Gabriel M. Simon for designing a program to align SEQUEST data, and the B.F.C. laboratory for their helpful discussions and suggestions. This work was supported by the American Cancer Society Grant PF-06-009-01-CDD (to C.M.S.), National Institutes of Health Grant CA087660, and the Skaggs Institute for Chemical Biology.
Abbreviations
- HAT
histone acetyltransferase
- HDAC
histone deacetylase
- SAHA
suberoylanilide hydroxamic acid
- ABPP
activity-based protein profiling
- MudPit
multidimensional protein identification technology.
Footnotes
The authors declare no conflict of interest.
This article is a PNAS direct submission.
This article contains supporting information online at www.pnas.org/cgi/content/full/0608659104/DC1.
References
- 1.Kuo MH, Allis CD. BioEssays. 1998;20:615–626. doi: 10.1002/(SICI)1521-1878(199808)20:8<615::AID-BIES4>3.0.CO;2-H. [DOI] [PubMed] [Google Scholar]
- 2.Minucci S, Pelicci PG. Nat Rev Cancer. 2006;6:38–51. doi: 10.1038/nrc1779. [DOI] [PubMed] [Google Scholar]
- 3.de Ruijter AJ, van Gennip AH, Caron HN, Kemp S, van Kuilenburg AB. Biochem J. 2003;370:737–749. doi: 10.1042/BJ20021321. [DOI] [PMC free article] [PubMed] [Google Scholar]
- 4.Blander G, Guarente L. Annu Rev Biochem. 2004;73:417–435. doi: 10.1146/annurev.biochem.73.011303.073651. [DOI] [PubMed] [Google Scholar]
- 5.Marks P, Rifkind RA, Richon VM, Breslow R, Miller T, Kelly WK. Nat Rev Cancer. 2001;1:194–202. doi: 10.1038/35106079. [DOI] [PubMed] [Google Scholar]
- 6.Richon VM, Webb Y, Merger R, Sheppard T, Jursic B, Ngo L, Civoli F, Breslow R, Rifkind RA, Marks PA. Proc Natl Acad Sci USA. 1996;93:5705–5708. doi: 10.1073/pnas.93.12.5705. [DOI] [PMC free article] [PubMed] [Google Scholar]
- 7.Kelly WK, Marks PA. Nat Clin Pract Oncol. 2005;2:150–157. doi: 10.1038/ncponc0106. [DOI] [PubMed] [Google Scholar]
- 8.Pflum MK, Tong JK, Lane WS, Schreiber SL. J Biol Chem. 2001;276:47733–47741. doi: 10.1074/jbc.M105590200. [DOI] [PubMed] [Google Scholar]
- 9.You A, Tong JK, Grozinger CM, Schreiber SL. Proc Natl Acad Sci USA. 2001;98:1454–1458. doi: 10.1073/pnas.98.4.1454. [DOI] [PMC free article] [PubMed] [Google Scholar]
- 10.Zhang Y, Ng HH, Erdjument-Bromage H, Tempst P, Bird A, Reinberg D. Genes Dev. 1999;13:1924–1935. doi: 10.1101/gad.13.15.1924. [DOI] [PMC free article] [PubMed] [Google Scholar]
- 11.Verdin E, Dequiedt F, Fischle W, Frye R, Marshall B, North B. Methods Enzymol. 2004;377:180–196. doi: 10.1016/S0076-6879(03)77010-4. [DOI] [PubMed] [Google Scholar]
- 12.Brackertz M, Gong Z, Leers J, Renkawitz R. Nucleic Acids Res. 2006;34:397–406. doi: 10.1093/nar/gkj437. [DOI] [PMC free article] [PubMed] [Google Scholar]
- 13.Yao YL, Yang WM. J Biol Chem. 2003;278:42560–42568. doi: 10.1074/jbc.M302955200. [DOI] [PubMed] [Google Scholar]
- 14.Curtin M, Glaser K. Curr Med Chem. 2003;10:2373–2392. doi: 10.2174/0929867033456576. [DOI] [PubMed] [Google Scholar]
- 15.Finnin MS, Donigian JR, Cohen A, Richon VM, Rifkind RA, Marks PA, Breslow R, Pavletich NP. Nature. 1999;401:188–193. doi: 10.1038/43710. [DOI] [PubMed] [Google Scholar]
- 16.Vannini A, Volpari C, Filocamo G, Casavola EC, Brunetti M, Renzoni D, Chakravarty P, Paolini C, De Francesco R, Gallinari P, et al. Proc Natl Acad Sci USA. 2004;101:15064–15069. doi: 10.1073/pnas.0404603101. [DOI] [PMC free article] [PubMed] [Google Scholar]
- 17.Liu Y, Patricelli MP, Cravatt BF. Proc Natl Acad Sci USA. 1999;96:14694–14699. doi: 10.1073/pnas.96.26.14694. [DOI] [PMC free article] [PubMed] [Google Scholar]
- 18.Speers AE, Cravatt BF. Chembiochem. 2004;5:41–47. doi: 10.1002/cbic.200300721. [DOI] [PubMed] [Google Scholar]
- 19.Webb Y, Zhou X, Ngo L, Cornish V, Stahl J, Erdjument-Bromage H, Tempst P, Rifkind RA, Marks PA, Breslow R, Richon VM. J Biol Chem. 1999;274:14280–14287. doi: 10.1074/jbc.274.20.14280. [DOI] [PubMed] [Google Scholar]
- 20.Speers AE, Adam GC, Cravatt BF. J Am Chem Soc. 2003;125:4686–4687. doi: 10.1021/ja034490h. [DOI] [PubMed] [Google Scholar]
- 21.Speers AE, Cravatt BF. Chem Biol. 2004;11:535–546. doi: 10.1016/j.chembiol.2004.03.012. [DOI] [PubMed] [Google Scholar]
- 22.Jessani N, Niessen S, Wei BQ, Nicolau M, Humphrey M, Ji Y, Han W, Noh DY, Yates JR, III, Jeffrey SS, Cravatt BF. Nat Methods. 2005;2:691–697. doi: 10.1038/nmeth778. [DOI] [PubMed] [Google Scholar]
- 23.Sieber SA, Niessen S, Hoover HS, Cravatt BF. Nat Chem Biol. 2006;2:274–281. doi: 10.1038/nchembio781. [DOI] [PMC free article] [PubMed] [Google Scholar]
- 24.Gu H, Liang Y, Mandel G, Roizman B. Proc Natl Acad Sci USA. 2005;102:7571–7576. doi: 10.1073/pnas.0502658102. [DOI] [PMC free article] [PubMed] [Google Scholar]
- 25.Liu H, Sadygov RG, Yates JR., III Anal Chem. 2004;76:4193–4201. doi: 10.1021/ac0498563. [DOI] [PubMed] [Google Scholar]
- 26.Pang JX, Ginanni N, Dongre AR, Hefta SA, Opitek GJ. J Proteome Res. 2002;1:161–169. doi: 10.1021/pr015518w. [DOI] [PubMed] [Google Scholar]
- 27.Everley PA, Krijgsveld J, Zetter BR, Gygi SP. Mol Cell Proteomics. 2004;3:729–735. doi: 10.1074/mcp.M400021-MCP200. [DOI] [PubMed] [Google Scholar]
- 28.Gygi SP, Rist B, Gerber SA, Turecek F, Gelb MH, Aebersold R. Nat Biotechnol. 1999;17:994–999. doi: 10.1038/13690. [DOI] [PubMed] [Google Scholar]
- 29.Coussens LM, Fingleton B, Matrisian LM. Science. 2002;295:2387–2392. doi: 10.1126/science.1067100. [DOI] [PubMed] [Google Scholar]
- 30.Gavin AC, Bosche M, Krause R, Grandi P, Marzioch M, Bauer A, Schultz J, Rick JM, Michon AM, Cruciat CM, et al. Nature. 2002;415:141–147. doi: 10.1038/415141a. [DOI] [PubMed] [Google Scholar]
Associated Data
This section collects any data citations, data availability statements, or supplementary materials included in this article.


