

Abstract
The fossil record of modern amphibians (frogs, salamanders, and caecilians) provides no evidence for major extinction or radiation episodes throughout most of the Mesozoic and early Tertiary. However, long-term gradual diversification is difficult to reconcile with the sensitivity of present-day amphibian faunas to rapid ecological changes and the incidence of similar environmental perturbations in the past that have been associated with high turnover rates in other land vertebrates. To provide a comprehensive overview of the history of amphibian diversification, we constructed a phylogenetic timetree based on a multigene data set of 3.75 kb for 171 species. Our analyses reveal several episodes of accelerated amphibian diversification, which do not fit models of gradual lineage accumulation. Global turning points in the phylogenetic and ecological diversification occurred after the end-Permian mass extinction and in the late Cretaceous. Fluctuations in amphibian diversification show strong temporal correlation with turnover rates in amniotes and the rise of angiosperm-dominated forests. Approximately 86% of modern frog species and >81% of salamander species descended from only five ancestral lineages that produced major radiations in the late Cretaceous and early Tertiary. This proportionally late accumulation of extant lineage diversity contrasts with the long evolutionary history of amphibians but is in line with the Tertiary increase in fossil abundance toward the present.
Keywords: amphibian evolution, macroevolutionary patterns, molecular timetree, paleobiology, phylogenetics
Present-day terrestrial ecosystems harbor >6,000 amphibian species worldwide (1), a diversity that parallels those of placental mammals and songbirds (2). Yet, the current rate at which amphibian faunas are declining exceeds that of any other vertebrate group and has been attributed to a combination of rapidly changing ecological and climatic conditions (habitat loss, invading pathogens, global warming, increased UV-radiation) (3). This raises questions of how the ancestors of modern amphibians coped with preceding environmental crises during their evolutionary history. The tetrapod fossil record identifies at least one major extinction episode that involved widespread amphibian declines: At the end-Permian [≈251 million years ago (Mya)], a diversity of 24 amphibian-like families (including reptiliomorphs and acanthrosaurs, which may be more related to modern amniotes) was reduced to 8 over a single geological stage boundary (4). The end-Permian mass extinction, estimated to be the most profound loss of vertebrate life on record (4–7), has been associated with a massive release of carbon gases in the atmosphere, causing a global greenhouse effect and abrupt climate warming (6, 7). Similar environmental perturbations have been postulated for subsequent periods and have been associated with fossil evidence for extinctions and subsequent radiations in several amniote groups (8–10). However, there is no correlated pattern for amphibian fossils.
There is little doubt that Mesozoic and Tertiary patterns in amphibian diversity were determined to a great extent by the diversification of the extant orders Anura, Caudata, and Gymnophiona (frogs, salamanders, and caecilians, respectively) (4, 11–14). Their evolutionary expansion throughout these periods has been described as a gradual process (4, 14), apparently unaffected by large-scale environmental changes until perhaps the end-Eocene “Grande Coupure” in Eurasia (≈35 Mya) and the Pleistocene glaciations (≈2–0.01 Mya) (14, 15). Fossil data indicate a notable increase in amphibian abundance toward the present but, in contrast to the amniote record, provide no evidence for late Cretaceous and early Tertiary extinctions and radiations. Such patterns would be expected if amphibians living in these periods were as sensitive as their modern descendants to environmental change or if they took opportunistic advantage of postextinction niche vacancy, as has been proposed for modern birds and placental mammals (16, 17).
Because of its incompleteness (5, 11, 12), the fossil record of amphibians sheds little light on the time and rate at which modern taxa attained their current diversity. Especially for amphibians with likely centers of diversification in Gondwana, (e.g., caecilians and neobatrachian frogs), the timing and intensity of important macroevolutionary trends are obscured by fossil scarcity. Molecular divergence time estimates based on extant taxa provide little information on absolute extinction rates in the past but may retain signatures of historical shifts in net diversification, which is a function of both speciation and extinction (18). Recent analyses of a single-gene data set (19) have resulted in the first timetree for amphibian evolution but provided relatively broad confidence intervals for divergence times. Other molecular clock analyses have been focused on specific parts of the amphibian tree, such as the basal splits among and within the three orders (20, 21) or the origin of single taxa (22–26). To obtain a more precise and comprehensive overview of amphibian net diversification through the Mesozoic and early Tertiary, we constructed an evolutionary timetree based on a 3.75-kb data set, combining one mitochondrial and four nuclear gene fragments for 171 amphibians. The included taxa cover 93–97% of the 36–54 living families and 89–92% of the 58–75 families plus subfamilies according to recent phylogenetically updated taxonomic classifications (27, 28) [see supporting information (SI) Table 1]. We use the resulting timetree to evaluate the opposite hypotheses that amphibian diversification has been gradual or episodic, the latter associated with the prediction that fluctuations parallel those of other taxa and are correlated with major events in Earth history. Our analyses of net diversification rates indicate major patterns in the rise of modern amphibians that could not be inferred from fossil data alone.
Results and Discussion
A Comprehensive Timetree for Amphibian Evolution.
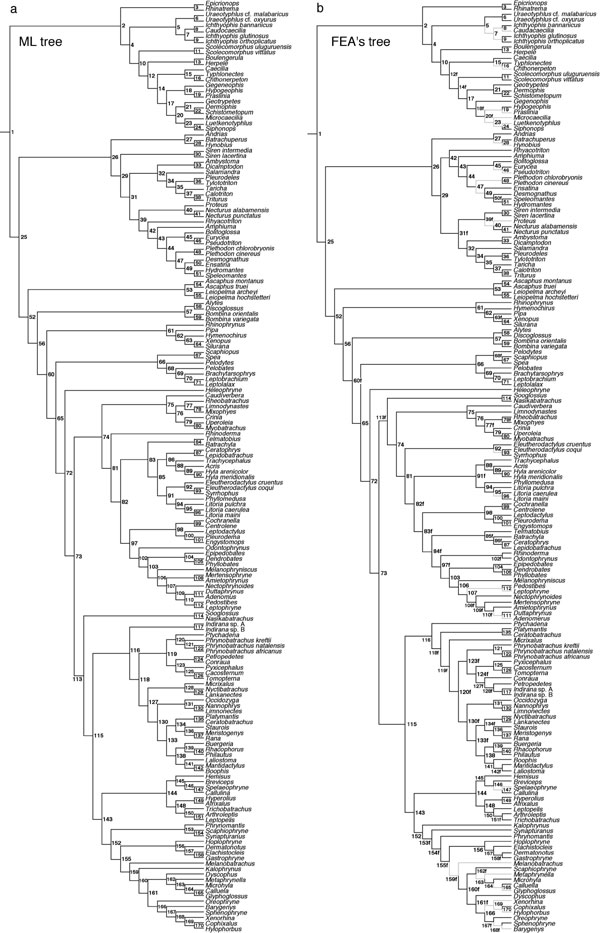
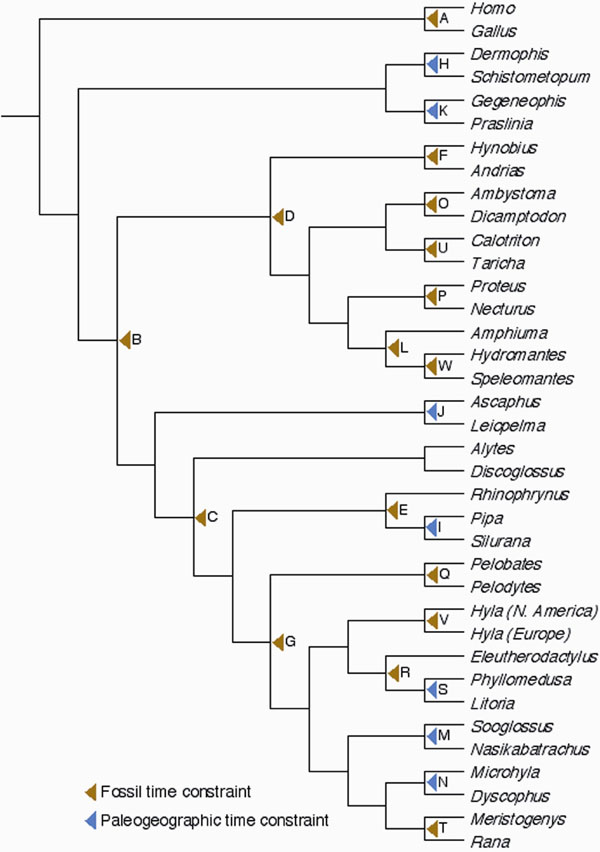
Heuristic maximum likelihood (ML) searches, nonparametric bootstrapping, and Bayesian analyses yielded a well resolved phylogenetic framework for Amphibia, with bootstrap support values ≥75% and Bayesian posterior probabilities ≥0.95 for 72% and 80% of all internal nodes, respectively. The ML tree (SI Fig. 3a) corroborates the findings of many recent studies (e.g., refs. 19–24, 26, and 29–37) and bears an overall high resemblance to the recently published Amphibian Tree of Life of Frost et al. (28). Examination of the amphibian fossil record and paleogeographic data in light of our phylogenetic results identified 15 fossils and 5 tectonic events that provided conservative minimum age constraints for 22 divergences distributed across the amphibian tree (SI Table 2 and SI Fig. 4). Calibration of our ML tree using these age constraints in combination with the Bayesian relaxed molecular clock model of Thorne and Kishino (38) resulted in the amphibian timetree depicted in Fig. 1. Analyses with a penalized likelihood (PL) relaxed-clock model (39) produced overall slightly younger divergence time estimates (see SI Text and SI Data Set 1). Additionally, dating analyses on a phylogram constrained to be compatible with the tree of Frost et al. (28) (SI Fig. 3b) yielded very similar age estimates for equally resolved nodes, indicating that our divergence time estimates are relatively robust to remaining ambiguities in amphibian phylogenetics.
Fig. 1.

Phylogenetic patterns of net diversification in the history of modern amphibians. (a) Evolutionary timetree based on the ML tree, Thorne and Kishino's relaxed molecular clock model, and minimum time constraints on 22 amphibian divergences derived from fossil and paleogeographic evidence (see SI Text and SI Table 2). Divergence time estimates and corresponding 95% credibility intervals for all nodes are provided in SI Data Set 1. Branch support is indicated as follows: filled squares, ML bootstrap support ≥75% and Bayesian posterior probability ≥0.95; right-pointing filled triangles, bootstrap support <75% and Bayesian posterior probability ≥0.95; left-pointing filled triangles, bootstrap support ≥75% and Bayesian posterior probability <0.95. Label numbers represent rank positions when clades are sorted from highest net diversification rate to lowest. Divergences that represent at least a doubling of the clade-specific net diversification rate are indicated in bold. (b) Net diversification rates estimated per clade under relative extinction rates d:b = 0 (red) and d:b = 0.95 (blue). Clade numbers are cross-referenced in the timetree. (c) Comparison of the proportional diversity of extant clades at the beginning of the late Cretaceous and at present.
Regardless of the dating method or tree, all analyses agree on the time frames in which several major amphibian clades were established (Fig. 1a). They place the early diversification of the three modern orders in the Triassic/early Jurassic, of Natatanura [Ranidae sensu (26, 27)] and Microhylidae in the late Cretaceous, and of the primarily South American Nobleobatrachia [Hyloidea sensu (19, 30, 32)] around the Cretaceous–Tertiary boundary. The two most species-rich salamander families, Plethodontidae (mainly North American) and Salamandridae (mainly Eurasian), were also found to have undergone most of their early diversification in the Tertiary, although the Bayesian dating method and PL analyses alternatively supported late Cretaceous or early Tertiary origins for their initial splits (SI Data Set 1). Our taxon sampling of Asian Hynobiidae, the third largest salamander family, does not allow assessment of its origin of diversification, but a recent study provides evidence for an additional early Tertiary radiation within this family (25).
Our timetree gains credibility from its congruence with previous relaxed-clock studies based on nuclear sequences or combined nuclear plus mitochondrial data sets for smaller taxon samples, or focusing on restricted parts of the amphibian tree (19, 20, 23, 24, 26, 30, 31). Our estimates are particularly in line with the results of San Mauro et al. (19), inferred from RAG1 sequences of 44 taxa. Despite differences in prior choice and calibration points, mean divergence time estimates in both studies show small differences, with strong overlap of their 95% credibility intervals. In contrast, we find several major clades to be considerably younger than previously estimated by using large mitochondrial data sets. Zhang et al. (21) recovered a Permian/early Triassic origin for crown-group caecilians [250 (224–274) Mya], a Carboniferous/Permian [290 (268–313) Mya] origin for crown-group anurans, and a mid-Cretaceous [97 (87–115) Mya] age for Nobleobatrachia. Mueller (22), based on complete mitochondrial sequences, inferred a late Jurassic/early Cretaceous [129 (109–152) Mya] age for the earliest plethodontid divergences. Our younger age estimates cannot be explained by differences in calibration point selection alone, because the mentioned studies either included one or few minimum time constraints or added maximum time constraints. Instead, it is more likely that the observed discrepancies mainly reflect differences in taxon sampling (extensive sampling in a single clade but not outside vs. more balanced sampling across the amphibian tree) and gene selection [mitochondrial protein-coding genes evolve 3–22 times faster than our nuclear markers, posing increased risks of mutational saturation and biases in branch length estimation (see SI Text)].
Clade-Specific Patterns of Amphibian Diversification.
To examine variation in net diversification across the amphibian timetree, we estimated net diversification rates (b − d, where b is the speciation rate and d is the extinction rate) per clade under the lowest possible relative extinction rate (d:b = 0) and under an extremely high relative extinction rate [d:b = 0.95 (see Methods)]. With a known diversity of 6,009 modern species (1) and an estimated basal split at 368.8 Mya (SI Data Set 1), amphibians exhibit an average net diversification rate of 0.0217 events per lineage per million years (Myr) under d:b = 0 and 0.0154 events per lineage per Myr under d:b = 0.95. However, rate estimates varied considerably among nested clades, from 0.00542 events per lineage per Myr (d:b = 0) and 0.000964 events per lineage per Myr (d:b = 0.95) in Leiopelmatidae, to 0.1238 events per lineage per Myr (d:b = 0) in Ranidae and 0.0789 events per lineage per Myr (d:b = 0.95) in Nobleobatrachia (Fig. 1b). Although anuran taxa generally exhibit the highest rates, there is no apparent phylogenetic pattern. The highest rates tend to be concentrated in more recent clades, and the 10 fastest-diversifying clades are all younger than 80 Myr.
To identify major accelerations in net diversification in the amphibian tree, we compared per clade the rates immediately prior and posterior to its earliest split (SI Fig. 5). This approach has the advantage over often-used tree-balance methods (40) in that (i) temporal variation of net diversification within the clade of interest is taken into account, and (ii) diversification rates are compared among consecutive branches (ancestor–descendant) rather than sister branches (allowing distinction of acceleration from deceleration). Our analyses show that the initial divergences of living Anura, Caudata, and Gymnophiona represent some of the most profound accelerations of net diversification in amphibian history (Fig. 1a), despite occurring at moderate absolute rates. The strongest rate shifts are recorded for the frog and salamander taxa that began radiating in the late Cretaceous and early Tertiary: the basal divergences of Microhylidae, Natatanura, Nobleobatrachia, Plethodontidae, and Salamandridae represent abrupt 3- to 20-fold increases in net diversification rate. Their radiations caused major turnovers in the composition of amphibian lineages. A comparison of relative clade sizes at subsequent times (Fig. 1c) indicates that the proportional diversity of extant anuran lineages steadily increased throughout the Mesozoic and then rapidly rose to dominance from the late Cretaceous on (up to ≈89%). A similar pattern occurred within orders, with the Tertiary rise to numerical dominance of salamandrids and plethodontids within Caudata (up to ≈81%), and of natatanurans, microhylids, and nobleobatrachians within Anura (up to ≈86%). The major centers of diversification of these clades together covered most continents in both hemispheres, entailing lineage turnover at a worldwide scale. In addition, lineages that originated during these radiations exhibit a broad array of ecological specialists, including aposematic, fully aquatic, torrent-adapted and fossorial species and, notably, the first arboreal frog and salamander lineages. The (mainly fossorial) caecilians appear to have diversified more gradually throughout the Mesozoic, but increased taxon sampling of their most speciose clades (ichthyophiid and caeciliid lineages) is required to test for comparable late Cretaceous or early Tertiary radiations.
The end-Cretaceous radiations of natatanuran and microhylid frogs imply a “mass survival” (41) of multiple lineages across the Cretaceous–Tertiary boundary. Some of the surviving lineages are represented by only few relict species (e.g., Lankanectes, Phrynomantis, and Melanobatrachus), but several others began substantial radiations in the Paleocene and Eocene (e.g., Dicroglossidae, Mantellidae, Rhacophoridae, Ranidae, Microhylinae, and Gastrophryinae). The resulting pattern approximates a “long fuse” diversification model, as proposed for the ordinal radiation of placental mammals (16, 42). Conversely, the mainly South American Nobleobatrachia (including toads, poison-arrow frogs, glass frogs, and several lineages of tree frogs) fit the pattern of opportunistic radiation in the aftermath of the Cretaceous–Tertiary extinction episode, corresponding to an “explosive” diversification model as described for birds and mammals (16, 17, 42). Interestingly, post-Cretaceous–Tertiary radiations in South America seem to have occurred also in other faunal lineages, including chrysomelid leaf beetles (43), suboscine songbirds (2), and possibly marsupials (44) and xenarthan placentals (42, 45).
Global Patterns of Amphibian Diversification.
To evaluate whether amphibian net diversification as a whole is consistent with a gradual process of lineage accumulation, we converted our timetree into a lineage-through-time (LTT) plot (Fig. 2). Goodness-of-fit tests indicate that this plot significantly departs from expectations under constant-diversification models with d:b ratios ranging from 0 to 0.9 [P ≤ 0.001; Bonferroni-corrected α = 0.01 (Fig. 2a)]. Conversely, a null model with a d:b ratio of 0.95 could not be rejected (P = 0.065). Combined with the estimated net diversification rate (b − d) of 0.0154 events per lineage per Myr (Fig. 1b), a d:b ratio of 0.95 implies remarkably high average speciation and extinction rates (b = 0.308 events per lineage per Myr; d = 0.2926 events per lineage per Myr), and thus high amphibian turnover. In addition, Markov-chain constant-rate tests (46) indicate a disproportionally late accumulation of extant lineages compared with all tested null models, except when d:b = 0.95 [P ≤ 0.001 for d:b = 0 → 0.9; P = 0.391 for d:b = 0.95 (Fig. 2a)]. This finding suggests that amphibian net diversification either accelerated toward the present or was characterized by a high overall extinction rate throughout its history.
Fig. 2.

Global patterns of amphibian net diversification. (a) LTT plot derived from the timetree, compared with constant-diversification models with relative extinction rates (b:d) ranging from 0 to 0.95. Asterisks indicate rejection of the null model by a goodness-of-fit test and a Markov-chain constant-rate test (Bonferroni-corrected α = 0.01). (b) RTT plot showing net diversification rates estimated under d:b = 0 (red) and d:b = 0.95 (blue) for successive 20-Myr intervals (280–100 Mya) and 10-Myr intervals (100–20 Mya). Rate estimates that significantly differ from those expected under constant diversification along the entire plot (P < 0.05) are indicated by a circle (d:b = 0) or an asterisk (d:b = 0.95). (c) Comparison of amphibian net diversification rates (blue, back) with amniote family origination and extinction rates documented by the fossil record (green, middle and red, front, respectively) (4). Note that amphibian and amniote rates are represented at different scales. The green rectangle represents the time window in which angiosperms underwent their major radiation (47).
Rate-through-time (RTT) plots of net diversification provide more detailed insights in temporal patterns of amphibian lineage accumulation (Fig. 2b). Net diversification rates estimated under the two most extreme relative extinction rates considered (d:b = 0 and d:b = 0.95) are very different for the earliest measured time intervals but converge rapidly in subsequent periods. They show an initial acceleration of diversification in the Triassic (≈240–200 Mya), followed by stabilization in the Jurassic and early Cretaceous (≈200–100 Mya). After declining to a minimum in the earliest stages of the late Cretaceous (≈100–80 Mya), amphibian diversification experienced a major upsurge near the end of the Cretaceous and continued at an elevated rate throughout the Paleocene and early Eocene (≈80–40 Mya). Per-interval comparison of these rates with those expected under constant net diversification throughout the time plot indicate significant deviations (P < 0.05) in the early Triassic (under d:b = 0) and in the late Cretaceous/early Tertiary (under d:b = 0 and d:b = 0.95). Additional analyses based on PL or the tree of Frost et al. (28) resulted in very congruent LTT and RTT plots, confirming that these findings are robust to the choice of dating method or phylogenetic hypothesis.
The inferred amphibian diversification rates show striking temporal correlation with origination and extinction rates evidenced by the amniote fossil record (4) (amniote origination, R2 = 0.775; extinction, R2 = 0.695; P < 0.001 in both cases). Visual comparison reveals at least two prominent parallelisms (Fig. 2c). First, the acceleration of amphibian net diversification in the Triassic coincides with the establishment of a renewed amniote fauna after the end-Permian mass extinction (5–7). Paleontological reconstructions of this episode have suggested a relatively slow recovery of tetrapod diversity, with the delayed appearance of several ecological guilds expected to include most amphibians, such as small aquatic specialists and insectivores (6). This is consistent with our divergence age estimates, which indicate that the initial radiations of the three modern orders were less pronounced and took appreciably more time than those of more recent clades. Second, the end-Cretaceous acceleration parallels the increased turnover of amniote groups that dominated late Mesozoic terrestrial ecosystems, including dinosaurs, pterosaurs, archaic birds, and marsupials (4, 5, 16, 17). In addition, the subsequent episode of elevated diversification closely tracks the rapid rise and turnover of angiosperm-dominated forests (47), as well as co-radiations of several major insect groups [ants, coleopterans, and hemipterans (43, 48)]. It seems likely that the resulting availability of new and progressively more complex forest habitats with a simultaneous increase in prey diversity advanced the proliferation of modern amphibians.
Conclusions
Our results, inferred from extant taxa, provide evidence for substantial fluctuations in the history of amphibian net diversification and reject the hypothesis of gradual lineage accumulation. An average extinction rate of 0.2926 events per lineage per Myr, as predicted under the best-fitting constant-diversification model, seems very high: for the present-day diversity of 6,009 known species, this would correspond to an average of 1,725 extinctions per Myr. Nevertheless, as far as extrapolations to smaller time frames are tenable, this figure confirms that recent amphibian extinctions (9–122 extinctions in the past 26 years according to ref. 3, i.e., ≈200–2,700 times faster) are far too frequent to represent background extinction. The congruence between our molecular findings and trends in the fossil record of amniotes increases the credibility of our results, as well as that of disputed paleontological patterns. Most importantly, the observation that multiple amphibian radiations parallel those of amniote groups with better fossil records accentuates the importance of late Cretaceous and early Tertiary biotic turnover in the origin of modern terrestrial biodiversity. The hypothesis that the diversification of amphibians was enhanced by the rise of angiosperms provides a plausible explanation for the relatively late, independent origins of multiple arboreal lineages in frogs and salamanders and for the fact that ≈82% of recent amphibian species live in forests (3).
Unlike the disparity between molecular and paleontological time estimates for the rise of modern birds and mammals (2, 16, 17, 41, 42), our findings show relative congruence with the limited fossil data available for modern amphibians. Taken at face value, a proportionally late accumulation of extant lineage diversity suggests that the Tertiary enrichment of fossil taxa (4, 5, 14) may reflect an increase in amphibian abundance rather than improved quality of the fossil record toward the present. Despite the imperfections of molecular dating (49), our timetree compensates for several persistent problems of the amphibian fossil record, including its fragmentary nature in the southern hemisphere and the absence of a robust phylogenetic framework for many fossil taxa. Linking molecular patterns of diversification with trends in the general tetrapod fossil record provides a new synthesis of independent data from which both molecular biologists and paleontologists can benefit.
Methods
Detailed descriptions of methods and results are provided in the SI.
Phylogeny Inference and Timetree Construction.
The analyzed data set (3,747 unambiguously aligned base pairs) is a concatenation of DNA fragments of one mitochondrial gene (16S rRNA) and four nuclear genes (CXCR4, NCX1, RAG1, and SLC8A3), sampled for 171 amphibians [24 caecilians, 27 salamanders, and 120 frogs (SI Table 1)]. Four amniotes and combined sequences of two fishes served as outgroups (SI Table 3). Heuristic ML searches, nonparametric bootstrap analyses (1,000 replicates), and Bayesian MCMC runs were performed with a GTR+G+I model of DNA evolution, selected via likelihood ratio tests. Divergence time analyses under Thorne and Kishino's Bayesian relaxed-clock model were performed with Multidivtime (38), and PL relaxed-clock analyses were performed with r8s 1.70 (39). Confidence intervals for the PL age estimates were obtained by replicate analysis of 1,000 randomly sampled trees from the posterior tree set produced by the Bayesian phylogeny analyses. A detailed discussion of selection and evaluation of dating methods, priors, parameters, and calibration points is provided in SI Text and SI Fig. 6.
Phylogenetic Patterns of Net Diversification.
Per-clade net diversification rates under (d:b) ratios of 0 and 0.95 were estimated by using a method-of-moment estimator (18) derived from Nt = N0·e(b − d)t/[1 − [(d:b)[(e(b − d)t − 1)/[e(b–d)t − (d:b)]]]N0], where N0 is the starting number of lineages (for a clade, 1N0 = 2), Nt is the final number of lineages (present-day species diversity), t is the time interval considered (time since earliest split), and (b − d) is the net diversification rate. Accelerations in net diversification were inferred per clade as the ratio of the net diversification rate immediately posterior to its earliest split over the rate immediately before this split. The “presplit” net rate was determined by the duration of the preceding branch [the time needed for the clade to grow from one to two lineages (see SI Fig. 5)]; the “postsplit” net rate was arbitrarily determined by the succession of the next three divergences in the clade (the time needed to grow from two to five lineages).
Global Patterns of Net Diversification.
Null models of constant diversification under d:b ratios of 0, 0.5, 0.75, 0.9, and 0.95 were approximated by Markov-chain tree simulations (50). Per null model, 1,000 trees were simulated to a standing diversity of 6,009 terminals and pruned to a sampling size of 171. The resulting 171-taxon trees were used to infer mean LTT curves (the null models in Fig. 2a), critical values for the test statistics, and null distributions for net diversification rates. The empirical LTT plot was compared with all null models by Kolmogorov–Smirnov tests and Markov-chain constant-rate tests (46). RTT plots of net diversification were obtained by solving the equation given above (18) for successive 20-Myr intervals (280–100 Mya) and 10-Myr intervals (100–20 Mya). For each interval, estimated rates under d:b = 0 and d:b = 0.95 were tested against the simulated 95% credibility intervals, reflecting constant diversification through time. Amniote RTT plots were based on the reptile, avian, and mammal chapters of the Fossil Record 2′ database (4). Here, time intervals were necessarily determined by geological stage boundaries (51). Amniote family origination and extinction rates were estimated as NO/tNt and NE/tNt, respectively (5), where NO and NE are the number of families that respectively originate and disappear during time interval t, and Nt is the family diversity at the end of the interval. To provide a comparable measure, amphibian net diversification rates were estimated as (Nt − N0)/tNt.
Supplementary Material
Acknowledgments
We thank R. Boistel, R. M. Brown, D. C. Cannatella, S. Donnellan, R. C. Drewes, A. Gluesenkamp, S. Hauswaldt, R. F. Inger, C. Jared, J. A. Johnson, G. J. Measey, R. A. Nussbaum, R. Pethiyagoda, E. F. Schwartz, E. Scott, M. Vences, J. Vindum, H. Voris, D. B. Wake, and D. W. Weisrock for providing tissue samples; J. Thorne for advice on the MultiDivtime software; M. J. Benton for allowing us the use of the Fossil Record 2 database; M. J. Benton and D. San Mauro for suggestions to improve the manuscript; and the following people for laboratory assistance, logistic support, or advice: I. Das, M. di Bernardo, K. Howell, A. Mannaert, M. Menegon, M. C. Milinkovitch, D. Raheem, M. Urbina, K. Willibal, Frontier-Tanzania, and the University of Dar es Salaam. This work was supported by Fonds voor Wetenschappelijk Onderzoek–Vlaanderen Grants 1.5.039.03N, G.0056.03, and G.0307.04 (to F.B.); Onderzoeksraad, Vrije Universiteit Brussel Grants OZR834 and OZR1068 (to K.R. and F.B.); Natural Environment Research Council Grant GST/02/832 (to M.W.); Natural Environment Research Council Studentship S/A/2000/03366 (to S.P.L.); a grant from the Percy Sladen Memorial Fund (to M.W.); and grants from the Natural History Museum of London's Museum and Zoology Research Funds (to D.J.G. and M.W.).
Abbreviations
- LTT
lineage-through-time
- ML
maximum likelihood
- Mya
million years ago
- Myr
million years
- PL
penalized likelihood
- RTT
rate-through-time.
Footnotes
The authors declare no conflict of interest.
This article is a PNAS direct submission.
Data deposition: The sequences reported in this paper have been deposited in the GenBank database (accession nos. AY948743–AY948944, EF107160–EF107500, and EFl10994–EFl10998).
This article contains supporting information online at www.pnas.org/cgi/content/full/0608378104/DC1.
References
- 1.Frost DR. Amphibian Species of the World, an Online Reference. New York: Am Mus Nat Hist; 2006. Ver 4. Available at http://research.amnh.org/herpetology/amphibia/index.php. [Google Scholar]
- 2.Barker FK, Cibois A, Schikler P, Feinstein J, Cracraft J. Proc Natl Acad Sci USA. 2004;101:11040–11045. doi: 10.1073/pnas.0401892101. [DOI] [PMC free article] [PubMed] [Google Scholar]
- 3.Stuart SN, Chanson JS, Cox NA, Young BE, Rodrigues AS, Fischman DL, Waller RW. Science. 2004;306:1783–1786. doi: 10.1126/science.1103538. [DOI] [PubMed] [Google Scholar]
- 4.Benton MJ. The Fossil Record 2. London: Chapman & Hall; 1993. [Google Scholar]
- 5.Benton MJ. Philos Trans R Soc London B. 1989;325:369–386. doi: 10.1098/rstb.1989.0094. [DOI] [PubMed] [Google Scholar]
- 6.Benton MJ, Tverdokhlebov VP, Surkov MV. Nature. 2004;432:97–100. doi: 10.1038/nature02950. [DOI] [PubMed] [Google Scholar]
- 7.Bowring SA, Erwin DH, Isozaki Y. Proc Natl Acad Sci USA. 1999;96:8827–8828. doi: 10.1073/pnas.96.16.8827. [DOI] [PMC free article] [PubMed] [Google Scholar]
- 8.Wilson PA, Norris RD. Nature. 2001;412:425–429. doi: 10.1038/35086553. [DOI] [PubMed] [Google Scholar]
- 9.Wilf P, Johnson KR, Huber BT. Proc Natl Acad Sci USA. 2003;100:599–604. doi: 10.1073/pnas.0234701100. [DOI] [PMC free article] [PubMed] [Google Scholar]
- 10.Jenkyns HC. Philos Trans R Soc London A. 2003;361:1885–1916. doi: 10.1098/rsta.2003.1240. [DOI] [PubMed] [Google Scholar]
- 11.Evans SE, Sigogneau-Russell D. Palaeontology. 2001;44:259–273. [Google Scholar]
- 12.Gao KQ, Shubin NH. Nature. 2003;422:424–428. doi: 10.1038/nature01491. [DOI] [PubMed] [Google Scholar]
- 13.Rocek Z. Amphibian Biology. In: Heatwole H, Carroll RL, editors. Palaeontology, the Evolutionary History of Amphibians. Vol 4. Chipping Norton, Australia: Surrey Beatty & Sons; 2000. pp. 1295–1331. [Google Scholar]
- 14.Sanchiz B, Rocek Z. In: The Biology of Xenopus. Tinsley RC, Koble HR, editors. London: Zool Soc of London; 1996. pp. 317–328. [Google Scholar]
- 15.Rage J-C, Rocek Z. Amphibia-Reptilia. 2003;24:133–167. [Google Scholar]
- 16.Archibald JD, Deutschman DH. J Mammal Evol. 2001;8:107–124. [Google Scholar]
- 17.Feduccia A. Trends Ecol Evol. 2003;18:172–176. [Google Scholar]
- 18.Magallón S, Sanderson MJ. Evolution (Lawrence, Kans) 2001;55:1762–1780. doi: 10.1111/j.0014-3820.2001.tb00826.x. [DOI] [PubMed] [Google Scholar]
- 19.San Mauro D, Vences M, Alcobendas M, Zardoya R, Meyer A. Am Nat. 2005;165:590–599. doi: 10.1086/429523. [DOI] [PubMed] [Google Scholar]
- 20.Roelants K, Bossuyt F. Syst Biol. 2005;54:111–126. doi: 10.1080/10635150590905894. [DOI] [PubMed] [Google Scholar]
- 21.Zhang P, Zhou H, Chen YQ, Liu YF, Qu LH. Syst Biol. 2005;54:391–400. doi: 10.1080/10635150590945278. [DOI] [PubMed] [Google Scholar]
- 22.Mueller RL. Syst Biol. 2006;55:289–300. doi: 10.1080/10635150500541672. [DOI] [PubMed] [Google Scholar]
- 23.van der Meijden A, Vences M, Hoegg S, Meyer A. Mol Phylogenet Evol. 2005;37:674–685. doi: 10.1016/j.ympev.2005.05.001. [DOI] [PubMed] [Google Scholar]
- 24.Vences M, Vieites DR, Glaw F, Brinkmann H, Kosuch J, Veith M, Meyer A. Proc Biol Sci. 2003;270:2435–2442. doi: 10.1098/rspb.2003.2516. [DOI] [PMC free article] [PubMed] [Google Scholar]
- 25.Zhang P, Chen Y-Q, Zhou H, Liu Y-F, Wang X-L, Papenfuss TJ, Wake DB, Qu L-H. Proc Natl Acad Sci USA. 2006;103:7360–7365. doi: 10.1073/pnas.0602325103. [DOI] [PMC free article] [PubMed] [Google Scholar]
- 26.Bossuyt F, Brown RM, Hillis DM, Cannatella DC, Milinkovitch MC. Syst Biol. 2006;55:579–594. doi: 10.1080/10635150600812551. [DOI] [PubMed] [Google Scholar]
- 27.Dubois A. Alytes. 2005;23:1–24. [Google Scholar]
- 28.Frost DR, Grant T, Faivovich J, Bain RH, Haas A, Haddad CFB, De Sa RO, Channing A, Wilkinson M, Donnellan SC, et al. Bull Am Mus Nat Hist. 2006;297:1–370. [Google Scholar]
- 29.Wilkinson M, Sheps AJ, Oommen OV, Cohen BL. Mol Phylogenet Evol. 2002;23:401–407. doi: 10.1016/s1055-7903(02)00031-3. [DOI] [PubMed] [Google Scholar]
- 30.Biju SD, Bossuyt F. Nature. 2003;425:711–714. doi: 10.1038/nature02019. [DOI] [PubMed] [Google Scholar]
- 31.Chippindale PT, Bonett RM, Baldwin AS, Wiens JJ. Evolution (Lawrence, Kans) 2004;58:2809–2822. doi: 10.1111/j.0014-3820.2004.tb01632.x. [DOI] [PubMed] [Google Scholar]
- 32.Darst CR, Cannatella DC. Mol Phylogenet Evol. 2004;31:462–475. doi: 10.1016/j.ympev.2003.09.003. [DOI] [PubMed] [Google Scholar]
- 33.Mueller RL, Macey JR, Jaekel M, Wake DB, Boore JL. Proc Natl Acad Sci USA. 2004;101:13820–13825. doi: 10.1073/pnas.0405785101. [DOI] [PMC free article] [PubMed] [Google Scholar]
- 34.San Mauro D, Gower DJ, Oommen OV, Wilkinson M, Zardoya R. Mol Phylogenet Evol. 2004;33:413–427. doi: 10.1016/j.ympev.2004.05.014. [DOI] [PubMed] [Google Scholar]
- 35.van der Meijden A, Vences M, Meyer A. Proc R Soc London Ser B. 2004;271(Suppl):S378–S381. doi: 10.1098/rsbl.2004.0196. [DOI] [PMC free article] [PubMed] [Google Scholar]
- 36.Wiens J, Bonett R, Chippindale P. Syst Biol. 2005;54:91–110. doi: 10.1080/10635150590906037. [DOI] [PubMed] [Google Scholar]
- 37.Weisrock DW, Papenfuss TJ, Macey JR, Litvinchuk SN, Polymeni R, Ugurtas IH, Zhao E, Jowkar H, Larson A. Mol Phylogenet Evol. 2006;41:368–383. doi: 10.1016/j.ympev.2006.05.008. [DOI] [PubMed] [Google Scholar]
- 38.Thorne JL, Kishino H. Syst Biol. 2002;51:689–702. doi: 10.1080/10635150290102456. [DOI] [PubMed] [Google Scholar]
- 39.Sanderson MJ. Mol Biol Evol. 2002;19:101–109. doi: 10.1093/oxfordjournals.molbev.a003974. [DOI] [PubMed] [Google Scholar]
- 40.Moore BR, Chan KMA, Donoghue PCJ. In: Phylogenetic Supertrees: Combining Information to Reveal the Tree of Life. Bininda-Emonds ORP, editor. Dordrecht, The Netherlands: Kluwer Academic; 2004. pp. 487–533. [Google Scholar]
- 41.Cooper A, Penny D. Science. 1997;275:1109–1113. doi: 10.1126/science.275.5303.1109. [DOI] [PubMed] [Google Scholar]
- 42.Springer MS, Murphy WJ, Eizirik E, O'Brien SJ. Proc Natl Acad Sci USA. 2003;100:1056–1061. doi: 10.1073/pnas.0334222100. [DOI] [PMC free article] [PubMed] [Google Scholar]
- 43.McKenna DD, Farrell BD. Proc Natl Acad Sci USA. 2006;103:10947–10951. doi: 10.1073/pnas.0602712103. [DOI] [PMC free article] [PubMed] [Google Scholar]
- 44.Nilsson MA, Gullberg A, Spotorno AE, Arnason U, Janke A. J Mol Evol. 2003;57(Suppl 1):S3–S12. doi: 10.1007/s00239-003-0001-8. [DOI] [PubMed] [Google Scholar]
- 45.Delsuc F, Vizcaino SF, Douzery EJ. BMC Evol Biol. 2004;4:11. doi: 10.1186/1471-2148-4-11. [DOI] [PMC free article] [PubMed] [Google Scholar]
- 46.Pybus OG, Harvey PH. Proc Biol Sci. 2000;267:2267–2272. doi: 10.1098/rspb.2000.1278. [DOI] [PMC free article] [PubMed] [Google Scholar]
- 47.Schneider H, Schuettpelz E, Pryer KM, Cranfill R, Magallon S, Lupia R. Nature. 2004;428:553–557. doi: 10.1038/nature02361. [DOI] [PubMed] [Google Scholar]
- 48.Moreau CS, Bell CD, Vila R, Archibald SB, Pierce NE. Science. 2006;312:101–104. doi: 10.1126/science.1124891. [DOI] [PubMed] [Google Scholar]
- 49.Benton MJ, Ayala FJ. Science. 2003;300:1698–1700. doi: 10.1126/science.1077795. [DOI] [PubMed] [Google Scholar]
- 50.Rambaut A. PhyloGen. 2002 ( http://evolve.zoo.ox.ac.uk/software/PhyloGen/main.html), Ver 1.1.
- 51.Gradstein FM, Ogg JG, Smith AG, Agterberg FP, Bleeker W, Cooper RA, Davydov V, Gibbard P, Hinnov LA, House MR, et al. A Geologic Time Scale 2004. Cambridge, UK: Cambridge Univ Press; 2004. [Google Scholar]
Associated Data
This section collects any data citations, data availability statements, or supplementary materials included in this article.